The Atlantic Telegraph Company completed an undersea telegraph cable across the Atlantic Ocean in 1866. Prior to the telegraphic connection a minimum eight day voyage by steamship linked the capital markets of the United States and Europe. Thereafter information flowed across the Atlantic at the speed of an electrical impulse.
This article considers the change in capital market information flows due to the exogenous technological advance of the telegraph. The introduction of the Atlantic Cable offers an excellent opportunity to investigate a change in the structure of information. Marginal modern increases in the speed of information transmission are small relative to the rate of price quotation. By contrast, the telegraph shortened information transmission time by the length of an ocean voyage across the Atlantic, about nine to 14 days. Because securities markets quote daily prices during this period, multiple price observations can be found between information shocks. Thus, information can be observed originating in one market and arriving in another.
Did market participants take advantage of technological advances? Prices in highly integrated markets should converge to prevent arbitrage opportunities. If financial markets took advantage of new information and transactions costs were sufficiently low, then prices set after the introduction of the telegraph should reflect zero-day-old information by telegraph instead of at least eight-day-old information by steamship. In fact, historical markets priced securities so well that information on travel times can be extracted from stock prices. Furthermore, information travel times decreased upon the introduction of the telegraph.
PREVIOUS LITERATURE
Previous work demonstrates that the introduction of the telegraph coincided with price convergence between the New York and London Stock Exchanges. Kenneth Garbade and William Silber attribute an increase in price convergence to the introduction of the Atlantic Cable on 27 July 1866.1
Garbade and Silber, “Technology.”
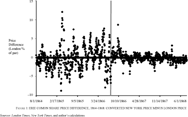
The authors' analysis is biased toward finding market integration. Garbade and Silber base their pretelegraph estimate of price divergence on three months of data. Unfortunately, these months bracket the May 1866 Overend, Gurney and Co. banking crisis in London. This severe shock to the London market caused high price differentials between the two markets when asset prices in London fell. The high price differential during the crisis overstates the lack of integration before the introduction of the telegraph.
In another study, Ranald Michie claims that the telegraph increased market integration between New York and London.2
Michie, London and New York Stock Exchanges, pp. 46–47.
Michie's test is also biased toward finding more integration. Larry Neal describes 1860 as a “worst case” year for examining market integration.3
Neal, “Technological Advance,” p. 12.
Neal, “Disintegration.”
Both studies use only the timing of the change in regime to make the causal inference. Many other events during the period can explain observed price convergence because the introduction of the Atlantic Cable occurred nearly simultaneously with other major shocks. In addition to the Overend, Gurney crisis, the introduction of the telegraph coincided with a decrease in market uncertainty following the American Civil War. Both share prices and the gold premium over greenbacks were less volatile after the introduction of the telegraph. Because of the changes in the price volatility before the cable was introduced, one would already expect to find convergence. Although previous work is very suggestive that the telegraph caused price convergence, this article attempts to provide more conclusive evidence. The event study strengthens the inference about the telegraph's causal effect by demonstrating the change in the structure of information flows.
DATA
In order to investigate the decrease in the information lag, this study considers a single security listed on both the New York and London stock exchanges. This study examines the $100 common shares of the New York and Erie Railroad. Erie was one of the few dual-listed securities that had a consistent series of observations on both sides of the Atlantic before and after the introduction of the Atlantic Cable. According to an 1865 estimate, 60 percent of Erie common shares were in foreign, primarily English, hands.5
New York Times, 28 October 1865.

FIGURE 1 ERIE COMON SHARE PRICE DIFFERENCE, 1864–1868: CONVERTED NEW YORK PRICE MINUS LONDON PRICE
TEST
We detect information travel time with two different methods, an event study and time series analysis. The basic intuition of the event study is to watch price innovations originate on one market and register on another market. The event study methodology of this article differs slightly from traditional event studies. First, events are usually defined by some discrete change in the pricing environment of the security, such as a dividend announcement or a stock split. Instead, we define events endogenously by using large changes in the stock price in one market. We then determine how long it took these large price changes to translate across to another market. Second, event studies typically employ a cross-section of securities. Because we have only one dual-listed security, the “cross-section” of securities consists of price innovations on the same security taking place at different times. The time-series methods employ single-equation methods to regress one market price on the other market's lagged prices, carefully incorporating cointegrating relations. Both methods lead to a similar conclusion.
Focus on the event study to detect a change in the structure of information. The event study measures how long a price differential persists between the two markets as a result of a large price change in New York. Suppose the converted price of Erie in New York reacts to new information. The change in the converted price might occur through alterations in the gold price, the exchange rate, or the stock price. Before the telegraph, the London market's ignorance of the new information will create a price differential between New York and London. The price differential should persist for the time it takes for new information to travel across the Atlantic. After the introduction of the cable, the price differential created by a converted price change in New York should disappear within a few days at the latest.
Let v be the travel time across the Atlantic Ocean for information-bearing vessels. Information flows between the two markets were distributed stochastically over lags of several different lengths. Before the telegraphic connection, information transfer was limited to vessels that carried mail over the Atlantic. The speed of the information transmission depended on the speed of the steamship, which could vary due to the vessel's design or the weather. Further, vessels carrying new information neither left nor arrived every day. Vessel travel time v is probably between nine and 14 days, approximate travel time for transatlantic steamships.
Let c be the time it takes to transmit information by cable. Although time was not standardized, there was only approximately a one-hour overlap when both the London and New York markets were open together. So, we expect c to be between zero to two days. It seems unlikely that c would be larger than one, although Sundays, holidays, and cable outages could delay the receipt of news. After the connection, information ought to be transmitted across the Atlantic with a lag of c days as opposed to a lag of v days.
Consider a formalization of the event study. Define an event day as a change greater than 2.35 percent of par in the converted price of Erie. The threshold 2.35 was chosen to yield approximately 50 events. Number each event day i before the telegraph from 1 to N and each event day j after the telegraph from 1 to M. Each event is a 19-day sequence of price differentials beginning on the event day and ending 18 days after an event day. Number each day in event time t from 0 to 18 relative to the event day at time t = 0. Denote the New York price converted by the foreign exchange conversion described in the Appendix by pitNY. Denote the London price of event i at time t by pitL. Now construct the series of price differentials. Instead of measuring price differences with the absolute value, we standardize the price difference by the price differential before the event. Denote the standardized absolute price difference between the converted price in New York and the London price during event i at event time t before the telegraph by

and the standardized absolute price difference on event j at event time t after the telegraph by

There are now N slices of price differentials of length 19 from before the introduction of the telegraph and M slices of price differentials of length 19 from afterward.
Event studies standardize the returns during an event period by the mean of the returns from a pre-estimation period. Stephen Brown and Jerold Warner note that deviations from a zero mean will inflate the test statistics.
6Brown and Warner, “Daily Stock Returns.”

(respectively

) be the mean of the standardized absolute price differentials before (respectively after) the telegraph at event time t that did not fall into an event period. Let

and

be the mean-adjusted standardized same day price differentials for the periods before and after the introduction of the telegraph, respectively. Event studies typically estimate the means
and
from a pre-estimation period. Instead of using a pre-estimation period, we estimate these two quantities with the population means of the entire pre- and post-telegraph samples.
Consider the distribution of the standardized price differentials. Suppose that before the Atlantic cable

and after the introduction of the telegraph

where μt and νt are the cross-section population means while σt2 and τt2 are the population variances. Hence, for both regimes and for a given event time t, both the mean-adjusted standardized price differentials and their respective variances are constant across events.
Form cross-sectional averages for each t. Recall that the “cross section” is derived from different slices of a single time series. Fix a time lag t after an event and define the cross-sectional averages over the events by

where Nt and Mt are the number of observations of xit and yjt respectively. The number of points Nt or Mt in the cross-sectional average can vary due to the number of prices that did not exist when one market or the other was closed. For large enough samples, the central limit theorem yields

if xit and yjt are independent for a fixed t. Observe that values of xit and yjt may be independent across i and j if events are spaced sufficiently far apart in time even if the daily time series is correlated.
Now derive a test statistic for each event time t. For each t, let the null hypothesis be that the standardized mean price differential is the same before and after the telegraph: Ho: μt = νt. Base a test statistic on

Under the null hypothesis, zt is asymptotically normally distributed. In practice, statisticians employ a t distribution as a rough approximation. Following a suggestion of Brown and Warner, we estimate σt2 and τt2 with the sample distribution of xit and yjt.
7Brown and Warner, “Daily Stock Returns.”
The event study uses the t statistics to check whether or not the informational structure changed. For event times t < c we should observe no difference between the mean deviation before the cable and the mean deviation after the cable. No information has been transmitted yet. For event times t ε [c,v) in the post-telegraph period London could have received price information about the event by telegraph, whereas for event times t ε [c,v) in the pre-telegraph period price information has not yet arrived. Thus, for t ε [c,v) a price differential will exist in the pre-telegraph London market while a price differential will not exist in the post-telegraph London market. This price differential will persist until news arrives by ship in London (until t ≥ v). Hence, under the hypothesis that the telegraph caused the entire price difference, for each event time t ε [c,v) the difference between the mean absolute price difference before the cable and the mean absolute price difference after the cable should be statistically significant.
The test can also be run in the reverse direction. We can use the same test to determine whether or not the London market transmitted news to New York. The test statistics of the event study remain the same, and only the definition of the event changes. Unfortunately, daily historical dollar-sterling exchange rates are not available in London. The lack of data limits the event study to defining an event in London as a large change in the actual London price of the security. This method omits information revealed by the adjustment of the foreign exchange rate. The omission decreases the power of the test, as it is less likely to identify news in London that could affect the price in New York.
RESULTS
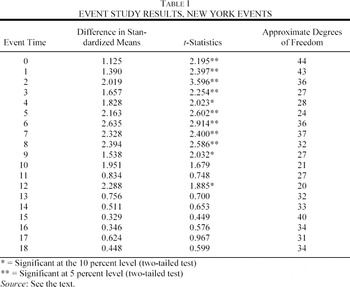
Table 1 displays the results of the event study. Table 1 contains a list of approximate t statistics for the variable zt, one for each time t after an event. The t statistics examine the difference between the mean-adjusted absolute deviations before and after the telegraph for a given length lag t after an event. Each t statistic has approximately between 20 and 44 degrees of freedom.
The event study detects the London market reacting to price changes in the New York market. Table 1 presents evidence that vessel travel time, v, was at least nine days and perhaps ten. Table 1 shows positively significant differences at the 5 percent level (two-tailed test) for many event times t = 0 through 9, although t = 4, 9, and 12 are marginally significant. Because we observe significant zt statistics for about eight or nine days, this result supports the hypothesis that the telegraph shortened the information lag by about nine or ten days. Because zt for event time zero was significant, cable transmission time, c, seems to be only zero days. Because the prices are roughly simultaneous, price information must travel while both markets are open. According to the time series analysis, vessel travel time was between ten to 13 days, whereas cable transmission time was between zero to two days.

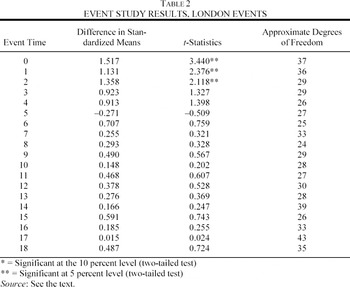
In the reverse direction, there does not seem to be an effect of London price changes on the New York market. Table 2 confirms previous research that information generally flows from the home market to the foreign market, but not the other way around. We cannot detect information traveling from London to New York by this method. The only significant t statistics are t = 0, 1, and 2. For more information about the results, robustness checks, or the time series tests, see the working paper version.

Steamship crossing times generally confirm the analysis. The New York Herald catalogues the transatlantic passage of several major steamship lines for the year 1864.8
New York Herald, 15 January 1865.
CONCLUSION
This article studies the change in capital market information flows between New York and London due to the introduction of the Atlantic Cable. The evidence from an event study suggests that the information lag shortened from ten days to zero days. London prices quickly incorporated newly available price information from New York. Nineteenth-century capital markets functioned so precisely that we can recover the change in information travel time from security prices.
Appendix: The Data Set
This Appendix describes the data set. The data consist of daily prices from the New York Times and the London Times for the period of August 1864 to July 1868 for the $100 common shares of the New York and Erie Railroad. Both papers quote prices in terms of percentages of par in the local currency.
Comparing prices in New York and London requires a currency conversion. First, we convert U.S. paper dollars (“greenbacks”) to U.S. gold dollars using the average of the daily high and low from W. C. Mitchell's work.9
Mitchell, Gold.
Schmidt, Foreign Banking Arbitration.
For example, on 1 August 1864 Erie shares traded in the U.S. for 111.875 greenback dollars. Suppose that $2.55 in greenbacks trade for one gold dollar, the spot exchange rate in New York on bills of exchange on London was 110.8146 (relative to a par exchange rate of 109.5), the par exchange rate is 4.86656 dollars per pound, and London quotes American securities at a customary par of 4.44444 gold dollars per pound. Then the London price that would be equivalent to the New York price is 39.591 = (111.875/2.55 * (109.5/110.8146)*(4.44444/4.86656)) = (111.875 * 100/(2.55 * 110.8146)). The quoted price in London was 39. Two factors complicate the analysis. First, actual quotes for 60-day bills of exchange must be discounted to obtain a spot exchange rate. Second, London trades were forward trades for up to two weeks, requiring adjustment to the quoted London price to obtain a spot stock price. For more information about the conversion procedure, see the working paper.
This article is an abbreviated version of chapter 1 of my dissertation written in the Division of Humanities and Social Sciences at the California Institute of Technology. Thanks to my advisor, Lance Davis, and to R. Michael Alvarez, Peter Bossaerts, Caroline Fohlin, David Grether, Phillip Hoffman, Ivana Komunjer, Robert Sherman, and two anonymous referees for their comments and ideas.