I. INTRODUCTION
Micro-computed tomography (microCT) has become a standard tool in biomaterial characterization. It allows for assessment of pore morphology Reference Ho and Hutmacher1,Reference Renghini, Komlev, Fiori, Verné, Baino and Vitale-Brovarone2 and for quantifying the newly formed bone tissue in tissue engineering scaffolds. Reference Gauthier, Müller, von Stechow, Lamy, Weiss, Bouler, Aguado and Daculsi3–Reference Jones, Arns, Sheppard, Hutmacher, Milthorpe and Knackstedt5 The correspondingly identified topology has been used to feed various types of numerical analyses being related to elastic properties, Reference Jaecques, Van Oosterwyck, Muraru, Van Cleynenbreugel, De Smet, Wevers, Naert and Vander Sloten6,Reference Scheiner, Sinibaldi, Pichler, Komlev, Renghini, Vitale-Brovarone, Rustichelli and Hellmich7 to permeability, Reference Truscello, Kerckhofs, Van Bael, Pyka, Schrooten and Van Oosterwyck8,Reference Dias, Fernandes, Guedes and Hollister9 or to mechanobiology. Reference Sandino, Checa, Prendergast and Lacroix10,Reference Sandino and Lacroix11
All these approaches are based on some kind of statistical evaluation of the gray values standardly defining the three-dimensional CT “images”, while the deeper physical meaning of these gray values remains somewhat unconsidered. Actually, these voxel-specific gray values, being defined on 8-bit or 16-bit scales, are proportional to the x-ray attenuation coefficient of the material found within the respective voxel. The x-ray attenuation coefficient, in turn, measures the relative decrease of x-ray beam intensity per length of pervaded matter, and it is a function of the chemical composition of that matter – the latter being of obvious interest for the material scientist, biomedical engineer, or clinician; and it is the key issue to be tackled in the present paper.
However, the proportionality constants defining the aforementioned relation between gray values and attenuation coefficients are standardly neither documented nor disclosed with the available commercial equipment, and in addition, the x-ray attenuation coefficients are not material properties in a strict sense, but depend on x-ray energy used. In the sequel, we will present a novel method for retrieving both the proportionality constants and the used x-ray energy, from statistical analyses performed on the gray values imaging ceramic biomaterials, in combination with fundamental x-ray physics, comprising chemistry-attenuation relations published by NIST Reference Hubbel and Seltzer12–Reference Hubbel14 on the one hand, and the volume average rule for x-ray attenuation coefficients Reference Crawley, Evans and Owen15,Reference Hellmich, Kober and Erdmann16 on the other hand. Thereby, the key ingredient of the analysis will be the unique existence of one x-ray energy (or of the peak of one x-ray energy spectrum) used for the 3D CT image under consideration. From an applied perspective, the method will provide an answer to the following question: Does cell culturing of ceramic biomaterials in physiological fluid not only affect the several-hundreds-of-micrometer-to-a-few-millimeter-sized pores provided for tissue ingrowth, but also alter the microstructure of the solid phase of the ceramic scaffold, i.e., does culturing also increase the microporosity found in each and every solid scaffold voxel? Finally, the paper will be concluded by a broader perspective concerning future application of the presented method, together with an overview on how it relates to the former “landmark” contributions in the field – all paving the way to a more mature, computer-aided biomedicine in general, and biomaterial design in particular.
II. MATERIALS AND METHODS
A. Test protocol
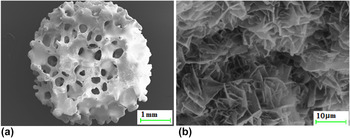
As typical ceramic biomaterials for bone tissue engineering, we consider six 3D beta-tricalcium phosphate (β-TCP) scaffolds (Becton, Dickinson and Company, La Jolla, CA), with an average pore size of 200–400 µm. The samples, installed in plastic falcon tubes together with a phantom of aluminum, were scanned by means of a Phoenix Nanotom S (General Electric Measurement and Control, x-ray microCT system) at Innovation Center Iceland, Reykjavík, Iceland, at a source current of 160 µA, a source voltage of 90 kV, and a sampling distance of 7.33 µm. The β-TCP scaffolds underwent the following protocol: First, they were scanned as produced, i.e., with empty pores. Then, they were seeded with the pre-osteoblastic cell line MC3T3-E1 (clone 4; ATCC, Wesel, Germany) and cultured in an alpha-minimum medium (α-MEM) containing 10% fetal bovine serum (FBS; Lifetechnologies, Boston, MA) mixed with ascorbic acid and β-glycerophosphate (glycerol 2-phospate disodium salt hydrate; Sigma–Aldrich Chemie GmbH, Taufkirchen, Germany) at 37 °C, 5% CO2 and 95% relative humidity (RH), for 3, 6, and 8 weeks, respectively. The cell-containing scaffolds were then washed in phosphate-buffered saline (PBS), fixed with paraformaldehyde (4% v/v), subjected to a dehydration gradient with an increasing concentration of ethanol (so as to dehydrate the sample, and to avoid the occurrence of cracks during the subsequent scanning electron microscopy investigation), and finally kept in 96% ethanol until further treatment (ethanol was preferred to formalin fixing, because of its lower toxicity). The aforementioned treatment consisted of re-installing them into plastic falcons (test tubes of Becton, Dickinson, and Company, La Jolla, CA), this time filled with ethanol as well, to scan the scaffolds once again. Eventually, they were dried in a CO2 Critical Point Dryer (Bio-Rad Polaron Division, Watford, England) before being coated by a conductive layer of sputtered gold for further investigation by means of scanning electron microscopy (SEM; LEO Supra 25, Zeiss, Oberkochen, Germany). Respective micrographs were taken at an accelerating voltage of 10 kV, at different magnifications. Anticipating, for the sake of more clearly developing the remaining method sections, two such micrographs in Fig. 1, we observe that the investigated scaffolds exhibit a double porous nature: “large”, several-hundreds-of-micrometer-to-a-few-millimeter-sized “macropores” can be clearly distinguished from submicrometer-sized “micropores”. Micro computed tomography will allow for detailed resolution of the “macropores”, while the micropores will govern the “density” of the individual microCT voxels.
Double porous structure of investigated ceramic biomaterial, as revealed by means of scanning electron microscopy: (a) “macropores” of several hundreds of micrometers size, and (b) “micropores” at the submicrometer scale.

B. MicroCT evaluation procedure I: Conversion of CT gray values to energy-dependent attenuation coefficients, based on air and aluminum characteristics
Radon transform-based reconstruction Reference Radon17,Reference Hounsfield18 of x-ray projection images recorded by the microCT scanner delivers a 3D image consisting of cubes called voxels, which are characterized by 8-bit gray values being related to the x-ray attenuation coefficients. The latter relation is a linear one, with coefficients a and b depending on the photon energy ε used in the scanner, 19
 $$\mu (\varepsilon ) = a(\varepsilon ) \times GV + b(\varepsilon )\quad .$$
Coefficients a and b are standardly not disclosed by conventional CT equipment, and we will retrieve them from a statistical image analysis in combination with knowledge on the chemical nature of the scanned materials. Therefore, probability density plots of all the gray values found in each of the investigated 3D images are used to identify several landmark values in each of these histograms:
-
(i) The leftmost peak of each histogram indicates the most frequent gray value in the image domain illustrating the air which surrounds the depicted scaffold; this gray value is denoted as GV air.
-
(ii) The peak on the right side of each histogram indicates the most frequent gray value of all the voxels containing solid scaffold material, this gray value is denoted as
 $GV_{{\rm{scaff}}}^{{\rm{peak}}}$
.
-
(iii) As a third landmark, the gray value of the aluminum phantom scanned simultaneously with the ceramic scaffold is identified. Since it cannot be determined as a peak on any of the histograms concerning the overall images, the image domains illustrating the phantom material were cropped, and the most frequent gray value occurring in each of these subdomains, denoted as GV Al, was identified.

The x-ray attenuation coefficients of the materials related to the landmark points can be retrieved from the NIST-database of mass attenuation coefficients µ/ρ,
Reference Hubbel and Seltzer12
based on the mass densities of air, ρair = 0.0012 g/cm3, of pure β-TCP, ρβ-TCP = 3.07 g/cm3, of ethanol,
 ${\rm{\rho }}_{{\rm{C}}_2 {\rm{H}}_6 {\rm{O}}}$
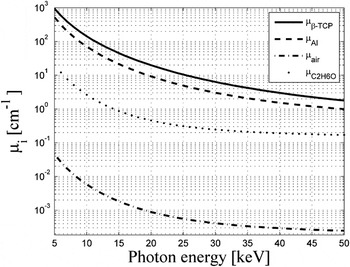
= 0.789 g/cm3, and of aluminum, ρAl = 2.699 g/cm3, see Fig. 2 for their dependence on the x-ray energy ε.
X-ray attenuation coefficients of pure β-TCP, of aluminum, of ethanol, and of air, as functions of the photon energy ε.

Specification of Eq. (1) for the attenuation coefficients and the gray values of air and of aluminum, µair and µAl, as well as GV air and GV Al, respectively, yields a linear system of equations for the energy-dependent coefficients a and b,
 $$\left\{ {\matrix{ {\mu _{{\rm{air}}}^{{\rm{NIST}}} (\varepsilon ) = a\left( \varepsilon \right) \times GV_{{\rm{air}}} + b(\varepsilon )} \cr {\mu _{{\rm{Al}}}^{{\rm{NIST}}} (\varepsilon ) = a\left( \varepsilon \right) \times GV_{{\rm{Al}}} + b(\varepsilon )} \cr } } \right.\quad {\rm{,}}$$
with the solution,
 $$\left\{ {\matrix{ {a\left( \varepsilon \right) = {{\left[ {\mu _{{\rm{air}}}^{{\rm{NIST}}} \left( \varepsilon \right) - \mu _{{\rm{Al}}}^{{\rm{NIST}}} \left( \varepsilon \right)} \right]} \mathord{\left/ {\vphantom {{\left[ {\mu _{{\rm{air}}}^{{\rm{NIST}}} \left( \varepsilon \right) - \mu _{{\rm{Al}}}^{{\rm{NIST}}} \left( \varepsilon \right)} \right]} {\left[ {GV_{{\rm{air}}} - GV_{{\rm{Al}}} } \right]}}} \right. \kern-\nulldelimiterspace} {\left[ {GV_{{\rm{air}}} - GV_{{\rm{Al}}} } \right]}}} \cr {b\left( \varepsilon \right) = {{\left[ {\left( \mu \right._{{\rm{air}}}^{{\rm{NIST}}} \left( \varepsilon \right) \times GV_{{\rm{Al}}} - \mu _{{\rm{Al}}}^{{\rm{NIST}}} \left( \varepsilon \right) \times GV_{{\rm{air}}} } \right]} \mathord{\left/ {\vphantom {{\left[ {\left( \mu \right._{{\rm{air}}}^{{\rm{NIST}}} \left( \varepsilon \right) \times GV_{{\rm{Al}}} - \mu _{{\rm{Al}}}^{{\rm{NIST}}} \left( \varepsilon \right) \times GV_{{\rm{air}}} } \right]} {\left[ {GV_{{\rm{Al}}} - GV_{{\rm{air}}} } \right]}}} \right. \kern-\nulldelimiterspace} {\left[ {GV_{{\rm{Al}}} - GV_{{\rm{air}}} } \right]}}} \cr } } \right.\quad .$$
Coefficients a(ε) and b(ε) allow for energy-dependent conversion of gray values to x-ray attenuation coefficients according to Eq. (1).
C. MicroCT evaluation procedure II: Identification of used photon energy and of intravoxel microporosity, based on attenuation average rule applied to microporous ceramic
To identify the actual values for the coefficients a and b, we explicitly consider that relation (1) needs to be unique, i.e., per used photon energy ε only one pair of coefficients a and b exists. Accordingly, value-specific, rather than function-specific, identification of a and b is based on deriving and then setting equal, of two independent expressions for the photon energy-dependent x-ray attenuation coefficient of the most frequently occurring gray value in the scaffold domain. The first expression relates to the average rule for x-ray attenuation coefficients, Reference Crawley, Evans and Owen15,Reference Hellmich, Kober and Erdmann16 which when applied to the matter found within a scaffold voxel, reads as
 $$\mu _{{\rm{scaff}}}^{{\rm{up}}} = \mu _{\beta {\rm{ - TCP}}} \left( {1 - \phi } \right) + \mu _{{\rm{air}}} \phi \quad {\rm{,}}$$
in the case of untreated (empty) scaffolds, and
 $$\mu _{{\rm{scaff}}}^{{\rm{up}}} = \mu _{\beta {\rm{ - TCP}}} \left( {1 - \phi } \right) + \mu _{{\rm{C}}_2 {\rm{H}}_6 {\rm{O}}} \phi \quad {\rm{,}}$$
in the case of cultured scaffolds, with φ as the voxel-specific microporosity found within one voxel, and
 $\mu _{{\rm{C}}_2 {\rm{H}}_6 {\rm{O}}}$
as the attenuation coefficient of ethanol. Superscript “up” indicates that Eqs. (4) and (5) allow for upscaling of physical quantities (here attenuation coefficients) from the sub- or intravoxel level, up to the level of the entire voxel.
The second expression for the most frequently encountered attenuation value found in the scaffold image domain results from the respective specification of Eq. (1),
 $$\mu _{{\rm{scaff}}}^{{\rm{up}}} = a(\varepsilon ) \times GV_{{\rm{scaff}}}^{{\rm{peak}}} + b(\varepsilon )\quad {\rm{.}}$$
Setting Eq. (6) equal to specifications of (4) and (5) for the most frequently encountered microporosity value, denoted as ɸpeak, yields an equation in the format,
 $$a\left( \varepsilon \right) \times GV_{{\rm{scaff}}}^{{\rm{peak}}} + b(\varepsilon ) = \mu _{\beta {\rm{ - TCP}}} \times \left( {1 - \phi ^{{\rm{peak}}} } \right) + \mu _i \times \phi ^{{\rm{peak}}} \quad {\rm{,}}$$
with i = air for the untreated (empty) scaffolds, and i = C2H6O otherwise. Equation (7) establishes a nonbijective function between ɸpeak and ε: it assigns none, or one, or two values of ε to a specifically chosen value for ɸpeak.
However, only one photon energy was used in any of the considered images, so that only the one unique solution which is related to only one value for the photon energy, remains physically admissible. This gives access to both the photon energy ε used for the considered image, and to the most frequently encountered microporosity value, ɸpeak. Once knowing the unique value for the photon energy ε, all gray values encountered in the images can be converted into attenuation coefficients µ, by means of Eq. (1) with now known functions a(ε) and b(ε). Use of these attenuation coefficients in average rules (4) and (5) finally yields voxel-specific microporosities according to
 $$\phi = {{\left( {\mu - \mu _{\beta {\rm{ - TCP}}} } \right)} \mathord{\left/ {\vphantom {{\left( {\mu - \mu _{\beta {\rm{ - TCP}}} } \right)} {\left( {\mu _i - \mu _{\beta {\rm{ - TCP}}} } \right)}}} \right. \kern-\nulldelimiterspace} {\left( {\mu _i - \mu _{\beta {\rm{ - TCP}}} } \right)}}\quad {\rm{,}}$$
with i = air for the untreated (empty) scaffolds, and i = C2H6O otherwise.
D. MicroCT evaluation III: Micromechanics-based microporosity-to-elastic conversion
Porosity is well known to strongly govern the mechanical properties of a material. Reference Cobel and Kingley20 Our present focus is on the microporous β-TCP polycrystal found in each and every voxel of the 3D micro computer tomographs of the investigated bioceramic scaffolds. As identified in Fig. 1(b), the β-TCP crystals are of disk-type shape. A recent micromechanics study, Reference Fritsch, Hellmich and Young21 based on self-consistent estimates for infinitely many, spatially oriented crystal phases Reference Fritsch, Dormieux and Hellmich22–Reference Fritsch, Hellmich and Dormieux25 and validated on a variety of ceramic material systems Reference Ali and Singh26–Reference Pabst, Gregorová and Tichá35 has revealed the Young's modulus E of such disk-composed porous polycrystals to closely follow a power law relation with the (micro)porosity as argument,
 $${E \mathord{\left/ {\vphantom {E {E_{\rm{s}} }}} \right. \kern-\nulldelimiterspace} {E_{\rm{s}} }} = B_{\rm{E}} (1 - \phi )^{C_{\rm{E}} } \quad {\rm{,}}$$
with E s as the Young's modulus of a pure β-TCP crystal (which was quantified through molecular dynamics analysis as E s = 110 GPa Reference Liang, Rulis and Ching36 ), and the power function constants B E and C E amounting to 0.9867 and 2.053, respectively. Reference Fritsch, Hellmich and Young21 Full elastic characterization of the isotropic polycrystal found in each and every voxel also requires knowledge of Poisson's ratio ν, which can again be predicted from the aforementioned self-consistent micromechanics approaches (realized with empty pores), and closely approximated by a fourth-order polynomial,
 $$\nu \left( {\nu _{\rm{s}} } \right) \approx \bar A_\nu \times \left( {1 - \phi } \right)^4 + \bar B_\nu \times \left( {1 - \phi } \right)^3 + \,\bar C_\nu \times \left( {1 - \phi } \right)^2 + \bar D_\nu \times \left( {1 - \phi } \right) + \bar E_\nu \quad {\rm{,}}$$
where the coefficients
 $\bar A_\nu$
,
 $\bar B_\nu$
,
 $\bar C_\nu$
,
 $\bar D_\nu$
, and
 $\bar E_\nu$
of fourth-order polynomial approximation of νhom depend linearly on νs,
 $$q = a^ * \times \nu _{\rm{s}} + b^ * \quad {\rm{,}}$$
see Table I for corresponding numbers, and the pure crystals' Poisson's ratio, νs = 0.276, is again known from molecular dynamics. Reference Liang, Rulis and Ching36 Equations (9)–(11) allow for conversion of the voxel-specific microporosities as derived from Eq. (8), into voxel-specific elastic properties.


E. MicroCT evaluation IV: Macroporosity quantification
The voxels characterized by 8-bit gray scale are imported into the medical imaging segmentation software MIMICS (Materialise, Leuven, Belgium) for analysis of the macroporosity quantification, or more precisely, of the change of the volume of the (microporous) scaffold material due to treatment. Therefore, for each micro computed tomograph, a segmentation process based on the respective gray value histogram is performed: The minimum probability value left of the scaffold peak value
 $GV_{{\rm{scaff}}}^{{\rm{peak}}}$
is identified as threshold value GV
thr, and all voxels with gray values larger than this threshold are considered as “scaffold material voxels”. Then, a 3D model is created of the segmented area, for each scaffold, both before and after cultivation. Finally, the volumes of all the 3D models were computed, and values referring to time points before and after cultivation were compared.
III. RESULTS
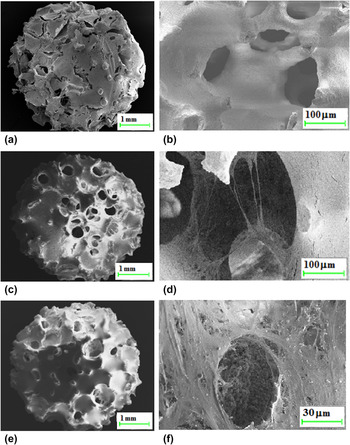
Low magnification scanning electron micrographs (see Fig. 3) clearly show covering of the scaffolds’ surfaces with pre-osteoblastic cells, once the latter were seeded on the former.
Cell proliferation on ceramic scaffolds as revealed by SEM, at low magnification showing entire scaffolds with approximately 5 mm diameter (a, c, e), and at high magnification zooming into one of the “macropore” cavities (b, d, f): comparison of cell covers after 3 weeks of cultivation (a, b), with the situations after 6 weeks (c, d), and after 8 weeks (e, f).

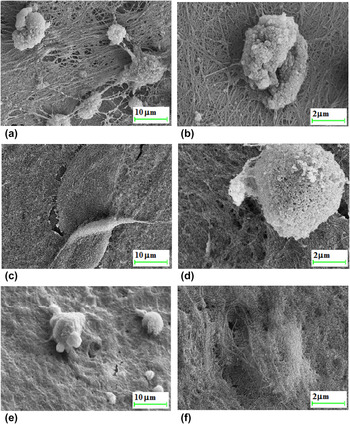
During ongoing cultivation, the cellular cover tends to grow denser, as is seen in the higher magnification SEM images of Fig. 4: initially loose fibrous networks of cell processes [as seen after 3 weeks of cultivation, see Figs. 4(a) and 4(b)], finally turn into more compact extracellular matrix after 8 weeks [as can be seen in Figs. 4(c) and 4(d)], which finally even tends to cover the originally protruding cell nodules [see Figs. 4(e) and 4(f)].
SEM-based close up of immediate vicinity of a cell nodule: after 3 weeks (a, b), after 6 weeks (c, d), and after 8 weeks (e, f).

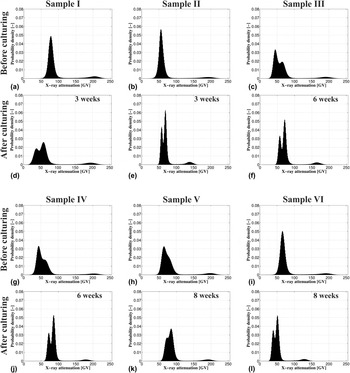
Further insight into the effects of the cultivation process results from studying the micro computed tomographs: histograms of all CT images of the six investigated scaffolds, in untreated and cultured conditions, respectively, show a large number of gray values referring to low-density voxels (typically with GV < 100), and a smaller number of denser voxels referring to the ceramic scaffold material, see Fig. 5.
Probability density functions of attenuation-related gray values of six CT-imaged β-TCP scaffolds. Samples I–III (a–f): (a–c) before cell culturing, (d, e) after 3 weeks of culturing, (f) after 6 weeks of culturing. Samples IV–VI (g–l): (g–i) before cell culturing, (j) after 6 weeks of culturing, (k, l) after 8 weeks of culturing.

Before treatment in pseudo-physiological conditions, the low-density voxels show one (or one dominant) peak, which is related to the attenuation of air alone, GV air, while sometimes the plastic falcon-induced attenuation effects are explicitly visible as well, as can be seen in Figs. 6(c), 6(g)-6(h). After cultivation and scanning in ethanol, the situation changes insofar, as a large number of ethanol-filled voxels emerge, which always leads to two clearly distinguishable peaks in the low-density gray value range of the respective histograms, see Figs. 5(d)–5(f), 5(j)–5(l).
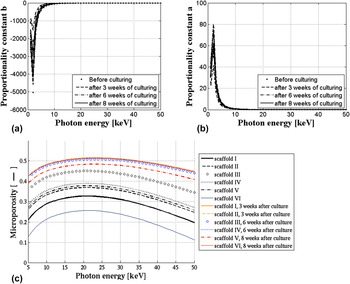
(a, b) Proportionality constants relating gray values to attenuation coefficients, as functions of the photon energy ε; (c) scaffold-specific ɸpeak–ε relations, used for identification of scanner-specifically used photon energy and actual value of most frequently occurring microporosity.

Thereby, the left of these peaks refers to air, and the respective right one represents ethanol-filled voxels inside the plastic falcon tube.
The most frequent gray values found, respectively, in the image domains showing air, GV
air, scaffold material,
 $GV_{{\rm{scaff}}}^{{\rm{peak}}}$
, and aluminum, GV
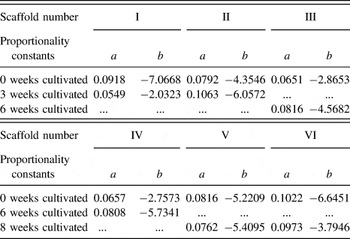
Al, are varying between all investigated scaffolds, be they treated or untreated, see Table II.
Landmark gray values of scaffolds before and after cultivation.

Interestingly, there does not emerge any additional peak which would be related to a material with densities somewhere between those of ethanol (or soft tissue) and of ceramic: this clearly shows that the cellular cover on the macropore and the outer surfaces of the scaffolds did not mineralize.
When continuing with the image evaluation steps as described in Sec. II. B, we find that the proportionality constants a and b relating gray values to attenuation coefficients as given in Eq. (1) emerge as decreasing functions of the photon energy, as depicted in Figs. 6(a) and 6(b), plotted based on Eq. (3) fed by the data shown in Table II.
Use of these functions in the identity of upscaled and gray value-determined attenuation coefficients, as given through Eq. (7), yields ε–ɸpeak relations as depicted in Fig. 6(c).
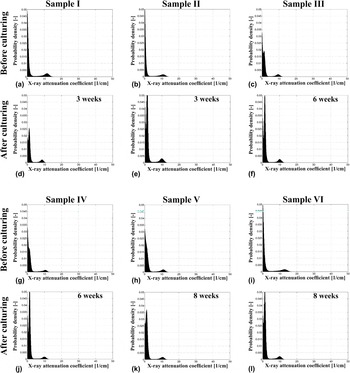
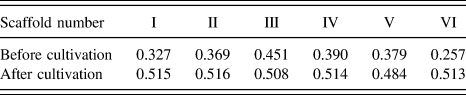
They are used to identify, for each microCT image, the only value of ε which is uniquely related to just one value of ɸpeak: ε = 21 keV – this is the (average) photon energy used for all the images. It gives access to scan-specific proportionality constants a and b as documented in Table III, and corresponding CT-scan-specific probability density functions of attenuation coefficients are illustrated in Fig. 7. They show “peak” microporosities, which are again scan-specific, and increase through scaffold treatment, see Table IV.
Proportionality constants a and b of Eq. (1) relating gray values to attenuation coefficients for all scaffolds, based on the photon energyidentified as ε = 21 keV.

Probability density function of attenuation coefficients of six CT-imaged β-TCP scaffolds. Samples I–III (a–f): (a–c) before cell culturing, (d, e) after 3 weeks of culturing, (f) after 6 weeks of culturing. Samples IV–VI (g–l): (g–i) before cell culturing, (j) after 6 weeks of culturing, (k, l) after 8 weeks of culturing.

Most frequently occurring, i.e., “peak”, microporosities in each scaffold, before and after cultivation.

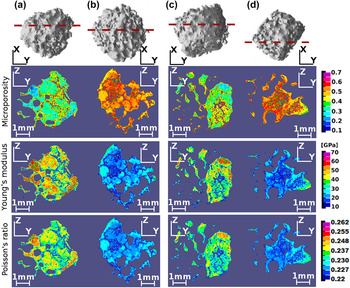
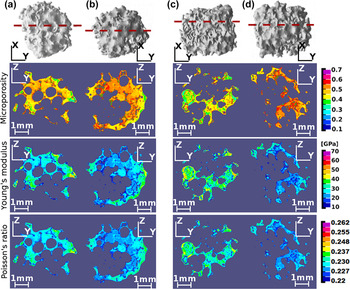
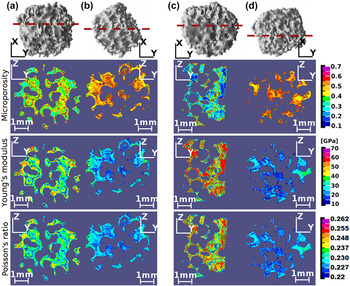
This increase can be studied for all the voxels of all the investigated scaffolds, as depicted in the microporosity maps of Figs. 8–10:
Spatial distributions of voxel-specific microporosity and elastic properties, i.e., Young's modulus and Poisson's ratio, over chosen cross sections through: sample I before culturing (a), sample I after 3 weeks of culturing (b), sample II before culturing (c), sample II after 3 weeks of culturing (d).

Spatial distributions of voxel-specific microporosity and elastic properties, i.e., Young's modulus and Poisson's ratio, over chosen cross sections through: sample III before culturing (a), sample III after 6 weeks of culturing (b), sample VI before culturing (c), sample VI after 6 weeks of culturing (d).

Spatial distributions of voxel-specific microporosity and elastic properties, i.e., Young's modulus and Poisson's ratio, over chosen cross sections through: sample V before culturing (a), sample V after 8 weeks of culturing (b), sample VI before culturing (c), sample VI after 8 weeks of culturing (d).

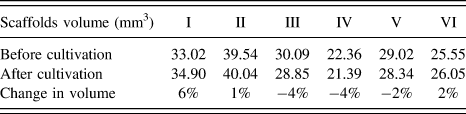
Due to the highly overlinear effect of the microporosity on the Young's modulus as quantified through Eq. (9), the microporosity increase turns out as quite detrimental for the scaffolds' local stiffnesses (see Figs. 8–10), while the voxel-specific Poisson's ratio is also decreasing, i.e., tending toward 0.2 (see Figs. 8–10). At the same time, the macroporosities remain fairly constant, as the results of the volume analysis in Table V show (for corresponding threshold values GV thr used for segmentation, we refer to Table II).
Change in volume (mm3) of the 3D scaffold's body, due to cultivation.

IV. DISCUSSION, REVIEW, AND PERSPECTIVES
Due to its nondestructive character and its ability to “look deeply” into actually “nontransparent solid microstructures”, micro computed tomography has become a key tool for the morphological study of biomaterials and tissue engineering scaffolds during the last decade. In the context of calcium phosphate or hydroxyapatite biomaterials, microCT studies allowed for quantification, in time and space, of newly formed bone tissue within in vivo implanted ceramic biomaterials. Reference Mastrogiacomo, Komlev, Hausard, Peyrin, Turquier, Casari, Cedola, Rustichelli and Cancedda37–Reference Giuliani, Manescu, Langer, Rustichelli, Desiderio, Paino, De Rosa, Laino, d'Aquino, Tirino and Papaccio45 Such analyses are based on segmentation of the gray value-characterized voxels of the micro computer tomographs into different subdomains which are defined to lie between certain reasonably chosen threshold values. In the context of bone tissue engineering, the aforementioned subdomains then related to bone tissue, ceramic material, or pore fluid, respectively. In this sense, the voxels within any of these subdomains are not further distinguished, or in other words, the subdomains are considered as “homogeneous”. However, quite naturally, there has been the wish to retrieve, from computed tomographs, some more detailed, i.e., inhomogeneous, voxel-specific material properties. This aim has been followed perhaps the most pronouncedly, in the domain of bone imaging: By means of extended regression analyses, relations between x-ray attenuation and mass density of the matter found in respective voxels, on the one hand, and between mass density and Young's modulus, on the other, attenuation-density-elasticity relations have been frequently proposed and reported. Reference Rho, Hobatho and Ashman46–Reference Cong, Buijs and Dragomir-Daescu49 However, most of the relationships proposed are not very much in line with each other – and the debate on the “proper choice” of regression parameters seems somewhat interminable, as a direct consequence of the rather vague physical foundation for the choice of attenuation-density-elasticity relations to be sought for.
This situation has provoked the emergence of an alternative view on the issue of proper evaluation of gray values stemming from CT images, with the present contribution marking an important “landmark”. In more detail, the steps toward this present landmark have been the following: Instead of directly assuming unique attenuation-to-density relations, the first important step was to remember how, from the basic x-ray physics perspective, attenuation coefficient would be related to mass densities. In fact, it is well known that the attenuation coefficient related to a piece of material is equal to the sum of the material constituents' mass attenuation coefficients times their apparent mass densities (i.e., the constituents' masses over the overall volume of the considered piece of material). Reference Crawley, Evans and Owen15 This relation could be directly transformed into a volume average rule for attenuation coefficients, Reference Hellmich, Kober and Erdmann16 which opened the way to a physics-based intervoxel analysis: Given a millimeter-sized voxel of a piece of cortical or trabecular bone and provided the attenuation coefficients of bone matrix and of vascular are known, voxel-specific attenuation coefficients can be converted in to voxel-specific vascular porosities. Reference Hellmich, Kober and Erdmann16 In the latter reference, attenuation coefficients were given in terms of Hounsfield numbers (which are attenuation coefficients related to that of water), so that the success of the method depended solely on a reasonably good estimate for the organ-specific, but space- and time-invariant Hounsfield number for the solid bone matrix (in the particularly considered case of a human mandible). Once the spatial porosity distribution throughout the organ was known, it could be further converted, by means of continuum micromechanics models validated for a large number of cortical and trabecular bone samples, Reference Hellmich, Ulm and Dormieux50 to voxel-specific transversely isotropic fourth-order stiffness tensors. The situation becomes slightly more tricky if, rather than Hounsfield numbers, only gray values which are linearly proportionally related to the x-ray attenuation coefficients are given (with two per se unknown proportionality constants not disclosed by standard microCT equipment). One interesting feature of such attenuation-related gray values is that they still fulfill a volume average rule. Reference Scheiner, Sinibaldi, Pichler, Komlev, Renghini, Vitale-Brovarone, Rustichelli and Hellmich7 In the cases where each microvoxel just comprises a two-phase material, such as a glassy phase and micropores, the known gray values for voxels filled up by micropores or by dense glass only, give again access to voxel-specific microporosities, which when combined with suitable micromechanics models for porous polycrystals, Reference Fritsch, Hellmich and Young21 deliver voxel-specific elastic properties throughout porous bone tissue engineering scaffolds made out of bioglasses. Reference Scheiner, Sinibaldi, Pichler, Komlev, Renghini, Vitale-Brovarone, Rustichelli and Hellmich7 While the identification of the gray value of a pore-filled voxel follows quite unambiguously from a histogram made from all voxels found within the considered 3D image, identification of the largest gray value as being actually of dense glass requires that such a completely glass- or ceramic-filled voxel would indeed occur in the investigated construct. In the cases where this is not necessarily true the intravoxel analysis method has to be again refined: One way to do that consists of considering additional experiments conducted on the biomaterial scaffold, as it has been the case with hydroxyapatite bioceramics used as maxillofacial restoration tools Reference Dejaco, Komlev, Jaroszewicz, Swieszkowski and Hellmich51 : Again encountering a two-phase “pore-crystal” material in each voxel, mathematical integration of the microporous space over the entire scaffold domain gives access to the overall mass density of the scaffold. Alternative, independent retrieval of the latter from direct weighing and volume tests of the scanned object provides an additional equation for computing the microporosity found in the densest voxel. However, in all these contributions, the question remained on whether the proportionality constants between gray values and x-ray attenuation coefficients might be even directly accessible (without the need of additional – e.g., mass density – experiments), and the corresponding breakthrough was developed in detail in the present contribution: considering both the photon energy dependence of actual x-ray attenuation coefficients as publicly available in the NIST database, and the necessarily unique relation between gray values and x-ray attenuation coefficients, allowed indeed for direct determination of (i) the proportionality constants, (ii) the used photon energy, and (iii) the x-ray attenuation distribution throughout the micro- and macroporous bioceramic scaffolds. In this way, the user-driven relative “shifts” of gray value peaks in the different histograms depicted in Fig. 5 could be corrected, so as to make quantitative comparison between the images possible; and namely so based on a generally applicable physical quantity, namely the x-ray attenuation coefficients, see Fig. 7. Finally, these attenuation coefficients were transformed into other, micromorphologically governed physical properties, such as elastic properties (see Figs. 8–10). Corresponding analyses were performed on 8-bit gray scale values, as the latter contained sufficient information for the present application. In more detail, the micromechanical models are typically characterized by a predictive precision of one to a few percent relative error, as are the experimental data through which they are validated. Reference Fritsch, Hellmich and Young21,Reference Fritsch, Dormieux, Hellmich and Sanahuja23 Consequently, 16-bit data would not deliver more reliable elasticity maps, while increasing the computational times and memory requirements significantly. In combination with similar endeavors concerning bone tissue, Reference Blanchard, Dejaco, Bongaers and Hellmich52 this opens the way to realistic mechanical modeling of bone-tissue composites as encountered in tissue engineering, and when extending the morphology-to-mechanics conversion step toward material strength Reference Fritsch, Dormieux, Hellmich and Sanahuja23,Reference Fritsch, Hellmich and Dormieux53 and viscoelasticity, Reference Eberhardsteiner, Hellmich and Scheiner54 to reliable computer-aided biomaterial design, at a level approaching that of classical civil or mechanical engineering. We regard this as an important complement to various activities in mechanics-based biomaterial research emerging recently on the international engineering science scene. Reference Khanna, Katti and Katti55–Reference Chen, Baino, Spriano, Pugno and Vitale-Brovarone58 Thereby, related activities need not necessarily be restricted to bone tissue and its replacement, but may well span toward nonmineralized, collagen-based tissues. As could recently be shown from a collection of drying-weighing and x-ray diffraction test data Reference Katz and Li59–Reference Morin, Hellmich and Henits62 , these tissues follow general, mathematically defined composition rules related to an invariant ratio between hydration-driven fibrillar growth and the evolution of the extrafibrillar space. Reference Morin, Hellmich and Henits62 Once these rules are combined with mass density and attenuation average rules, in a way similar to that described throughout the present contribution, they hold the promise for noninvasively retrieving collagen and fluid contents from CT-scanned tendon or skin tissues. In a further step, these ideas may be carried forward to the case of mineralizing tissues such as calcifying cartilage: Indeed, structural changes in mineralizing tissues, as evidenced e.g., by neutron diffraction, Reference Lees, Bonar and Mook63,Reference Bonar, Lees and Mook64 could be traced back as the result of mineral precipitation in closed thermodynamic (extrafibrillar and tissue-level) systems, which in turn provides general, mathematically cast, mineralization rules with corresponding constituent volume fractions. Reference Morin and Hellmich65 The latter may then enter attenuation averaging rules. While this, as well as more detailed presentation of corresponding mechanics-related results, as currently under intensive investigation, is reserved for future publications, we re-iterate from the results of this study that also the newly developed intravoxel porosity analysis in itself has revealed remarkable bioresorption and cytocompatibility features, which, to the best knowledge of the authors, have never been described up to the present precision so far: Namely, resorption of β-TCP scaffolds occurs at the submicrometer level much more than at the millimeter level, and pre-osteoblastic cells do profilerate on the scaffolds' internal and external surfaces, as has been reported in earlier studies Reference Azami, Samadikuchaksaraei and Poursamar66 – however, the life conditions in static cultures do not trigger them as to produce real mineralized bone matrix. Therefore, dynamic conditions such as in a bioreactor Reference Lv, Deng, Ulery, Nair and Laurencin67,Reference Lv, Nair and Laurencin68 may be needed – they are at the center of the current and future practical clinical side of the described research endeavors. Wider practical use of the method will probably call for extended validation activities, so as to further increase the confidence in this novel approach. In this context, it seems straightforward to ask whether the elasticity maps of Figs. 8–10 might be directly validated by in situ nanoindentation studies. Reference Cuy, Mann, Livi, Teaford and Weihs69 In this context, it is noteworthy that, while our method delivers elastic properties throughout the volume of the investigated construct, nanoindentation is a surface-based technique, somehow representing the mechanical properties around the indent. Therefore, nanoindentation-based maps would call for cutting the investigated specimens along particular cross sections, a very demanding task given the brittleness of the samples and their size. Even if this obstacle might have been overcome, we would still be left with the fact that the tested surface and its surroundings would need particular treatment (such as polishing and embalmment), so as to render the test results repeatable and related to elastic properties. Reference Miller, Bobko, Vandamme and Ulm70 Thirdly, the elastic properties derived from nanoindentation of calcium phosphate ceramics are typically indentation depth-size dependent, Reference Khanna, Katti and Katti71 so that an elastic property which is only depending on location is not directly measurable. This dependence might be the fingerprint of material damage induced by the testing method itself. Reference Malandrino, Fritsch, Lahayne, Kropik, Redl, Noailly, Lacroix and Hellmich72 All these factors, in our opinion, do not necessarily qualify nanoindentation as a simple, robust method for direct validation of the elasticity maps of Figs. 8–10. While we still do not rule out the potential of nanoindentation when it comes to additional validation of our modulus maps, such activities, namely development of a novel indentation protocol for the aforementioned purposes, is clearly beyond the scope of the present manuscript. Still, it is important to re-iterate that our method has reached a fairly high validation standard. In fact, we use a rigorous mathematical combination of methods which were validated separately: The estimation of mechanical properties from CT gray values is based on fundamental relations from x-ray physics and micromechanics: as concerns the first, the average rule for attenuation coefficients is a universally accepted law for any chemical substance; and also continuum micromechanics is a field which has been successfully applied to almost any material, be it metallic, ceramic, or biological. In particular, the satisfactory prediction of the mechanical behavior of porous polycrystals made of calcium phosphate has been validated extensively by mechanical compressive and bending tests, Reference Peelen, Rejda and de Groot73–Reference Akao, Aoki and Kato77 ultrasonic Reference De With, van Dijk, Hattu and Prijs78,Reference Liu79 and resonance frequency tests. Reference Arita, Wilkinson, Mondragon and Castano80 Additional mechanical tests for validating the elasticity mapping technique will enter the scene once finite element (FE) models will be fed with the elastic properties shown in Figs. 8–10. Then the results of these FE simulations can be compared with mechanical tests on the whole samples. Already now, we are positive that corresponding validation tests will be successful, as they have been done in satisfactory manner when applying combined x-ray physics-micromechanics analyses on other biomaterials, namely glass–ceramic Reference Scheiner, Sinibaldi, Pichler, Komlev, Renghini, Vitale-Brovarone, Rustichelli and Hellmich7 and polymer–ceramic composites. Reference Luczynski, Dejaco, Lahayne, Jaroszewicz, Swieszkowski and Hellmich81 Another validation issue may concern the choice of the threshold value between solid and fluid/air voxels, which is determined automatically by taking the minimum between the peak of solid voxels and the rightmost, fluid/gas-related, peak of the gray scale probability density function, and how it would affect the results of our method. In fact, it only influences the determination of the macroporosity, and the identification of voxels in representing either solid or fluid/gaseous matter. Our thresholded images showed satisfactory similarity with the original scans as far as the imaged morphology was concerned; and Hara et al. Reference Hara, Tanck, Homminga and Huiskes82 found out by example of trabecular bone, that thresholding which is satisfactory under visual inspection, results in less than 5% error in the macroporosity. This precision is sufficient for reliably stating that bioceramic resorption in our case occurred predominantly at the micropore scale, while the macroporosity remained virtually unchanged.
ACKNOWLEDGMENTS
The authors are grateful for the financial support through the ERASMUS network, and through COST Action MP1005 NAMABIO, making the cooperation between the Reykjavik University and the Vienna University of Technology (TU Wien) possible. Moreover, the Viennese researchers gratefully acknowledge the support from the European Research Council (ERC), in the course of project #257023, MICROBONE.