I. INTRODUCTION
Nowadays, Al–Mg–Si–Cu alloys have been widely applied in various fields, especially in the commercial area. Compared to the super high strength of Al–Zn–Mg–Cu alloys, the Al–Mg–Si–Cu alloys own a better formability, corrosion resistance, weldability and low cost but lower strength. Reference Zhong, Rometsch, Cao and Estrin1,Reference Eskin, Massardier and Merle2 These advantages of Al–Mg–Si–Cu alloys will expand their application range. But their medium strength, as the weakness, will become a considerable limitation. Therefore, it is necessary to increase their tensile strength but not damage the plasticity a lot at the same time. There are several effective methods to improve the microstructures and mechanical properties such as: (i) improving the deformation processes and heat treatments; (ii) modifying the contents of main elements in the Al–Mg–Si–Cu alloys like Mg, Si and Cu; (iii) adding the new minor elements like Zr, Sc, Cr, Mn to change the recrystallization behaviors and so on. The first method mentioned above has certain limitations because it can not improve the microstructures and mechanical properties radically. Numerous investigations Reference Murayama, Hono, Miao and Laughlin3–Reference Weatherly, Perovic, Mukhopadhyay, Lloyd and Perovic7 on the second method have been carried out in recent years. The last method mentioned above about the minor elements addition is another important way to strengthen the wrought aluminum alloys. Lars Lodgaard et al. Reference Lodgaard and Ryum8 studied the formation of the dispersoids which were rich in Mn and/or Cr in Al–Mg–Si alloys. Yi Han et al. Reference Han, Ma, Li, Chen and Nagaumi9 investigated that with the increase of magnesium content, precipitation of S phase was promoted and as a result of an enhancement in strength. M. Cabibbo et al. Reference Cabibbo and Evangelista10 studied the role of fine Al3(Sc1−x , Zr x ) dispersoids pertaining to Al–Mg–Si–(Sc–Zr) alloy and Al3Zr dispersoids pertaining to Al–Mg–Si–(Zr) alloy by means of transmission electron microscopy. Emmanuel Clouet et al. Reference Clouet, Barbu, Laé and Martin11 investigated the precipitation kinetics of Al3Zr and Al3Sc in aluminum alloys modeled with cluster dynamics. Yijie Zhang et al. Reference Zhang, Ma, Yi, Li and Wang12,Reference Zhang, Wang, Ma and Li13 studied the effect of Fe on grain refinement of pure aluminum. And it was concluded that the influence of Fe on grain refining might have two different kinds of effects, which were that solute Fe atoms promoted nucleation of primary α-Al crystal during solidification process and in situ FeAl3 rods could act as pinning effect on grain boundary and hindering grain growth. But much more literature Reference Yi, Gao, Lee and Lindley14–Reference Kobayashi16 reported the deleterious influences of Fe on the aluminum alloys. Therefore, little work is concentrated on the beneficial effect of Fe on the microstructures of wrought Al–Mg–Si–Cu alloys such as the recrystallization behaviors etc.
S.C. Bergsma et al. Reference Bergsma, Kassner, Li and Wall17–Reference Bergsma and Kassner19 developed a new Al–Mg–Si–Cu–Cr–V alloy prepared by an ‘Air Slip’ direct chill cast (ASDC) in 1997, and the extrusions-T6 of this alloy owned both the high strength and relatively good plasticity. This new Al–Mg–Si–Cu alloy was considered as a high strength 6XXX series aluminum alloy because the ultimate tensile strength (UTS) of its hot extrusion-T6 after equal channel angular extrusion (ECAE) reached as high as 478 MPa. Reference Bergsma, Kassner, Li and Wall17,Reference Bergsma and Kassner19 This alloy would be a promising material used for bicycle manufacturing. But the technology of ECAE can not be wildly used in the industrial production. Besides, when this alloy was prepared in the factory by means of hot extrusion at >723 K (450 °C) with an extrusion ratio of >70, its strength reduced to 390–400 MPa owing to the coarse recrystallization grains according to the authors’ own research results, and thus could not meet the strength requirement of ≥430 MPa for bicycle used materials. A new LFEC Al–1.6Mg–1.2Si–1.1Cu–0.15Cr–0.15Zr (all in wt%) alloy has been developed by the authors to meet the minimum strength requirement successfully and avoid the coarse recrystallization grains, Reference Meng, Cui, Zhao and He20 but the higher strength requirement was put forward for the increasing rate of final products in the process of industrial producing. So it is very important to find an effective method to improve the strength of the Al–1.6Mg–1.2Si–1.1Cu–0.15Cr–0.15Zr alloy further and with relatively low cost of ductility. Addition of Fe into this alloy will be helpful to the improvement of its strength. However, few literature is concentrated on the reasons and mechanism about why Fe can improve the strength of the Al–Mg–Si–Cu alloy in details.
In this paper, different contents of Fe were added into the LFEC Al–1.6Mg–1.2Si–1.1Cu–0.15Cr–0.15Zr alloy. Compared to the new high strength 6XXX series aluminum alloy mentioned by S.C. Bergsma in Refs. Reference Bergsma, Kassner, Li and Wall17 and Reference Bergsma and Kassner19, the alloys studied in this research contained different contents of host elements like Mg, Si, Cu and minor elements addition. The effects of Fe on the evolution of microstructures and the improvement of mechanical properties of the LFEC Al–1.6Mg–1.2Si–1.1Cu–0.15Cr–0.15Zr alloy, including the strengthening mechanism of Fe on this alloy were investigated in details. At the same time, new super high strength Al–Mg–Si–Cu–Cr–Zr–Fe alloys with higher UTS (>500 MPa) and relatively good formability were developed.
II. MATERIAL AND METHODS
The chemical compositions of the alloys A, B and C with different Fe contents used in this study were listed in Table I. All these alloys were prepared by commercial purity aluminum whose actual chemical composition was shown in Table II. The elements of Si, Ti, Cu, Cr and Zr were used in the form of Al–23 wt% Si master alloy, Al–40 wt% Ti master alloy, pure copper, chromium tablet (contains 63 wt% Cr including burning loss) and zirconium tablet (contains 85 wt% Zr including burning loss) respectively. Although no Fe was added in the alloy A, the analyzed Fe content of alloy A had already been 0.168 wt% (Table I), which was mostly because the commercial purity aluminum contained 0.141 wt% Fe as shown in Table II. In addition, during the preparation of the alloy, those master alloys mentioned above for the addition of other elements and some tools for melting alloys also contained a quantity of Fe and as a result of the further increment of Fe content from 0.141 wt% to 0.168 wt% in the alloy A. Therefore, higher Fe contents were carried out by means of adding ferrum tablet (contains 72 wt% Fe including burning loss) into the alloys B and C on the basis of the actual Fe content of the alloy A, respectively. These three alloys were molten in a gas furnace, degassed by high purity argon gas at 1023 K (750 °C), slag removed and refined at 1033 K (760 °C), respectively. Then Ø152 mm ingots were got by low frequency electromagnetic casting (LFEC) processes separately at melt temperature of 1023 K (750 °C), and the casting speed was 110 mm/min. The electromagnetic field was realized by an 80 turns water-cooled copper coil surrounding the aluminum alloy mold. The frequency of electromagnetic field was fixed at 15 Hz and the current intensity was 120 A, while the flow rate of cooling water was 80 L/min.
Chemical composition of experimental alloys (wt%).

Analyzed composition of the commercial pure aluminum used in the present work (wt%).

The ingots were homogenized at 813 K (540 °C) for 24 h in an electrical resistance furnace with a fan and cooled to room temperature using forced air at a cooling rate of 300 K/h (300 °C/h). The homogenized alloys for hot extrusion with 127 mm in diameter and 300 mm in length were pre-heated at 723 K (450 °C) for about 30 min and then hot extruded in a 11,000 kN horizontal forward hydraulic press with a press exit temperature of below 753 K (480 °C). The rod shaped extrusions (Ø15 mm) were water quenched to room temperature and then cut into the samples with the length of 120 mm. These samples with different Fe contents were solid solution treated at 823 K (550 °C) for 2 h and then cooled to room temperature by water quench. Artificial aging treatment at 443 K (170 °C) for 12 h (T6 heat treatment) was performed in a gas furnace and finally air-cooling to room temperature (the transfer time was less then 30 s). These samples were stored at a low temperature until further analysis was performed.
Differential scanning calorimetry (DSC) analysis was performed in a purified argon atmosphere using a SETSYS EVOLUTION-16 DSC instrument (Setaram Instrumentation, Caluire, France) with a scanning rate of 10 K/min from room temperature to 968 K (695 °C). The tensile tests for as-extruded and T6 heat treated samples with the gauge diameter of 8 mm and the length of 45 mm were carried out at room temperature. At least three standard cylindrical tensile specimens for each condition were tested by the CMT5105 universal test machine (Shenzhen Skyan Power Equipment Co. Ltd., Shenzhen, China) to obtain the average values of mechanical properties in air at a constant crosshead velocity of 2 mm/min.
The microstructures were investigated by applying the optical microscope (OM), scanning electron microscopy (SEM), transmission electron microscopy (TEM) and energy dispersive spectrometer (EDS). The specimens of ingots for optical examinations and SEM were cut from the center of ingots into approximately 20 × 20 × 20 mm. The specimens of both as-extruded alloys and extrusions-T6 for optical observation and SEM were sectioned parallel to axis. The specimens for TEM were cut from the extrusions-T6 in longitude direction and prepared by twin-jet thinning electrolytically in a solution of 30% nitric acid and 70% methanol at 248 K (−25 °C) and 12 V. Samples for optical examinations were polished by standard techniques. The as-cast samples were electrochemically etched with a solution of 38 vol% H2SO4, 43 vol% H3PO4 and 19 vol% H2O at 0.1–0.5 A and 20–30 V and then observed under polarized light on LEICA DM 5000 type optical microscope (Leica Microsystems Inc., Buffalo Grove, Illinois), while the as-extruded and T6 heat treated samples were etched by Kellers for 10 s and then observed on this microscope as well. A JSM-6301F field emission scanning electron microscope (SEM; JEOL Ltd., Tokyo, Japan) equipped with energy dispersive analytical X-ray (EDAX) was used to observe the microstructure characteristics of the ingots, as-extruded alloys and T6 heat treated samples. A Philips EM 420 transmission electron microscope (TEM; Philips Ltd., Almelo, The Netherlands) was used for high magnification observation of the T6 heat treated samples.
III. RESULTS AND DISCUSSIONS
A. Effect of Fe content on as-cast microstructures
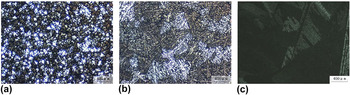
Figure 1 shows the as-cast microstructures of alloys A, B and C taken under polarized light. It can be clearly seen that a large number of equiaxed grains are detected in the alloy A, and its mean grain size is about 71 μm, while the alloy B with 0.356 wt% Fe shows an extremely coarse dendritic network. However, when the Fe content increases from 0.356 to 0.601 wt%, feathery grains are visible in the as-cast microstructure of alloy C since they can be revealed with different colors under polarized light after etching. It has been well known that the solidification of aluminum alloys with the feathery grain morphology will be promoted by some specific solidification conditions such as a high thermal gradient at the solidification front, a high cooling rate, some flow patterns, the lack of inoculants and certain alloying elements. Reference Henry, Jarry and Rappaz21,Reference Turchin, Zuijderwijk, Pool, Eskin and Katgerman22 Since other conditions, except different Fe contents, are in agreement with each other during the solidification of alloys A, B and C, it can be concluded that the increase of Fe content should promote the formation of feathery crystal during solidification of the alloys.
As-cast microstructures in alloys A–C with different Fe contents under polarized light: (a) alloy A; (b) alloy B; (c) alloy C.

A feathery grain is made of an array of parallel, twinned lamellae that are alternately separated by coherent (111) twin planes and incoherent wavy twin boundaries. Reference Henry, Jarry and Rappaz21,Reference Henry, Minghetti and Rappaz23,Reference Kumar and O’Reilly24 So feathery grains are markedly different from the columnar or equiaxed morphologies which are usually observed in casting. Feathery dendrites grow along 〈110〉 directions and their primary trunks directions are twinned and close to the thermal gradient direction. The twin planes cut primary dendrite trunks. The wavy incoherent boundaries correspond to the impingement of secondary dendrites arms, which also grow along 〈110〉 directions on both sides of these trunks. Some literature reported Reference Henry, Jarry and Rappaz21,Reference Turchin, Zuijderwijk, Pool, Eskin and Katgerman22 that feathery grains affected the properties of the solidified structure during casting or welding: strong anisotropy resulting in uneven deformation during hot rolling, non-uniform aspect after etching, an abnormal microsegregation pattern. On the contrary, because the parallel lamellae which constitute feathery grains are successively separated by straight and wavy boundaries and the misorientation between feathery grains is very small, the solidification feeding of molten metal and inclusion removal rate should be enhanced in the solidification moment. As a result, the volume of porosity defects and/or inclusion defects in ingots should be obviously reduced. And this could fundamentally improve the strength of the alloy a lot. Furthermore, owing to the agitation caused by the low frequency electromagnetic during direct chill casting of the alloys A, B and C, the possibility of shrinkage porosities and inclusion which will result in the deterioration of the tensile properties in the aluminum ingot will be increased. So it can be concluded that the feathery grains containing alternate coherent and incoherent boundaries could reduce the number of shrinkage porosities and inclusion largely in the as-cast alloy C produced by LFEC, comparing to the LFEC-ingots A and B without feathery grains.
Therefore, the increase of Fe content in the Al–1.6Mg–1.2Si–1.1Cu–0.15Cr–0.15Zr alloys produced by LFEC should reduce the amount of porosity defects and inclusion defects in the ingot due to the appearance of feathery grains. This could be obviously good for the strength improvement to some extent.
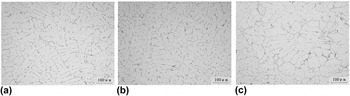
Figure 2 indicates the as-cast microstructures of alloys A, B and C with different Fe contents at center of the ingots respectively. The number of skeleton typed phases increases with the increase of Fe content based on Fig. 2. Few skeleton typed phase is visible in as-cast alloy A [Fig. 2(a)], while some are existed within the grain boundary of as-cast alloy B as shown in Fig. 2(b). Furthermore, a large amount of skeleton typed phases are present along the grain boundary of as-cast alloy C in Fig. 2(c).
As-cast microstructures of alloys A–C with different Fe contents without etched (at the center of each ingot): (a) alloy A; (b) alloy B; (c) alloy C.

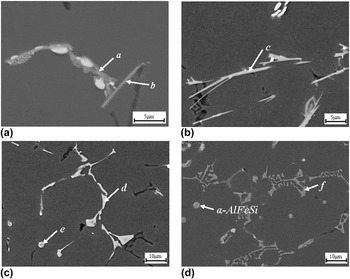
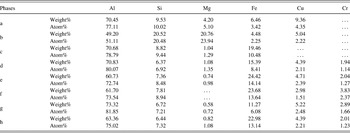
Figure 3 and Table III illustrate the SEM microstructures and EDS analysis results of as-cast alloys A, B and C respectively. As shown in Fig. 3(a), two kinds of Fe-containing phases are present in as-cast alloy A. One is distributed in the grain boundary like the phase a, another is the needle-like shaped β-AlFeSi phase like the phase b. While, the SEM microstructures and EDS analysis results of as-cast alloy B in Figs. 3(b) and 3(c) and Table III show that, there are three types of Fe-containing phases in the microstructures of as-cast alloy B with addition of 0.356 wt% Fe. And two of them in as-cast alloy B are similar to those in as-cast alloy A: needle-like β-AlFeSi phase such as phase c in alloy B shown in Fig. 3(b) and skeleton typed Al(FeCr)Si phase such as phase d distributed in the grain boundaries of alloy B shown in Fig. 3(c). Based on its morphology and location, the skeleton typed Al(FeCr)Si phase should belong to a kind of α-AlFeSi phase. Reference Kumar and O’Reilly24–Reference Kumar, Grant and O’Reilly26 Besides, Fig. 3(c) shows the third kind of Fe-containing phase (phase e) with the spherical morphology (diameter: ∼2.93 μm, area: ∼6.73 μm2) present in alloy B. Based on its EDS analysis result in Table III and its morphology, it should be α-AlFeSi phase as well. Reference Verma, Kumar, Grant and O’Reilly27 So it can be concluded that the increase of Fe content could promote the formation of both the α-AlFeSi phase and β-AlFeSi phase. Although the β-AlFeSi phase in alloy A and alloy B will reduce their hot workability and result in pick-up formation during extrusion, the α-AlFeSi phase will improve the ductility and extrudability of the alloy. Reference Verma, Kumar, Grant and O’Reilly27 Therefore, it is possible to promote the formation of more desirable α-AlFeSi phases by means of enhancing the Fe content of the LFEC Al–1.6Mg–1.2Si–1.1Cu–0.15Cr–0.15Zr alloy from 0.168 wt% to 0.356 wt%, and as a result, the deleterious influence of β-AlFeSi phase on the ductility of the alloy may be weakened by the formation of a large amount of α-AlFeSi phases. Additionally, the excess of Si element in the Al–1.6Mg–1.2Si–1.1Cu–0.15Cr–0.15Zr alloy also provides the possibility of forming more α-AlFeSi phases and as a result of achieving higher mechanical properties. Reference Zhao, Qian, Cui, Wu and Liu28
SEM microstructures of as-cast alloys A, B and C respectively: (a) SEM microstructure of as-cast alloy A; (b) and (c) SEM microstructures of as-cast alloy B; (d) SEM microstructure of as-cast alloy C.


Figure 3(d) and Table III show the SEM microstructure and EDS analysis result of as-cast alloy C. According to Figs. 2(c) and 3(d), the skeleton typed phases (such as phase f) along the grain boundary of the alloy C are still Al(FeCr)Si phases. Their quantities increase significantly with the increase of Fe content from 0.356 wt% to 0.601 wt%. This Al(FeCr)Si phase could be also identified as a kind of α-AlFeSi phase. Reference Kumar and O’Reilly24–Reference Kumar, Grant and O’Reilly26 Additionally, some other α-AlFeSi phases with spherical shape are also present in the alloy C. Therefore, it can be concluded that further increase of Fe content from 0.356 wt% to 0.601 wt% might not change the types of Fe-containing phases but largely increase the quantities of the skeleton typed Al(FeCr)Si phases (a kind of α-AlFeSi phase) along the grain boundaries of the as-cast alloys.
B. Effect of Fe content on microstructures of alloys after homogenization
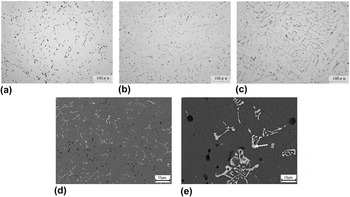
Figure 4 shows the microstructures of alloys A, B and C after homogenization at 813 K (540 °C) for 24 h. It can be clearly found from Figs. 4(a)–4(c) that the number of remnant phases increases with the increase of Fe content. And most of the remnant phases (such as phase g) which are still located in the grain boundaries and own the skeleton morphology after homogenization are Al(FeCr)Si phases (or can be thought as α-AlFeSi phases) according to the SEM image and EDS analysis result of the alloy B after homogenization treatment as shown in Figs. 4(d), 4(e) and Table III. It is widely known Reference Chen, Costan, Van Huis, Xu and Zanbergen29,Reference Yassar, Field and Weiland30 that the main strengthen phase (Mg2Si) in the Al–Mg–Si alloy is unstable at relatively high temperatures, but the Al(FeCr)Si phase, as a kind of α-AlFeSi phase, is relatively stable during homogenization treatment at a high temperature. As a result, the Al(FeCr)Si phase cannot dissolve into the Al matrix largely during homogenization, and then it could probably inhibit the migration of recrystallized grain boundaries during the subsequent process as soon as the size of remnant Al(FeCr)Si phase being small enough.
Microstructures of alloys A–C homogenized at 540 °C for 24 h without etched respectively: (a) optical image of alloy A; (b) optical image of alloy B; (c) optical image of alloy C; (d) and (e) SEM images of the alloy B.

C. Effect of Fe content on microstructures of as-extruded alloys
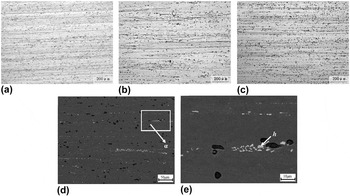
Figure 5 indicates the microstructures of as-extruded alloys A, B and C with different Fe contents in longitudinal direction respectively. It can be clearly seen from Figs. 5(a)–5(c) that the complex fibrous microstructures are present in these three as-extruded alloys. The corresponding SEM images of the as-extruded alloy B in the longitudinal direction are shown in Figs. 5(d) and 5(e). The EDS data of phase h in Fig. 5(e) is shown in Table III. On the basis of Table III and the SEM backscattered electron imaging theory, all the small phases with the similar contrast around phase h in Fig. 5(e) should be the Fe-containing phases (including phase h). Then according to the EDS data in Table III, it can be thought that the phases d and e in Fig. 3(c) and Fe-containing phases in Fig. 5(e) are the same phases: Al(FeCr)Si phase or spherical α-AlFeSi phase. Phase h with the area of ∼6.54 μm2 in Fig. 5(e) should be the spherical α-AlFeSi phase shown in Fig. 3(c) (area of the phase e: ∼6.73 μm2), and the shape difference between phase e in Fig. 3(c) and phase h in Fig. 5(e) should be because the α-AlFeSi phase is stretched along the extrusion direction caused by the hot extrusion. In addition, it can be found that the sizes of the Fe-containing phases nearby the phase h in Fig. 5(e) are smaller than those of skeleton typed Fe-containing phases in the grain boundaries shown in Fig. 3(c). Therefore, it can be obviously concluded that the skeleton typed Fe-containing phases in the grain boundaries of the ingot are crushed into small pieces and distributes along the extrusion direction in the process of hot extrusion.
Microstructures of as-extruded alloys A–C with different Fe contents in longitudinal direction: (a) optical image of alloy A with etched; (b) optical image of alloy B with etched; (c) optical image of alloy C with etched; (d) SEM image of the alloy B; (e) magnified SEM image of the rectangular area α in image (d).

Based on the previous research done by the authors, Reference Meng, Cui, Zhao and He20 the addition of 0.15 wt% Zr to the alloy played an important role in inhibition of dynamic recrystallization nucleation and grain growth in the as-extruded alloy A, as shown in Fig. 5(a). Therefore, it can be considered from Figs. 5(a)–5(c) that the increase of Fe content will not distinctly reduce the restraining of dynamic recrystallization carried out by the minor Zr addition in the LFEC Al–1.6Mg–1.2Si–1.1Cu–0.15Cr–0.15Zr as-extruded alloys. As a result, the work hardening formed in the process of hot extrusion is maintained completely in these three as-extruded alloys and then their strength will not be depressed by the increasing Fe content. Conversely, just like the phases present in as-extruded alloy B in Figs. 5(d) and 5(e), the Fe-containing phases which are crushed into small sizes during hot extrusion might pin the movement of dislocations to some extent and finally improve the strength of the LFEC Al–1.6Mg–1.2Si–1.1Cu–0.15Cr–0.15Zr as-extruded alloys with different Fe contents.
D. Effect of Fe content on microstructures of extrusions-T6
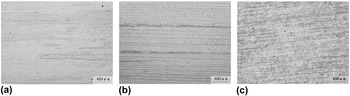
Figure 6 indicates the etched micrographs of T6 heat treated extrusions of alloys A, B and C on the longitudinal section. Partial static recrystallization instead of completely equiaxed grain structure is visible distinctly in the T6 heat treated alloy with the Fe content of 0.168 wt% as shown in Fig. 6(a). It is mainly due to the trace Zr addition to the alloy based on the previous research. Reference Meng, Cui, Zhao and He20 While, the complex fibrous microstructures are present in both the T6 heat treated alloys B and C with the Fe additions of 0.356 wt% and 0.601 wt% respectively as shown in Figs. 6(b) and 6(c). Although the Zr addition to the alloy plays an important role in inhibition of static recrystallization, it is evident that the increase of Fe content from 0.168 wt% to 0.601 wt% makes a significant contribution to restrain the formation of grain boundaries and their migration in the subsequent solid solution treatment at a high temperature (550 °C). And as a result, the recrystallization temperature is raised dramatically by the Fe content increasing. In addition, it is reasonable to assume that the increase of Fe content should not reduce the restraining effect of Zr addition on the static recrystallization.
Microstructures of alloys A–C with different Fe contents after T6 heat treatment in longitudinal direction (etched): (a) alloy A; (b) alloy B; (c) alloy C.

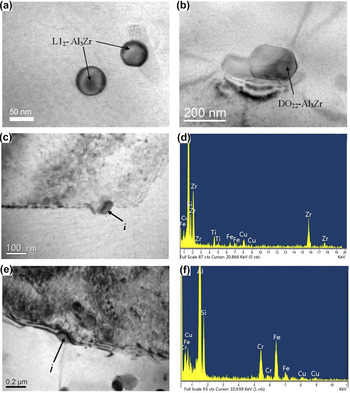
Figure 7 displays the TEM micrographs of Zr-containing particles and Fe-containing phases in the T6 heat treated extrusions of alloys A and B respectively. Based on a large number of observations of TEM micrographs, it can be found that both a certain amount of spherical shaped L12-type Al3Zr particles with the sizes of ∼60 nm in diameters indicated by arrows in Fig. 7(a) and a few elliptical shaped DO22-type Al3Zr phase with relatively large size indicated by arrow in Fig. 7(b) are present in the extrusion-T6 of alloy A. Reference Meng, Cui, Zhao and He20 Both of them are believed to be metastable dispersoids and as a result of embarrassing the movement of dislocations as well as hindering the nucleation of recrystallized grains. However, a certain amount of DO22-type Al3Zr phases [such as phase i in Figs. 7(c) and 7(d)] with the small sizes of ∼70 nm long and ∼35 nm wide and few L12-type Al3Zr particles are visible in the extrusion-T6 of alloy B. Therefore, it can be concluded that, the increase of Fe content from 0.168 wt% to 0.356 wt% promotes the formation of the large amount of elliptical shaped DO22-type Al3Zr phases with small size, but restrains the formation of spherical shaped L12-type Al3Zr phase. Although the impact of DO22-type Al3Zr phases on inhibiting the recrystallization is smaller than that of L12 Al3Zr phases in the extrusion-T6 of alloy A mainly owing to their size differences, a large amount of DO22-type Al3Zr phases should restrain the nucleation of recrystallization strongly as well when the sizes of DO22 Al3Zr particles are relatively small in the extrusion-T6 of alloy B. Additionally, Al(FeCr)Si phase (such as phase j) with the size of ∼120 nm long and ∼75 nm wide is visible as shown in Figs. 7(e) and 7(f). Although its size is slightly larger than that of DO22 Al3Zr particle in the extrusion-T6 of alloy B, this Fe-containing phase would still strongly restrict the migration of grain boundaries and sub-grain boundaries during solid solution treatment at a high temperature due to their fairly high density and high thermal stability. Finally, according to Figs. 6(a), 6(b) and 7, it can be clearly considered that the combination effects of some fine DO22 Al3Zr particles and Al(FeCr)Si phases on inhibition of the movement of dislocations and the migration of recrystallized grain boundaries in the extrusion-T6 of alloy B are much larger than the combination effects of some L12 Al3Zr phases and a few DO22 Al3Zr particles with relatively large size in the extrusion-T6 of alloy A. As a result, partial static recrystallization is present in the extrusion-T6 of alloy A [Fig. 6(a)], while the complex fibrous microstructures [Fig. 6(b)] are present in the extrusion-T6 of alloy B with the Fe content of 0.356 wt%. Therefore, it can be concluded that the increase of Fe content from 0.168 wt% to 0.356 wt% promotes the formation of both the DO22 Al3Zr particles with small size and Al(FeCr)Si phases. These particles make a great contribution to the static recrystallization inhibition in the LFEC Al–1.6Mg–1.2Si–1.1Cu–0.15Cr–0.15Zr alloys after solid solution treatment at a high temperature. As a result, the strength of extrusion-T6 of the alloy is improved by the remained work hardening formed in the process of hot extrusion.
Bright field TEM micrographs and EDS analysis results of the T6 heat treated extrusions of alloys A and B: (a) and (b) bright field TEM micrographs of alloy A; (c) and (e) bright field TEM micrographs of alloy B; (d) EDS analysis result of phase i in image (c); (f) EDS analysis result of phase j in image (e).

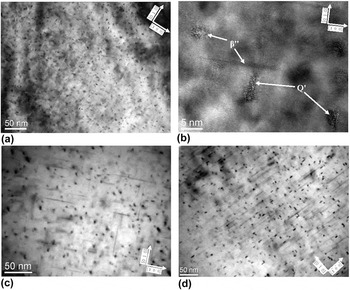
Figure 8 shows the bright field TEM micrographs of the T6 heat treated alloys of A, B and C with different Fe contents taken with [0 0 1]Al. Figure 8(a) shows a great amount of precipitates delineated by strain-field contrast. It can be seen from Fig. 8(b) that the needle-shaped β″ phases (∼2–4 nm in diameters) and the lath-shaped Q′ phases (the precursor of Q phases) are present in the extrusion-T6 of alloy A with the Fe content of 0.168 wt%. Reference Meng, Cui, Zhao and He20 Some researches Reference Chen, Costan, Van Huis, Xu and Zanbergen29,Reference Yassar, Field and Weiland30 considered that the Q′ precipitates, besides β″ phases, were also the important strengthening phases in the Al–Mg–Si–Cu alloys. As shown in Figs. 8(c) and 8(d), a great number of β″ phases with similar size and Q′ phases are present in both the extrusions-T6 of alloys B and C as well. So according to Figs. 8(a), 8(c) and 8(d), the increase of Fe content does not influence the volume fraction and size of β″ precipitates. In addition, it can be clearly seen from Fig. 8 that the number of Q′ precipitates in the extrusions-T6 increases largely with the increase of Fe content from 0.168 wt% to 0.356 wt%, comparing the alloy A [Fig. 8(a)] with the alloy B [Fig. 8(c)]. Both the number and the size of Q′ precipitate increase further when the Fe content keeps on rising from 0.356 wt% to 0.601 wt%. Therefore, it can be concluded that the increase of Fe content significantly promotes precipitation of Q′ phases, while does not influence the volume fraction and size of β″ precipitates. As a result, the strength of extrusions-T6 of alloys B and C should be enhanced notably with the increasing number of Q′ precipitates caused by the increase of Fe content, compared with the strength of the extrusion-T6 of alloy A.
Bright field TEM micrographs of the T6 heat treated extrusion of alloys A, B and C taken with [0 0 1]Al: (a) TEM micrograph of alloy A; (b) HRTEM micrograph of needle-shaped β″ and lath-shaped Q′ precipitates in alloy A; (c) TEM micrograph of alloy B; (d) TEM micrograph of alloy C.

E. Effect of Fe content on mechanical properties of alloys
Table IV illustrates the mechanical properties of as-extruded alloys A, B and C with different Fe contents. The UTS, yield strength and elongation of the as-extruded alloy A are 348 MPa, 200 MPa and 18.31%, respectively. Those of as-extruded alloy B are 341 MPa, 189 MPa and 19.73%, respectively. So the increase of Fe content from 0.168 wt% to 0.356 wt% has little influence on the improvement of the strength of the as-extruded alloys. On the contrary, the UTS and yield strength of the as-extruded alloy C are improved largely to 436 MPa and 290 MPa respectively when the Fe content further increases to 0.601 wt%, but the elongation of as-extruded alloy C slightly descends to 16.6%. No dynamic recrystallization is visible in any as-extruded alloys shown in Figs. 5(a)–5(c), so the reasons why the strength of as-extruded alloy C is much larger than that of as-extruded alloys A and B should be because the number of Al(FeCr)Si dispersoids increases largely (Figs. 2–4 and 7), as well as the number of casting defects is declined caused by the formation of the feathery grains in the alloy C (Fig. 1) during solidification. Therefore, it can be concluded that both the increase of Al(FeCr)Si dispersoids in number and the appearance of feathery grains in the ingots result in the improvement of the strength of the as-extruded alloys with the increase of Fe content.
Mechanical properties of alloys A, B and C in as-extruded and T6 condition.

Table IV also indicates the mechanical properties of T6 heat treated alloys A, B and C with different Fe contents. There are some differences in rules of mechanical properties between as-extruded alloys and the extrusions-T6 of alloys A, B and C. The UTS, yield strength and elongation of T6 heat treated alloy A with the Fe content of 0.168 wt% are 440 MPa, 361 MPa and 16.7%, respectively. When the Fe content increases from 0.168 wt% (alloy A) to 0.356 wt% (alloy B), the UTS and yield strength of the extrusion-T6 significantly increase to 503 MPa and 478 MPa respectively, while its elongation drops to 12.25%. The main reasons why the strength is improved significantly with the increase of Fe content from 0.168 wt% to 0.356 wt% are as follows: firstly, based on Figs. 3(a)–3(c), 4, 5(d), 5(e) and 7, the increase of Fe content promotes the formation of metastable and fine DO22 type Al3Zr particles and the increase of Al(FeCr)Si dispersoids in number. These dispersoids will restrain the recrystallization nucleation and grain growth further during T6 heat treatment and result in a complete fiber characteristic (alloy B) instead of the partial static recrystallization (alloy A) in the microstructures of extrusions-T6 as shown in Figs. 6(a) and 6(b), and finally the strength of extrusion-T6 of alloy B will not be declined by the recrystallization; Secondly, the number of Q′ precipitates which pin the movement of dislocation strongly increases with the increase of Fe content, and as a result the strength of alloy B will be improved further according to Figs. 8(a) and 8(c). Therefore, the strength of the extrusion-T6 of alloy B is improved obviously compared with that of the alloy A.
When the Fe content keeps on rising to 0.601 wt% (alloy C), the UTS and yield strength of the extrusion is just slightly improved to 520 and 503 MPa after T6 heat treated, but its elongation still undesirably keeps on dropping to 10.38%. The main reasons why the strength of the extrusion-T6 of alloy C still continues to be improved but its increase range reduces remarkably should be following: firstly, although it can be assumed that the number of Al(FeCr)Si phases could increase further with the increase of Fe content from 0.356 wt% to 0.601 wt%, the effect of Al(FeCr)Si dispersoids on inhibition of recrystallization has maximized when the alloy contains 0.356 wt% Fe on the basis of Fig. 6. So the effect of work hardening on the strength improvement in the extrusion-T6 of alloy C should be almost the same with that in the alloy B due to the same hot extrusion process and the same complex fibrous microstructures. As a result, the increasing number of Al(FeCr)Si dispersoids contributes little to the improvement of strength of the extrusion-T6 when the Fe content is more than 0.356 wt%. Secondly, the number of Q′ precipitates keeps on increasing with the increase of Fe content from 0.356 wt% to 0.601 wt% in accordance with Figs. 8(c) and 8(d), so the effect of Q′ precipitates on restraining of dislocation movement is enlarged further. And finally the strength is just improved to some extent. In addition, it can be clearly seen that the elongation of the extrusions-T6 keeps on decreasing with the increase of Fe content from 0.356 wt% to 0.601 wt%. It should be due to the combination effects of Al(FeCr)Si dispersoids and Q′ precipitates. Some literature Reference Yi, Gao, Lee and Lindley14,Reference Crepeau15 reported that Al(FeCr)Si phase is bad for the ductility of alloys. While, it is no doubt that precipitation hardening caused by Q′ precipitates will decrease the ductility as well.
Based on the researches above, it can be concluded that the optimum Fe content is 0.35 wt% in the LFEC Al–1.6Mg–1.2Si–1.1Cu–0.15Cr–0.15Zr alloy for the industrial production when the inevitable errors of chemical composition is ignored. This alloy will have a super high strength of >500 MPa and with acceptable cost of ductility (>12%) at this time. On the one hand, if the alloy contains Fe less than 0.35 wt%, its strength will decline dramatically. On the other hand, although the strength will still be improved slightly when the Fe content of the alloy is more than 0.35 wt%, the elongation undesirably drops to a very low level (∼10%). And as a result, its application should be limited in many commercial areas. But it is interested that the feathery grains which could reduce the number of casting defects will be present once the Fe content increases to 0.6 wt% in the Al–1.6Mg–1.2Si–1.1Cu–0.15Cr–0.15Zr alloy.
IV. CONCLUSIONS
In this study, since Fe was one of the inevitable alloy elements in the aluminum alloys, the good influences of Fe on the microstructures and mechanical properties of LFEC Al–1.6Mg–1.2Si–1.1Cu–0.15Cr–0.15Zr (all in wt%) alloys A, B and C in the processes of solidification, homogenization, hot extrusion and T6 heat treatment were investigated. On the basis of the experimental results, the following conclusions can be drawn:
-
(1) The addition of Fe promotes the formation of feathery grains which should reduce the number of casting defects in the ingot owing to the growing mechanism of feathery grains, and as a result of the improvement of strength. Feathery grains are present obviously in the as-cast alloy with 0.601 wt% Fe.
-
(2) The increase of the Fe content increases the number of fine Al(CrFe)Si phases and promotes the formation of spherical shaped α-AlFeSi phases in the LFEC Al–1.6Mg–1.2Si–1.1Cu–0.15Cr–0.15Zr (all in wt%) alloys. In particular, the amount of Al(CrFe)Si phases increases extremely when the Fe content is higher than 0.356 wt%.
-
(3) The increasing Fe content promotes the precipitation of both the Q′ phase as another important strengthening phase in the Al–1.6Mg–1.2Si–1.1Cu–0.15Cr–0.15Zr (all in wt%) alloys and the fine DO22 type Al3Zr particles. During hot extrusion and solid solution treatment at a high temperature of 823 K (550 °C), a combination of the elliptical shaped DO22-Al3Zr dispersoids and the spherical/elliptical shaped Fe-containing phases hinder the formation of recrystallized grain boundaries and their migration, and then, the complex fibrous microstructures are present in both alloys with the Fe content of 0.356 wt% and 0.601 wt%. In the process of aging treatment, both of the number and size of Q′ precipitates present in the extrusions-T6 increase with the increase of Fe content.
-
(4) Both the increase of Al(FeCr)Si dispersoids in number and the appearance of feathery grains in the ingots result in the improvement of as-extruded alloys in strength with the increase of Fe content. The increase of fine DO22-Al3Zr dispersoids, Al(FeCr)Si dispersoids and Q′ precipitates in number results in a significant enhancement in strength (both the UTS and yield strength increase by >60 MPa) for the extrusion-T6 when the Fe content increases from 0.168 wt% to 0.356 wt%.
-
(5) Considering industrial applications, the optimal Fe content in the Al–1.6Mg–1.2Si–1.1Cu–0.15Cr–0.15Zr (all in wt%) alloy is 0.35 wt% if the inevitable errors of chemical composition are ignored. It results in a significant improvement in strength (UTS of extrusion-T6 ascending to >500 MPa), and with acceptable cost of ductility (elongation: >12%) which still meets the requirement of most industrial productions. When the Fe content in the alloy increases to 0.6 wt%, the UTS and yield strength of the extrusion-T6 just slightly increase to 520 MPa and 503 MPa respectively, but its elongation undesirably drops down to 10.38%.
ACKNOWLEDGMENTS
This work was financially supported by Beijing Natural Science Foundation (NO. 2164060), the Scientific Research Fundation Project of North China University of Technology and the Training Program Foundation for the Talents by Beijing (NO. 2015000020124G023).