1. Introduction
Alkaline rocks with their distinct geochemical signatures and exotic mineralogy are considered to be an important proxy for unravelling the crust–mantle interaction over geological time (Bailey & Schairer, Reference Bailey and Schairer1966; Bailey, Reference Bailey and Sorensen1974; Mitchell & Platt, Reference Mitchell and Platt1978; Price et al. Reference Price, Johnson, Gray and Frey1985; Platt & Woolley, Reference Platt and Woolley1986; Baker, Reference Baker, Fitton and Upton1987; Dawson, Reference Dawson, Fitton and Upton1987; Edgar, Reference Edgar, Fitton and Upton1987; Fitton, Reference Fitton, Fitton and Upton1987; Menzies, Reference Menzies, Fitton and Upton1987; Zhao et al. Reference Zhao, Shiraishi, Ellis and Sheraton1995; Woolley et al. Reference Woolley, Platt and Eby1996; Burke et al. Reference Burke, Ashwal and Webb2003; Burke & Khan, Reference Burke and Khan2006; Leelanandam et al. Reference Leelanandam, Burke, Ashwal and Webb2006; Upadhyay et al. Reference Upadhyay, Jahn-Awe, Pin, Paquette and Braun2006 a,b,c; Upadhyay & Raith, Reference Upadhyay and Raith2006). Extant information demonstrates that alkaline rocks occur in practically all different tectonic settings, except the mid-oceanic ridges (Zhao et al. Reference Zhao, Shiraishi, Ellis and Sheraton1995). However, there exists a large debate on the petrogenetic processes that are involved in producing alkaline magmas in the mantle. Opinions on the genesis of alkaline magma primarily fall into either of two groups, namely (a) the derivation of alkaline magma from metasomatized mantle enriched in light rare earth elements (LREEs) and large ion lithophile elements (LILEs) (Dawson, Reference Dawson, Fitton and Upton1987; Edgar, Reference Edgar, Fitton and Upton1987) or (b) a low degree of partial melting of the mantle followed by crystal fractionation (Bowen, Reference Bowen1928; Baker, Reference Baker, Fitton and Upton1987). After reviewing the existing information and analysing a comprehensive catalogue of the alkaline rocks of Africa, Woolley, (Reference Woolley2001) opined that alkaline rocks are commonly associated with rifted continental margins. Burke et al. (Reference Burke, Ashwal and Webb2003) adopted a novel approach to trace the location of continental suture zones using deformed alkaline rocks with or without carbonatite (DARs/DARCs). The central theme of the concept seems to originate from the idea that alkaline rocks of the continents are produced in a rift region (extension-dominated process) eventually leading to the formation of an ocean basin. Subsequently, a compression leads to consumption of the oceanic crust and reunites the previously fragmented continental blocks in a continent–continent collision. This latter concept has been supported by many studies (Leelanandam et al. Reference Leelanandam, Burke, Ashwal and Webb2006; Upadhyay & Raith, Reference Upadhyay and Raith2006; Upadhyay et al. Reference Upadhyay, Raith, Mezger, Bhattacharya and Kinny2006 b,c; Upadhyay, Reference Upadhyay2008; Ashwal et al. Reference Ashwal, Patzelt, Schmitz and Burke2016; Ranjan et al. Reference Ranjan, Upadhyay, Abhinay, Pruseth and Nanda2018; Burke et al. Reference Burke, Roberts and Ashwal2007, Reference Burke, Khan and Mart2008), though opinions to the contrary are also published (Upadhyay et al. Reference Upadhyay, Jahn-Awe, Pin, Paquette and Braun2006 a; Das et al. Reference Das, Sanyal, Karmakar, Sengupta and Sengupta2019). Nevertheless, the studies of Woolley (Reference Woolley2001) and Burke et al. (Reference Burke, Ashwal and Webb2003) provide a geodynamic context for the study of DARs/DARCs.
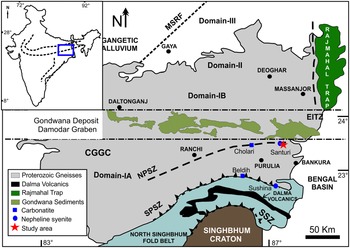
The Chotanagpur Granite Gneissic Complex (CGGC) is traversed by two prominent shear zones. These are (a) the South Purulia Shear Zone (SPSZ) that separates the CGGC from the North Singhbhum Fold Belt of the Singhbhum Craton (Fig. 1) and (b) the North Purulia Shear Zone (NPSZ) that runs through the south-central part of the CGGC (Fig. 1). Both the SPSZ and NPSZ contain occurrences of deformed nepheline syenites and carbonatites (DARCs; Goswami & Bhattacharyya, Reference Goswami and Bhattacharyya2008; Chakrabarty & Sen, Reference Chakrabarty and Sen2010; Goswami & Basu, Reference Goswami and Basu2013; Das et al. Reference Das, Dasgupta, Sanyal, Sengupta, Karmakar and Sengupta2017, Reference Das, Sanyal, Karmakar, Sengupta and Sengupta2019). However, limited precise petrological and geochemical data are available on the deformed nepheline syenites of the NPSZ (reviewed in Das et al. Reference Das, Sanyal, Karmakar, Sengupta and Sengupta2019). Lack of a quality database renders determination of the petrogenesis and geodynamic setting of the intrusion (and subsequent modification) of this important rock type, difficult.
General geological map of the East Indian Shield comprising the Chotanagpur Granite Gneissic Complex (CGGC) in the north, North Singhbhum Fold Belt (NSFB) in the middle and Singhbhum Craton in the south (modified after Acharyya, Reference Acharyya2003). The red star shows the occurrence of the studied nepheline syenite in the southern portion of the Domain-IA of the CGGC. MSRF – Monghyr-Saharsa Ridge Fault; EITZ – Eastern Indian Tectonic Zone; NPSZ – North Purulia Shear Zone; SPSZ – South Purulia Shear Zone; SSZ – Singhbhum Shear Zone. Deformed nepheline syenites and carbonatites of the CGGC are marked as blue coloured circles and squares, respectively.

In this communication, we present field observations and detailed mineralogical and geochemical data of a deformed nepheline syenite from the Kusumdih area of the NPSZ. Integrating all the geological information it is proposed that the magmatic protolith of the studied rock was derived from low-degree partial melting of the subcontinental lithospheric mantle (SCLM) that lay beneath the ∼950 Ma crust of the CGGC. The alkaline magma thus generated underwent fractional crystallization with minimal crustal contamination and produced nepheline syenite that was emplaced in a ‘failed’ rift zone/aulacogen within a time span of ∼950–900 Ma. The geological features of the CGGC support the view that the rift setting in which the magmatic protolith of the studied rock was formed did not evolve into an open ocean basin. A change of tectonic polarity from an extensional to a compressional regime converted the nepheline syenite and the adjoining carbonatite to DARC at ∼900 Ma. Along with the information from the DARs/DARCs, it is proposed that the evolutionary history of the DARs/DARCs can trace the formation and destruction of the ancient supercontinents.
2. Geological background
The study area is a high-grade metamorphic terrane near Saltora, Bankura, which is part of an E–W- to ENE–WSW-trending and very steeply northerly dipping discontinuous crustal-scale high-strain zone, the NPSZ (Goswami & Bhattacharyya, Reference Goswami and Bhattacharyya2010; Karmakar et al. Reference Karmakar, Bose, Sarbadhikari and Das2011; Das et al. Reference Das, Sanyal, Karmakar, Sengupta and Sengupta2019). The NPSZ lies in the southern portion of the CGGC, a Proterozoic sub-arcuate belt of the East Indian Shield (Fig. 1; Mahadevan, Reference Mahadevan2002; Acharyya, Reference Acharyya2003; Sanyal & Sengupta, Reference Sanyal, Sengupta, Mazumder and Saha2012; Mukherjee et al. Reference Mukherjee, Dey, Sanyal, Sengupta and Mukherjee2019 b). Exposed over an area of c. 80 000 km2 in an E–W extent, the CGGC dominantly consists of orthogneisses, migmatites and granites (porphyritic and massive variety), along with metapelitic, calc-silicate and metabasic granulite enclaves and some intrusive rocks (Karmakar et al. Reference Karmakar, Bose, Sarbadhikari and Das2011; Sanyal & Sengupta, Reference Sanyal, Sengupta, Mazumder and Saha2012; Das et al. Reference Das, Dasgupta, Sanyal, Sengupta, Karmakar and Sengupta2017, Reference Das, Sanyal, Karmakar, Sengupta and Sengupta2019; Mukherjee et al. Reference Mukherjee, Dey, Sanyal, Sengupta and Mukherjee2019 b; Dey et al. Reference Dey, Roy Choudhury, Mukherjee, Sanyal and Sengupta2019 a,b). E–W-trending northerly dipping shear foliation is the most dominant fabric in this tectonic zone (Goswami & Bhattacharyya, Reference Goswami and Bhattacharyya2010; Mukherjee et al. Reference Mukherjee, Dey, Sanyal, Sengupta and Mukherjee2019 b).
Owing to complex structural patterns and metamorphic overprinting, the CGGC is recognized as a polydeformed and polymetamorphosed terrane that experienced three major tectonothermal events (M1–M3), recorded in the enclave suite of rocks, host granites and intrusive rocks (Maji et al. Reference Maji, Goon, Bhattacharya, Mishra, Mahato and Bernhardt2008; Sanyal & Sengupta, Reference Sanyal, Sengupta, Mazumder and Saha2012; Mukherjee et al. Reference Mukherjee, Dey, Sanyal, Sengupta and Mukherjee2019 b; Das et al. Reference Das, Sanyal, Karmakar, Sengupta and Sengupta2019). The earliest deformation-metamorphism (M1) is well constrained from the metapelitic enclaves and represented by high-temperature (HT: >850°C) to ultra-high-temperature and moderate-pressure conditions at ∼1650 Ma (Sanyal & Sengupta, Reference Sanyal, Sengupta, Mazumder and Saha2012; Dey et al. Reference Dey, Mukherjee, Sanyal, Ibanez-Mejia, Sengupta and Mazumder2017, Reference Dey, Karmakar, Ibanez-Mejia, Mukherjee, Sanyal and Sengupta2019 b). M2 is the most pervasive metamorphic event affecting the CGGC, evident from different lithological units including the host felsic orthogneisses that occurred under high-pressure granulite-grade conditions at 1100–950 Ma (Maji et al. Reference Maji, Goon, Bhattacharya, Mishra, Mahato and Bernhardt2008; Chatterjee et al. Reference Chatterjee, Banerjee, Bhattacharya and Maji2010; Karmakar et al. Reference Karmakar, Bose, Sarbadhikari and Das2011; Chatterjee & Ghose, Reference Chatterjee and Ghose2011; Rekha et al. Reference Rekha, Upadhyay, Bhattacharya, Kooijman, Goon, Mahato and Pant2011; Mukherjee et al. Reference Mukherjee, Dey, Sanyal, Ibanez-Mejia, Dutta, Sengupta, Pant and Dasgupta2017, Reference Mukherjee, Dey, Sanyal, Ibanez-Mejia and Sengupta2019 a; Dey et al. Reference Dey, Karmakar, Mukherjee, Sanyal and Dutta2019 c). The latest one (M3) is an amphibolite-grade metamorphic event documented from the alkaline rocks and mafic dykes intruding the felsic orthogneiss basement, and took place between ∼920 and 780 Ma (Chatterjee et al. Reference Chatterjee, Banerjee, Bhattacharya and Maji2010; Sanyal & Sengupta, Reference Sanyal, Sengupta, Mazumder and Saha2012; Mukherjee et al. Reference Mukherjee, Dey, Sanyal and Sengupta2018 b; Das et al. Reference Das, Sanyal, Karmakar, Sengupta and Sengupta2019). Among the three major deformational events (D1, D2 and D3) reported in this area, the earliest granulite-facies fabric S1 is isoclinally folded to form the S2 fabric, which together refolded into a set of E–W-closing non-cylindrical D3 folds (Maji et al. Reference Maji, Goon, Bhattacharya, Mishra, Mahato and Bernhardt2008; Rekha et al. Reference Rekha, Upadhyay, Bhattacharya, Kooijman, Goon, Mahato and Pant2011). S3 is the regionally pervasive E–W-trending northerly dipping foliation of the area, defined by an assemblage of biotite ± amphibole. It is a product of syn-shearing metamorphic recrystallization (M3) and has transposed all the earlier fabrics (Karmakar et al. Reference Karmakar, Bose, Sarbadhikari and Das2011; Das et al. Reference Das, Sanyal, Karmakar, Sengupta and Sengupta2019). The interlude period between the D2 and D3 deformations is marked by the intrusion of the alkaline rocks, carbonatite and mafic dykes (Sanyal & Sengupta, Reference Sanyal, Sengupta, Mazumder and Saha2012; Das et al. Reference Das, Dasgupta, Sanyal, Sengupta, Karmakar and Sengupta2017, Reference Das, Sanyal, Karmakar, Sengupta and Sengupta2019; Mukherjee et al. Reference Mukherjee, Dey, Sanyal and Sengupta2018 b, Reference Mukherjee, Dey, Sanyal, Sengupta and Mukherjee2019 b). The alkaline rocks including the nepheline syenite of the Kankarkiari–Santuri area are likely to have been emplaced in the time span of ∼950–900 Ma (Das et al. Reference Das, Sanyal, Karmakar, Sengupta and Sengupta2019). Similar alkaline magmatism has been reported from the southern contact of the CGGC with the SPSZ (intrusion age ∼922 Ma; Fig. 1; Basu, Reference Basu1993, Reference Basu2003; Acharyya et al. Reference Acharyya, Ray, Chaudhuri, Basu, Bhaduri and Sanyal2006; Reddy et al. Reference Reddy, Clarke, Mazumder, Saha and Mazumder2009; Chakrabarty & Sen, Reference Chakrabarty and Sen2010; Goswami & Basu, Reference Goswami and Basu2013; Chakrabarty et al. Reference Chakrabarty, Mitchell, Ren, Saha, Pal, Pruseth and Sen2016; Olierook et al. Reference Olierook, Clark, Reddy, Mazumder, Jourdan and Evans2019).
3. Field relationships
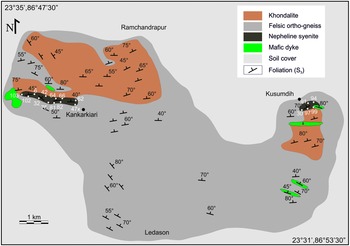
Kusumdih village of Purulia (23.5544° N, 86.8793° E) (Bhaumik et al. Reference Bhaumik, Mukherjee and Bose1990; Goswami & Bhattacharyya, Reference Goswami and Bhattacharyya2008) exposes a hillock of nepheline syenite in an expanse of felsic orthogneisses (FOG). It is situated close to the Purulia–Bankura district boundary (in Domain-IA of the CGGC, according to the divisions of Mukherjee et al. Reference Mukherjee, Dey, Sanyal, Sengupta and Mukherjee2019 b; Fig. 1), ∼8 km NW of Saltora town. It occurs as a contiguous but spatially discontinuous body with the nepheline syenite of Kankarkiari following an almost E–W trend (Fig. 2). Enclaves of khondalite of variable dimensions (a few centimetres to kilometre scale) are scattered randomly within the FOG. The nepheline syenite and mafic dykes are among the younger units of the study area that have intruded this felsic crust by cross-cutting the granulite-grade planar fabric S2 (Das et al. Reference Das, Sanyal, Karmakar, Sengupta and Sengupta2019). S3 is the E–W-trending amphibolite-grade mylonitic fabric that developed in the host FOG as well as in the alkaline rocks and is defined by oriented recrystallized grains of amphibole and biotite.
Simplified litho-structural map showing distribution of alkaline rocks and associated rocks in and around Kankarkiari–Kusumdih village (modified after Das et al. Reference Das, Sanyal, Karmakar, Sengupta and Sengupta2019). The sample locations are indicated in white.

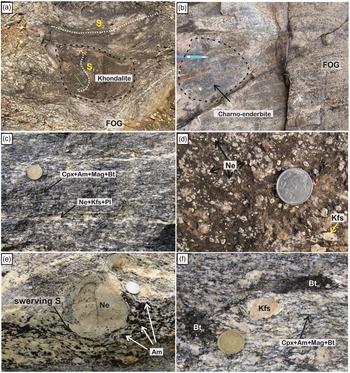
Khondalites are gneissic rocks with alternate bands of greyish white leucosome and dark brown melanosome layers. Leucosomal bands are mainly composed of quartzo-feldspathic minerals heavily sprinkled with reddish brown coloured garnet grains. Melanosome layers contain garnet, sillimanite and biotite. Migmatitic foliation of the FOG (S2) swerves around the enclaves. Migmatitic foliation of the khondalitic enclaves (S1) abuts against the S2 foliation at a high angle and is dragged to parallelism at the contact (Fig. 3a). The FOG shows a migmatitic structure defined by thin to thick leucosomal bands composed mainly of plagioclase and quartz with a subordinate amount of K-feldspar that forms laterally continuous stromatic bands and/or nebular segregations. Melanosomes occur as impersistent dark segregates composed of fine-grained pyroxene, biotite and/or amphibole with occasional garnet. The FOG is interpreted to be retrogressed charno-enderbitic rock as greasy-looking rare patches of the latter occur within the FOG. Additionally, unlike the enclave suite of rocks, these charno-enderbitic patches share a gradational contact and continuous foliation with the host FOG (Fig. 3b). The nepheline syenite of Kusumdih is a dark grey coloured banded rock, completely devoid of quartz. The prominent gneissic banding in the rock is defined by alternate thin, dark, impersistent bands composed of clinopyroxene, amphibole, biotite and magnetite and light bands composed of feldspar and nepheline (Fig. 3c). The grain size of the minerals and mafic content varies from layer to layer providing the rock with an inhomogeneous appearance. Relict porphyritic texture is occasionally preserved in locales with less intense deformation where megacrystic nepheline and K-feldspar grains are set in a finer grained groundmass composed of nepheline and feldspar (Fig. 3d). The S3 foliation swerves past these megacrystic nephelines (Fig. 3e). Locally medium- to fine-grained biotite flakes form randomly oriented clusters suggesting their growth outlasted S3 fabric development (Fig. 3f).
(a) S2 gneissic banding of the host felsic orthogneiss (FOG) swerving around the enclaves of khondalite. S1 foliation of the khondalite enclave abuts against the external S2 foliation at a high angle. (b) Greasy-looking charno-enderbite occurring as a patch in FOG, but with a gradational boundary; continuous S2 foliation can be traced across the boundaries of the two units. (c) Gneissic foliation (S3) in nepheline syenite defined by alternate thin dark, impersistent bands composed of biotite, amphibole and pyroxene and light grey coloured feldspars and nepheline. (d) Megacrystic nepheline and alkali feldspar sprinkled inhomogeneously within a fine-grained groundmass of nepheline-feldspar define relict porphyritic appearance of the rock. (e) The S3 gneissic foliation defined by amphibole and/or biotite is swerving around nepheline porphyroclasts. (f) Secondary shear fabric composed of haphazard biotite grains in the rock.

4. Petrographic description
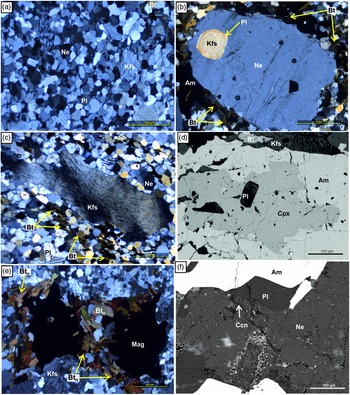
The nepheline syenite of the studied area is a fine- (>0.5 mm diameter) to medium-grained (<4 mm diameter) rock composed of feldspars (both K-feldspar and plagioclase), nepheline, clinopyroxene, amphibole, biotite and magnetite. Calcite, apatite, titanite, ilmenite, cancrinite, zeolite and zircon occur as accessory minerals. The modal content of nepheline varies greatly among the samples (10–35 vol. %); however, nepheline and feldspar constitute ∼50–90 vol. % of the rock. The rock rarely preserves its pristine orthocumulus texture with a local porphyritic appearance. Commonly the rock has a matrix that is composed of fine-grained polygonal aggregates of nepheline, K-feldspar (perthite) and plagioclase in which porphyroclasts of nepheline, K-feldspar (perthite), clinopyroxene and magnetite occur as islands (Fig. 4a, b). The porphyroclasts bear the impression of crystal-plastic deformation, namely undulatory extinction, bending of mineral cleavage traces, stretching of grains with wedge-shaped deformation twin lamellae (in plagioclase) and the formation of sub-grains in feldspars and nepheline (Fig. 4c). Grain boundary recrystallization of K-feldspar, plagioclase and nepheline forms a core–mantle texture (Fig. 4c). A few nepheline porphyroclasts include grains of perthite (Fig. 4b). The proportion of matrix minerals and porphyroclasts is variable even within a metre scale. Other than recrystallized polygonal grains in the matrix, plagioclase feldspar also occurs as granular exsolutions (thin to thick) around perthitic K-feldspar (Fig. 4b, c). Calcite, apatite, titanite and ilmenite occur as polygonal grains in the matrix. Exsolution lamellae of ilmenite are also observed within magnetite. Euhedral zircon grains are very fine in size (0.02–0.03 mm) and variable in modal abundance (mostly less than 5 vol. %). Thin-sections prepared from different layers throughout the whole nepheline syenite body are consistent with the variable modal proportions of amphibole and biotite, as evidenced from field observations. Clinopyroxene, mostly pseudomorphed by amphibole, only occurs as large to small undigested patches within the latter (Fig. 4d). Amphibole and biotite variably replace other pristine phases like magnetite, titanite, feldspars and nepheline, both in the porphyroclastic as well as the matrix modes (Fig. 4d, e).
(a) Intense deformation modified the pristine orthocumulus texture and developed a granoblastic mosaic of fine recrystallized nepheline (Ne), alkali feldspar (Kfs), plagioclase (Pl), clinopyroxene, magnetite, titanite, apatite and calcite grains with polygonal grain margins. (b) S3 foliation defined by oriented grains of biotite (Bt) and amphibole (Am) swerves past spindle-shaped megacrystic nepheline; perthite with an albite rim occurs as an inclusion within the porphyroclast. (c) Lenticular megacrystic perthite records undulose extinction, bending of lamellae, marginal recrystallization and a core–mantle texture. (d) Back-scattered electron image shows oriented grains of amphibole and biotite replacing the magmatic phases (clinopyroxene (Cpx), plagioclase) as a result of metamorphism. (e) Randomly oriented biotite replaces ilmenite (Ilm), magnetite (Mag) and alkali feldspar along the margins. (f) Cancrinite (Ccn) veinlets replace nepheline grains along the fractures and cleavage planes.

Ovoid, lenticular to spindle-shaped megacrystic nepheline and K-feldspar (perthite) phenocrysts with swerving oriented grains of biotite and/or amphibole appear to define a blasto-porphyritic texture set within the recrystallized matrix (Fig. 4b, c). Amphibole and biotite that grew along the S3 fabric of the rock are considered to be the product of metamorphism (Fig. 4b). Biotite occurs in two textural modes: (a) fine-grained flakes oriented along the foliation plane, sometimes showing internal strain (Fig. 4b, c), and (b) medium-grained random flakes replacing magnetite, ilmenite, titanite and K-feldspar along the grain margin (BtH; Fig. 4e). The random orientation of the biotite suggests that its growth outlasted the deformation. Cancrinite, analcite and kaolinite are the alteration phases of nepheline that occur as patches or fine veinlets within nepheline (Fig. 4f). On the basis of textural features, the following sequence of mineral associations are noted:
-
Relict igneous phases: nepheline, K-feldspar, plagioclase, clinopyroxene, magnetite, calcite, apatite, titanite and ilmenite.
-
Metamorphic phases: amphibole and biotite.
-
Low-temperature alteration phases: cancrinite, analcite and kaolinite.
5. Analytical techniques
The chemical composition of mineral phases was measured using a CAMECA SX5 microprobe at the Central Research Facility of the Indian Institute of Technology (Indian School of Mines), Dhanbad, India. For analysis, a 15 kV accelerating voltage and 15 nA beam current, with a beam diameter of ∼1–2 μm was used for all the points. Well-characterized, natural and synthetic compounds were used as standards to calibrate the instruments for the analyses and the raw analyses were corrected with the PAP technique (Pouchou & Pichoir, Reference Pouchou and Pichoir1984). Tabular rock samples (each at least 3 kg in weight) were used to prepare rock-powder for geochemical analyses. Bulk-rock analyses were carried out in the X-Ray Fluorescence laboratory of the National Centre for Earth Science Studies (NCESS), Thiruvananthapuram, Kerala, India. Major-element abundances were analysed by X-ray fluorescence on fused discs using a Bruker model S4 Pioneer sequential wavelength-dispersive X-ray spectrometer. Fused glass discs were prepared by fusing 1 g of finely powdered sample mixed with 5 g of lithium tetra-metaborate flux in a platinum crucible at 1100°C using a Claisse Fluxer. The analytical calibration lines used in the quantification program were produced by bivariate regression of data from certified geochemical reference materials encompassing a wide range of felsic rock compositions. The detection limit of major elements was ∼0.01 %, and analytical precision is always better than 1 %. Precision for trace elements is estimated to be better than 5 % on the basis of repeated analysis of reference rock standards. Standards used for the analyses were G2, GSP2, STM1, SARM1, SARM2, SY3, RGM, GA, GH, GS-N, AC-E, MDOG, ISHG, VS-N, JG-1, JG-2, JG-3, JR-3 and JSY-1. The rare earth element (REE) and trace-element concentration analyses were performed at the Department of Earth Sciences, Indian Institute of Technology, Kanpur, using an Agilent triple quadrupole inductively coupled plasma mass spectrometer (QQQ-ICP-MS) following a collision/reaction technology. Collision cell technology together with MS/MS mode was used to remove spectral interferences. For trace-element analysis, ∼0.5 g of dust laden filters were digested in pre-cleaned Teflon beakers at 130 ± 5°C using a 3:1 mixture of HF and HNO3 for 48 hours. After digestion, the samples were dried and re-dissolved in 1 ml of concentrated HNO3. The acid was then slowly evaporated at 80 ± 5°C, and again, the samples were re-dissolved in 3 ml of Aqua Regia acid (concentrated HNO3 and concentrated HCl in 2:1 ratio). Aqua Regia was fluxed for 24 hours. After the Aqua Regia digestion step, the samples were dried and re-dissolved in 2 % HNO3. The acid digestion steps were only repeated when digestion was incomplete. Six procedural blanks and certified reference materials SBC-1 and AGV-2 were also digested following the same procedures. The blanks were analysed to quantify the total procedural blank, whereas the reference materials were analysed to assess the data quality. Concentrations were determined using a multi-element standard solution (High Purity Standard) diluted to seven appropriate concentrations depending on the signal range of the measured isotope. Added to the samples were 5 ng g−1 of high purity rhodium (Rh) standard as an internal standard, and monitored to assess matrix effects. The instrument was run both in no gas mode and helium gas mode to optimize the separation of measured isotopes from isobaric polyatomic interferences. The final concentrations were blank corrected using the average procedural blank concentrations, and the matrix effect was corrected by Rh normalization. All the elements agreed well with their certified values.
6. Results
6.a. Mineral compositions
Representative analyses of different minerals present in the studied rock are given in Tables 1–7. Abbreviations for the mineral names in the figures and tables have been used after Kretz (Reference Kretz1983). The following section describes salient compositional characteristics of the different minerals.
Representative oxide analyses (wt %) and calculated cations per formula unit of clinopyroxene

Fe3+ recalculated on the basis of stoichiometry.
Zero stands for ‘too low’ values of oxides, measured by EPMA.
Representative oxide analyses (wt %) and calculated cations per formula unit of amphibole

Fe3+ recalculated on the basis of stoichiometry.
Zero stands for ‘too low’ values of oxides, measured by EPMA.
Representative oxide analyses (wt %) and calculated cations per formula unit of biotite

Fe3+ recalculated on the basis of stoichiometry.
Zero stands for ‘too low’ values of oxides, measured by EPMA, whereas NA values are not measured.
Representative oxide analyses (wt %) and calculated cations per formula unit of nepheline

Zero stands for ‘too low’ values of oxides, measured by EPMA.
Concentrations of Ti, Fe, Mn, Mg and P are too low, thereby not provided in the table.
Representative oxide analyses (wt %) and calculated cations per formula unit of feldspars

Zero stands for ‘too low’ values of oxides, measured by EPMA.
Concentrations of Ti, Fe, Mn, Mg and P are too low, thereby not provided in the table.
Representative oxide analyses (wt %) and calculated cations per formula unit of apatite

Zero stands for ‘too low’ values of oxides, measured by EPMA.
Concentrations of Ti, Al, Fe, Mn, Mg and K are too low, thereby not provided in the table.
Representative oxide analyses (wt %) and calculated cations per formula unit of magnetite, ilmenite, titanite and calcite

Fe3+ recalculated on the basis of stoichiometry.
Zero stands for ‘too low’ values of oxides, measured by EPMA, whereas NA values are not measured.
6.a.1. Clinopyroxene
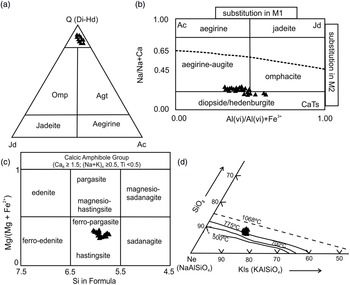
On the acmite–jadeite–quadrilateral pyroxene triangular diagram (Morimoto, Reference Morimoto1988), the compositions of the clinopyroxene are plotted in the quadrilateral pyroxene field forming a continuous array close to the Ac–Q line (Fig. 5a; Table 1). The clinopyroxene is dominated by diopside and hedenbergite molecules (Quad >1.45 mol %) with significant non-quad components including jadeite (0.04–0.1 mol %), aegirine (0.07–0.18 mol %) and Al-tschermakite (0.04–0.07 mol %). XMg (= Mg/Mg + Fe2+) of the clinopyroxene varies between 0.34 and 0.59 with low tetrahedral Al (up to 0.07 atoms per formula unit (apfu)). No significant compositional zoning in terms of XMg was noted in individual grains; however, bigger grains of clinopyroxene (XMg = 0.34–0.40, in sample no. NP42A) are less magnesian compared to the smaller ones (XMg = 0.56–0.59, in sample no. NP47X). On the Na/(Na + Ca) versus AlVI/(AlVI + Fe3+) diagram, the pyroxene compositions straddle the boundary between diopside–hedenbergite and aegirine–augite (Fig. 5b). The Na/(Na + Ca) ratio shows a negative correlation with AlVI/(AlVI + Fe3+) suggesting jadeiitic substitution, presumably during metamorphism (Woolley et al. Reference Woolley, Platt and Eby1996; Upadhyay et al. Reference Upadhyay, Raith, Mezger and Hammerschmidt2006 c).
(a) Clinopyroxene compositions plotted on the Q (quadrilateral pyroxene) – jadeite (Jd) – aegirine (Ac) diagram (Morimoto, Reference Morimoto1988). (b) Clinopyroxene compositions extend across the boundaries between diopside–hedenbergite and aegirine–augite on the Na/(Na + Ca) versus AlVI/(AlVI + Fe3+) atoms per formula unit diagram. (c) Amphibole compositions plot in the field of hastingsite to ferro-pargasite on the Mg number versus Si (apfu) diagram for calcic amphiboles by Leake et al. (Reference Leake, Woolley, Arps, Birch, Gilbert, Grice, Hawthorne, Kato, Kisch, Krivovichev, Linthout, Liard, Mandarino, Maresch, Nickel, Rock, Schumacher, France, Stephenson, Ungaretti, Whittaker and Youzhi1997). (d) Nepheline compositions plotted on the normative nepheline (Ne) – kalsilite (Kls) – silica (Qtz) triangular diagram (Tilley, Reference Tilley1954).

6.a.2. Amphibole
According to the classification scheme of Leake et al. (Reference Leake, Woolley, Arps, Birch, Gilbert, Grice, Hawthorne, Kato, Kisch, Krivovichev, Linthout, Liard, Mandarino, Maresch, Nickel, Rock, Schumacher, France, Stephenson, Ungaretti, Whittaker and Youzhi1997), the amphibole compositions of the studied rock fall in the field of ferro-pargasite to hastingsite of the low Ti (Ti <0.5) calcic group (Fig. 5c; Table 2). XMg of amphibole varies within a restricted range of 0.18–0.21. Individual grains of amphibole do not show any significant compositional zoning. However, owing to Fe–Mg exchange between clinopyroxene and amphibole, amphibole grains at the contact of low-magnesian clinopyroxene show an increase in XMg (0.20–0.21).
6.a.3. Biotite
The biotite compositions vary with the textural type. Relatively smaller grains of biotite at the contact with amphibole that define the planar fabric are more magnesian (XMg = 0.20–0.31) than the relatively larger and randomly oriented biotite grains (nos. 49, 43 and 26 in Table 3) that replace K-feldspar, ilmenite and titanite (XMg up to 0.16). Domainal variation of biotite composition suggests that local equilibrium was achieved with restricted mass transport during the overprinting metamorphism. TiO2 contents of metamorphic biotite (adjacent to amphibole) are high (4.21–4.96 wt %, mean value 4.48 ± 0.2). A few grains replacing ilmenite or titanite have the highest values of TiO2 contents (up to 6.14 wt %), while a few adjacent to K-feldspar have distinctly lower values of TiO2 (2.41–3.72 wt %). High TiO2 bearing biotite at the contact of TiO2-rich minerals is common in metamorphic rocks (Sengupta et al. Reference Sengupta, Dasgupta, Bhattacharya and Mukherjee1990).
6.a.4. Nepheline
Nepheline compositions (end-member components calculated after Deer et al. Reference Deer, Howie and Zussman1962) vary in range Ne69.04–73.13 Kls17.5–19.18 Qtz7.14–10.63 An1.09–1.38, and plotted in a single cluster on the normative nepheline–kalsilite–silica diagram (Fig. 5d; Hamilton, Reference Hamilton1961; Table 4). These nephelines mostly have an excess vacancy in the tetrahedral cation site ((Na + K + 2*Ca)/(Al + Fe3+) ∼ 1); Rossi et al. Reference Rossi, Oberti and Smith1989). No significant compositional zoning was noted in the individual grains. Also, the compositions of porphyroclastic and matrix nephelines were found to be overlapping.
6.a.5. Feldspar
K-feldspar composition is Or79–80 Ab21–23 An0 (Table 5). No compositional variation is noted between the large porphyroclastic and recrystallized varieties of K-feldspar. Plagioclase feldspar shows two compositional groups: (a) the porphyroclastic and the recrystallized polygonal plagioclase grains in the matrix are compositionally oligoclase (Ab88–89 An11–10) and (b) the plagioclase that occurs either as exsolved lamellae or fine veinlets within perthitic K-feldspar or forms a thin rim around K-feldspar and nepheline is albitic (Ab97–99 An3–1; Table 5).
6.a.6. Other phases
Apatite is fluorapatite with F-content ranging between 3.04 and 3.66 wt % (Table 6). The occurrence of fluorapatite in alkaline rocks and carbonatite is common in nature (Liferovich & Mitchell, Reference Liferovich and Mitchell2006).
Magnetite contains up to 2.73 wt % TiO2 (Table 7).
Ilmenite shows significant MnO (up to 5.39 wt %) (Table 7).
Titanite contains up to 1.4 wt % Al2O3 in its structure (Table 7).
Cancrinite, calcite (Table 7), analcite and kaolinite have nearly end-member compositions.
6.b. Major- and trace-element compositions
The representative analyses for whole-rock compositions of the studied rock are listed in Table 8. The following section presents the salient features of the major- and trace-element behaviour of the studied rock.
Representative bulk composition of Kusumdih nepheline syenite

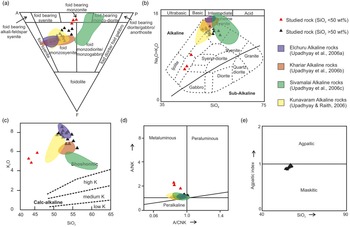
On the F(feldspathoid)–A(alkali feldspar)–P(plagioclase) diagram, most of the studied samples are plotted in the field of ‘foid-monzosyenite’. Only a few data points are plotted in the field of ‘foid-bearing monzonite’ (Fig. 6a; Le Maitre, Reference Le Maitre2002). The studied samples show a higher concentration of total alkalis (Na2O + K2O ∼13 ± 3 wt %), with SiO2 contents ranging between 44 and 57 wt % (∼52 ± 4 wt %; ∼54 ± 1.5 wt % excluding three samples with SiO2 <50 wt %). On the Total Alkali Silica (TAS) diagram, the studied samples cluster in the field of ‘nepheline syenite’, excluding three data points that fall in the field between ‘ijolite’ and ‘gabbro’ (Fig. 6b; Le Bas et al. Reference Le Bas, Le Maitre and Woolley1992). Except for one sample (NP94B), the average K2O/Na2O ratio of the studied rock is close to 1 (∼1.4 ± 0.4, the odd sample has the ratio 3.65). On the K2O versus SiO2 diagram, all the samples are plotted in the ‘shoshonitic’ field (Fig. 6c; Peccerillo & Taylor, Reference Peccerillo and Taylor1976). Owing to the high Al2O3 content (∼21 ± 2 wt %) of the rock, the samples straddle between the fields of ‘metaluminous’ and ‘peralkaline’ rocks on the molar A/NK versus A/CNK bivariate plot (Fig. 6d; Shand, Reference Shand1943). The studied rock is mildly miaskitic with an agpaitic index (molar Na + K/Al) varying in the range of 0.83–0.94 (Fig. 6e).
(a) The studied rock falls in the ‘foid-monzosyenite’ and ‘foid-bearing monzonite’ field on the Feldspathoid – Plagioclase feldspar – Alkali feldspar (FAP) diagram (Le Maitre, Reference Le Maitre2002). (b) The Total Alkali Silica (TAS) diagram suggests that most of the samples are of ‘nepheline syenite’; with some plotting in between the fields of ijolite and gabbro (Le Bas et al. Reference Le Bas, Le Maitre and Woolley1992). (c) The samples plot in the ‘shoshonite’ field on the K2O versus silica diagram (Peccerillo & Taylor, Reference Peccerillo and Taylor1976). (d) The molar A/NK versus A/CNK diagram reveals that the rock samples are ‘metaluminous’ to ‘peralkaline’ in nature (Shand, Reference Shand1943). (e) Samples appear to be slightly miaskitic when plotted on the Agpaitic index (molar Na + K/Al) versus SiO2 plot. Fields for bulk-rock data from other DARs from India (Upadhyay & Raith, Reference Upadhyay and Raith2006; Upadhyay et al. Reference Upadhyay, Jahn-Awe, Pin, Paquette and Braun2006a,b,c) have been included in diagrams (a–d).

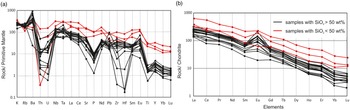
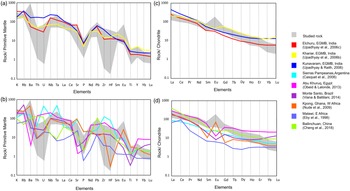
The studied rock is characterized by low concentrations of compatible elements, namely Ni (up to 4 ppm, 10 ppm in one sample (NP102C)), Cr (up to 20 ppm) and Co (up to 60 ppm) and shows highly variable concentrations of the LILEs (e.g. Rb (∼41–164 ppm), Sr (∼129–1963 ppm) and Ba (∼177–6551 ppm)) and moderate to high concentrations of high field strength elements (HFSEs) (e.g. Zr (∼5–601 ppm), Hf (∼0–13 ppm), Nb (∼40–159 ppm) and Ta (∼2–9 ppm)). On the multi-element spidergram, normalized against the primitive mantle (after McDonough & Sun, Reference McDonough and Sun1995), the studied rock shows enriched LILEs and HFSEs (Fig. 7a; enrichment of Ti = 3–5 times, Nb and Ta = 80–110 times, Zr and Hf = 15–60 times, barring three samples with <10 times enrichment). Enriched concentrations of LILEs and HFSEs are characteristics of alkaline rocks around the world (Woolley et al. Reference Woolley, Williams, Wall, Garcia and Moutez1995; Eby et al. Reference Eby, Woolley, Din and Platt1998; Upadhyay & Raith, Reference Upadhyay and Raith2006; Upadhyay et al. Reference Upadhyay, Jahn-Awe, Pin, Paquette and Braun2006 a,b,c). The primitive-mantle normalized multi-element spidergram shows a prominent positive anomaly for Ba, negative anomaly for Ti, Zr, Hf, Th and U, and mildly negative anomaly for Pb in the bulk of the samples. Mean values for the Nb/Ta and Zr/Hf ratios of the samples are close to chondritic values of 17 ± 5 and 42 ± 10, respectively, but with greater scatter (Nb/Ta = 19.9 and Zr/Hf = 34.4; reviewed in Huang et al. Reference Huang, Niu, Zhao, Hei and Zhu2011; Pfander et al. Reference Pfander, Jung, Munker, Stracke and Mezger2012). However, one sample (NP62) has an extremely high Zr/Hf ratio (∼3900), which could be related to the anomalously low Hf content (0.055 ppm) in the sample. The geochemical features of Pb and Ti and the Nb/Ta, Zr/Hf and Th/U (3.6 ± 2) ratios are consistent with a dominant input from a mantle source relative to the continental crust (Upadhyay et al. Reference Upadhyay, Raith, Mezger, Bhattacharya and Kinny2006 b). The average Nb/U ratio (>300) and Ce/Pb ratio (>30) of the samples are much higher as compared to the supra-subduction zone continental crust (Nb/U = 47 ± 10 and Ce/Pb = 25 ± 5; Hofmann et al. Reference Hofmann, Jochum, Seufert and White1986) and also point towards a mantle source. In the chondrite-normalized REE diagram (after McDonough & Sun, Reference McDonough and Sun1995), the studied rock shows strongly fractionated and enriched light rare earth elements (LREE; (La/Lu)N ∼23–87) and a weakly sloping to nearly flat heavy rare earth elements (HREE) pattern (Fig. 7b). In contrast to many reported alkaline rocks (Woolley et al. Reference Woolley, Williams, Wall, Garcia and Moutez1995; Eby et al. Reference Eby, Woolley, Din and Platt1998; Upadhyay et al. Reference Upadhyay, Raith, Mezger, Bhattacharya and Kinny2006 b; Upadhyay & Raith, Reference Upadhyay and Raith2006), the chondrite-normalized REE pattern of the studied rock shows a distinct positive Eu anomaly that is mirrored by high Sr concentrations (Fig. 7b; Upadhyay et al. Reference Upadhyay, Raith, Mezger and Hammerschmidt2006 c). A positive correlation between Eu and Sr is noted (Fig. 8). This can be explained by replacement of Ca in the mineral structure (e.g. plagioclase, clinopyroxene and apatite) by Sr and Eu2+ at low fO2 conditions (discussed in Section 7.b).
(a) Primitive-mantle normalized trace-element spidergram (after McDonough & Sun, Reference McDonough and Sun1995) and (b) chondrite-normalized rare earth element diagram (after McDonough & Sun, Reference McDonough and Sun1995) for the studied rock.

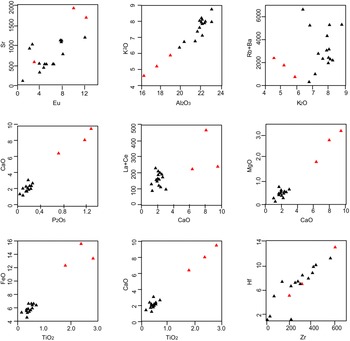
Selected bivariate diagrams and plots showing the trends in major- and trace-element concentrations. Symbols used for the samples are the same as in Figure 6.

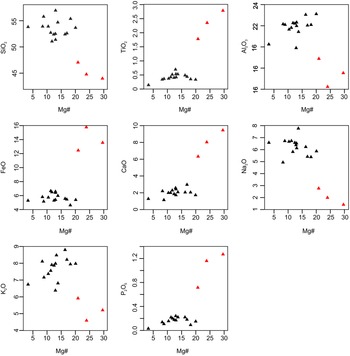
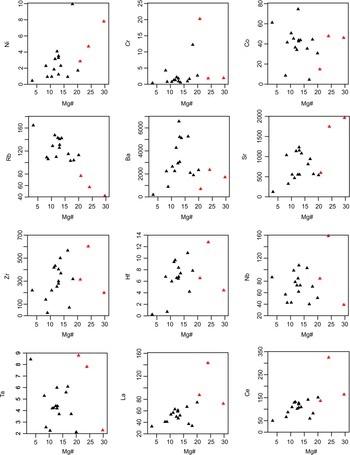
The Mg no. (molar MgO/MgO + FeOt) of the studied rock varies within a reasonably large spread from ∼3 to 30. This raises the possibility that the magmatic protolith of the studied rock could undergo fractional crystallization (reviewed in Rollinson, Reference Rollinson1993). In view of the compositional variation of some metamorphic minerals (e.g. amphibole, biotite) in millimetre size domains (or even less), element mobility during the superposed metamorphism is unlikely to alter the bulk compositions of the large sample used for bulk compositions. Studies have shown that the observed bulk-rock compositions are the end product of various processes including variation of source rock composition, degree of partial melting of the source rock, assimilation and fractional crystallization (reviewed in Philpotts & Ague, Reference Philpotts and Ague2009). Notwithstanding these problems, the compositional variations of the different major and trace elements (including REEs) are shown against the variation in Mg no. (used as a differentiation index; Figs 9, 10). Considering the uncertainties associated with the bivariate plots of rocks, Figure 9 shows a positive correlation of SiO2, TiO2, FeO, CaO and P2O5 and negative correlation of Na2O, whereas Al2O3 and K2O show a scattered plot with respect to Mg no. Such trends are common during magmatic fractionation. There is a strong positive correlation (R2 value = 0.92) between K2O and Al2O3 (Fig. 8). These compositional features that can be attributed to modal variation of K-feldspar in the studied rock due to the presence of K-feldspar cumulates in many samples (Fig. 4c). A large scattering of data on the Rb + Ba versus K2O plot suggests exchange of Rb and Ba between K-feldspar (dominant reservoir of Ba and Rb) and biotite (reservoir of Rb) with local metamorphic fluid (Fig. 8; Imeokparia, Reference Imeokparia1981). A similar process has been documented from the millimetre to centimetre sized charnockitic veins in the amphibolite-facies rocks (the ‘incipient charnockitization’; Newton, Reference Newton1992; Touret et al. Reference Touret, Newton and Cuney2019). CaO and P2O5 also show a strong positive correlation (Fig. 8; R2 ∼0.97). Barring one data point (NP94B that has the highest (La + Ce) = 235 ppm and CaO = 9.45), a distinct positive correlation between CaO and (La + Ce) is noted (R2 ∼0.63). Inclusion of this odd data point reduces the R2 value to ∼0.47 (Fig. 8). Together with the positive correlation of CaO, P2O5, La and Ce with Mg no. (Figs 9, 10), all these compositional features suggest fractionation of apatite, presumably during differentiation of the magmatic protolith. The strong positive correlation between CaO and MgO (R2 ∼0.97) is consistent with fractionation of clinopyroxene, presumably during magmatic differentiation (Fig. 8). Together with the positive correlation of CaO, TiO2 and FeO with Mg no. (Fig. 9), the positive correlation of FeO and CaO with TiO2 (Fig. 8) can be best explained by fractionation of ilmenite and titanite during the magmatic processes. A negative Zr anomaly in the primitive-mantle normalized trace-element spidergram suggests that either zircon, the chief reservoir of Zr, also fractionated early or the source itself was poor in Zr (Fig. 7a). The scatter of Ni, Cr and Co with Mg no. (Fig. 10) suggests that the variation of concentrations of these elements is controlled by variable amounts of magnetite (the reservoir of Ni, Co and Cr) present in different samples.
Variation diagrams of major oxides with concentration of Mg no. (Differentiation Index) showing positive variation trends for SiO2, TiO2, FeO, CaO and P2O5, a negative trend for Na2O and scatter for K2O and Al2O3. Symbols used for the samples are the same as in Figure 6.

Trace-element variation diagrams with concentration of Mg no. (Differentiation Index). Symbols used for the samples are the same as in Figure 6.

Fractionation of clinopyroxene and the accessory phases, e.g. apatite, ilmenite and titanite, during differentiation presumably enriched the residual liquid with SiO2, which is reflected in the positive correlation of Mg no. and SiO2 (Fig. 9). Apatite, ilmenite and titanite are the source of LREEs and HFSEs. Fractionation of these minerals are, therefore, likely to deplete the rocks with these elements. However, like most of the alkaline rocks of the world, the studied rock also shows enrichment of LREEs and HFSEs (Fig. 7a). There exist two possibilities to explain these particular features. These are:
(1) After fractionation of apatite, ilmenite and titanite, the residual melt was still sufficiently enriched in FeO, TiO2, CaO and P2O5 to crystallize these phases. Fractionation of titanite and apatite during early fractionation of alkaline magma has been reported from many places (e.g. Upadhyay et al. Reference Upadhyay, Raith, Mezger and Hammerschmidt2006 c).
(2) The positive correlations of FeO, TiO2, CaO and P2O5 with Mg no. (Fig. 9) are accidental and the variation of CaO–P2O5, TiO2–FeO and CaO–TiO2 (Fig. 8) is controlled by the variation of the abundance of apatite and titanite in different samples.
Though it is difficult to discriminate between the two possibilities, a combination of the two processes seems likely.
7. Discussion
7.a. Formation of the magmatic protolith
Field and petrographic features demonstrate that the studied nepheline syenite is deformed and metamorphosed; hence it can be categorized as a DAR (Burke et al. Reference Burke, Ashwal and Webb2003; Burke & Khan, Reference Burke and Khan2006; Leelanandam et al. Reference Leelanandam, Burke, Ashwal and Webb2006). Tracing the magmatic characters of a suite of deformed and metamorphosed nepheline syenite on the basis of the geochemistry presupposes that the studied rock virtually retains its magmatic chemistry at least at the scale of the sample used for chemical analyses. Studies have shown that unless the rocks are extensively metasomatized or suffer significant melt loss at very high temperatures, mobility of many elements is restricted within a few millimetres (e.g. Chowdhury et al. Reference Chowdhury, Talukdar, Sengupta, Sanyal and Mukhopadhyay2013). The studied rock is not extensively metasomatized; neither is there any evidence of significant melt loss during metamorphism. Grain-scale metasomatism was certainly operative to form metamorphic hydrous minerals. Furthermore, the geochemical data do not support significant crustal contamination at any stage of evolution of the rocks. We therefore presume that the composition of the magmatic protolith of the studied rock did not change significantly at the scale of the hand specimen. Our study, thus, corroborates the view of published work that the magmatic characters are retained in the studied rock (Upadhyay & Raith, Reference Upadhyay and Raith2006; Upadhyay et al. Reference Upadhyay, Raith, Mezger, Bhattacharya and Kinny2006 b,c; Burke et al. Reference Burke, Khan and Mart2008; Ashwal et al. Reference Ashwal, Patzelt, Schmitz and Burke2016; Paul et al. Reference Paul, Chandra and Halder2020).
7.a.1. Geochemical proxy of the studied rock: source characteristics versus crustal contamination
A number of geochemical features, namely, (1) enriched Nb and Ta concentrations, (2) Nb/Ta (17 ± 5) and Zr/Hf (42 ± 10) ratios showing near chondritic values, (3) troughs for U, Th, Pb and Ti on the primitive-mantle normalized multi-element diagram (Fig. 7a) and (4) high values of Nb/U (>300) and Ce/Pb (>30) are consistent with the view that the magmatic protolith of the studied rock was derived from the mantle with insignificant crustal contamination (Upadhyay et al. Reference Upadhyay, Raith, Mezger, Bhattacharya and Kinny2006 b). In addition to these, the highly fractionated REEs ((La/Lu)N = 23–87) and the nearly flat HREEs on the chondrite-normalized diagram (Fig. 7b) suggest that the parental magma of the studied rock was sourced from garnet peridotite in the SCLM (Lucassen et al. Reference Lucassen, Franz, Romer, Schultz, Dulski and Wemmer2007; Aulbach et al. Reference Aulbach, O’Reilly, Griffin and Pearson2008; Pfander et al. Reference Pfander, Jung, Munker, Stracke and Mezger2012; Pagano et al. Reference Pagano, Galliski, Marquez-Zavalía and Colombo2016; Ashwal et al. Reference Ashwal, Patzelt, Schmitz and Burke2016). Correlation among the major oxides and trace elements suggests variable fractionation of apatite, titanite, ilmenite and clinopyroxene from the parental melt of the studied rock (Figs 8, 9, 10; Morbidelli et al. Reference Morbidelli, Gomes, Brotzu, Acquarica, Garbarino, Ruberti and Traversa2000; Zappettini et al. Reference Zappettini, Villar, Hernández and Santos2013). Published information has demonstrated that nepheline syenite magma can be generated from a basanitic melt through fractionation of nepheline and clinopyroxene in the garnet peridotite field of the SCLM, before being emplaced at crustal conditions (Edgar, Reference Edgar, Fitton and Upton1987; Kyle et al. Reference Kyle, Moore and Thirlwall1992; Ablay et al. Reference Ablay, Carroll, Palmer, Marti and Sparks1998; Eby et al. Reference Eby, Woolley, Din and Platt1998; Upadhyay & Raith, Reference Upadhyay and Raith2006; Irving & Green, Reference Irving and Green2008; Zappettini et al. Reference Zappettini, Villar, Hernández and Santos2013; Pagano et al. Reference Pagano, Galliski, Marquez-Zavalía and Colombo2016). Spatially close associations of basanite and nepheline syenite have been noted in many well-studied alkaline complexes (Eby et al. Reference Eby, Woolley, Din and Platt1998; Pfander et al. Reference Pfander, Jung, Munker, Stracke and Mezger2012; Ashwal et al. Reference Ashwal, Patzelt, Schmitz and Burke2016). The presence of a distinct positive Eu anomaly and coupled behaviour of Eu and Sr vouch for low fO2 conditions during magmatic crystallization (Fig. 7b). Lack of evidence for plagioclase fractionation from the early melt is consistent with the fact that the parental melt of the magmatic protolith of the studied rock is likely to be basanitic rather than alkali basalt (Upadhyay & Raith, Reference Upadhyay and Raith2006). In Figure 11, trace and REE patterns of the studied nepheline syenite have been compared with the trace (primitive-mantle normalized) and REE (chondrite-normalized) patterns of a number of well-studied DARs in India and elsewhere in the world (Eby et al. Reference Eby, Woolley, Din and Platt1998; Upadhyay et al. Reference Upadhyay, Raith, Mezger, Bhattacharya and Kinny2006 b,c; Upadhyay & Raith, Reference Upadhyay and Raith2006; Casquet et al. Reference Casquet, Pankhurst, Galindo, Rapela, Fanning, Baldo, Dahlquist, Casado and Colombo2008; Nude et al. Reference Nude, Shervais, Attoh, Vetter and Barton2009; Obeid & Lalonde, Reference Obeid and Lalonde2013; Viana & Battilani, Reference Viana and Battilani2014; Cheng et al. Reference Cheng, Xu, Wei, Yang, Zhang and Zhang2018). Despite the fact that (a) these rocks have different ages and underwent various degrees of fractionation of diverse minerals and assimilation, and (b) there is compositional variation of the SCLM from which the magmatic protoliths of these DARs were sourced, several features that are common between them are noted. These include (a) enriched concentrations of LILEs and HFSEs, (b) peaks for Eu (except the Malawi occurrence) and troughs for U and Th, and (c) highly fractionated chondrite-normalized REE patterns with enriched LREEs and nearly flat HREEs. The trace and REE patterns of the studied rock matches the best with the trace and REE patterns of the nepheline syenite reported from the Indian occurrence at Elchuru, from the Eastern Ghats Mobile Belt (EGMB), and Kpong from Ghana, West Africa (Fig. 11). In all these localities (shown in Fig. 11), the alkaline magmas are considered to be sourced from the low-degree partial melting of metasomatized SCLM in the field of garnet peridotite (see the references in Fig. 11). The low degree of partial melting of deep and enriched SCLM was achieved by adiabatic decompression melting due to extension of the lithosphere including the continental crust (McKenzie, Reference McKenzie1989; Ghiorso et al. Reference Ghiorso, Hirschmann and Reiners2002; Smith & Asimow, Reference Smith and Asimow2005). Extension of the continental lithosphere is common under a continental rift that may or may not lead to the opening up of an ocean basin (reviewed in Ashwal et al. Reference Ashwal, Patzelt, Schmitz and Burke2016; Das et al. Reference Das, Sanyal, Karmakar, Sengupta and Sengupta2019). This observation may explain the restricted occurrence of alkaline rocks and carbonatites (and their metamorphosed equivalents) in extant and extinct continental rift zones (Eby et al. Reference Eby, Woolley, Din and Platt1998; Upadhyay, Reference Upadhyay2008; Ashwal et al. Reference Ashwal, Patzelt, Schmitz and Burke2016; Paul et al. Reference Paul, Chandra and Halder2020). It, therefore, stands to reason that the NPSZ and its DARCs represent an extinct continental rift. On the basis of geochemistry and Pb, Nd, Hf and Sr radioisotopic compositions, different types of mantle reservoirs (high-μ (HIMU), enriched mantle (EM), focal zone (FOZO), deleted mantle (DM), depleted mid-ocean ridge mantle (DMM)) are recognized (reviewed in Castillo, Reference Castillo2016). Depleted mantle is considered to be the dominant component in the SCLM (Ashwal et al. Reference Ashwal, Patzelt, Schmitz and Burke2016).
Primitive-mantle normalized trace-element spidergram for the studied rock compared with (a) the nepheline syenite occurrences in India, and (b) the nepheline syenite occurrences from across the world. Chondrite-normalized rare earth element diagram for the studied rock compared with (c) the nepheline syenite occurrences in India, and (d) the nepheline syenite occurrences from across the world. Average values are plotted for other occurrences, whereas a zone has been marked for the studied rock (Eby et al. Reference Eby, Woolley, Din and Platt1998; Upadhyay & Raith, Reference Upadhyay and Raith2006; Upadhyay et al. Reference Upadhyay, Jahn-Awe, Pin, Paquette and Braun2006a,b,c; Casquet et al. Reference Casquet, Pankhurst, Galindo, Rapela, Fanning, Baldo, Dahlquist, Casado and Colombo2008; Nude et al. Reference Nude, Shervais, Attoh, Vetter and Barton2009; Obeid & Lalonde, Reference Obeid and Lalonde2013; Viana & Battilani, Reference Viana and Battilani2014; Cheng et al. Reference Cheng, Xu, Wei, Yang, Zhang and Zhang2018).

There exists a considerable debate regarding the LILE- and HFSE-rich mantle source for the alkaline rocks and carbonatite (ARCs). The chief views are as follows:
A. Contribution of the sub-lithospheric (asthenospheric) mantle source in the SCLM. Through their detailed study including field relationships, textural observations and exhaustive analyses of geochemistry (including Nd and Pb isotopic data), Prelevic et al. (Reference Prelević, Foley, Cvetković and Romer2004) demonstrated that mixing of a felsic (dacitic) and lamproitic magma can generate LILE-, HFSE- and LREE-enriched melts. Subcontinental sources (mixing of two or more components from HIMU, EM, FOZO, DM, DMM) for the ARC magmas are also supported by Bell & Tilton (Reference Bell and Tilton2001), Bizimis et al. (Reference Bizimis, Salters and Dawson2003) and Bell & Simonetti (Reference Bell and Simonetti2010).
B. Lithospheric mantle source with insignificant contribution from asthenospheric mantle. Early studies on Precambrian ARCs of the Canadian Shield suggested that these rocks had a DM source (Bell & Blenkinsop, Reference Bell and Blenkinsop1987). However, enriched concentrations of HFSEs, Nd and Sr (>50 times relative to DM) in many ARCs and DARCs require one or more additional components that could provide these elements (reviewed in Ashwal et al. Reference Ashwal, Patzelt, Schmitz and Burke2016). With detailed geochemical and isotopic studies on the deformed and undeformed ARCs from Southern Africa, Ashwal et al. (Reference Ashwal, Patzelt, Schmitz and Burke2016) demonstrated that mixing of a small amount of older DARs (<2 %) with DM can explain the geochemical characters of the undeformed younger alkaline rocks. The ARC–DAR link has been demonstrated from different localities of the world including occurrences in Russia, Africa, India and the Grenville Province of the USA (Burke et al. Reference Burke, Ashwal and Webb2003, Reference Burke, Khan and Mart2008; Burke & Khan, Reference Burke and Khan2006; Leelanandam et al. Reference Leelanandam, Burke, Ashwal and Webb2006).
Das et al. (Reference Das, Sanyal, Karmakar, Sengupta and Sengupta2019) suggested that the nepheline syenite in the studied area was emplaced between 950 and 900 Ma. A number of studies have demonstrated that a magmatic arc was formed in the basement of the CGGC (∼2200 Ma model age) between 1720 and 1670 Ma (Mukherjee et al. Reference Mukherjee, Dey, Sanyal, Ibanez-Mejia and Sengupta2019 a,b). Records of magmatism and metamorphism of similar (or older) ages have been recorded from the fold belts that presumably stitched together the Archaean cratons of peninsular India during the formation of the Columbia supercontinent (Rogers & Santosh, Reference Rogers and Santosh2002; Zhang et al. Reference Zhang, Li, Evans, Wu, Li and Dong2012; Sarkar & Schenk, Reference Sarkar and Schenk2016; Sharma et al. Reference Sharma, Kumar, Pankaj, Pandit, Chakrabarti and Rao2019; Olierook et al. Reference Olierook, Clark, Reddy, Mazumder, Jourdan and Evans2019). The Palaeoproterozoic Indian shield subsequently broke up and reassembled in the subsequent supercontinent cycles (Rodinia and Gondwana; reviewed in Meert & Torsvik, Reference Meert and Torsvik2003; Brown, Reference Brown2007; Li et al. Reference Li, Bogdanova, Collins, Davidson, De Waele, Ernst, Fitzsimons, Fuck, Gladkochub, Jacobs, Karlstrom, Lu, Natapov, Pease, Pisarevsky, Thrane and Vernikovsky2008; Bhowmik et al. Reference Bhowmik, Wilde, Bhandari, Pal and Pant2012; Sengupta et al. Reference Sengupta, Raith, Kooijman, Talukdar, Chowdhury, Sanyal, Mezger, Mukhopadhyay, Mazumder and Eriksson2015; Dasgupta et al. Reference Dasgupta, Bose and Das2013 a; Chattopadhyay et al. Reference Chattopadhyay, Upadhyay, Nanda, Mezger, Pruseth and Berndt2015; Olierook et al. Reference Olierook, Clark, Reddy, Mazumder, Jourdan and Evans2019). The Indian shield including the CGGC has been punctured by multiple phases of alkaline magmatism with or without carbonatite (reviewed in Paul et al. Reference Paul, Chandra and Halder2020) and kimberlite/lamproite/lamprophyre (reviewed in Chalapathi Rao et al. Reference Chalapathi Rao, Gibson, Pyle and Dickin2004, Reference Chalapathi Rao, Wu, Srinivas, Mazumder and Saha2012, Reference Chalapathi Rao, Giri and Pandey2020; Rao et al. Reference Rao, Kumar, Sahoo, Nanda, Chahong, Lehmann and Rao2016; Sharma et al. Reference Sharma, Kumar, Pankaj, Pandit, Chakrabarti and Rao2019) that spread over a long stretch of time after the formation of the Indian shield as a part of the Columbia supercontinent. Geochemical and radiogenic isotope data from >1000 Ma kimberlite/lamproite/lamprophyre and the entrained perovskite support the existence of a metasomatized SCLM where DM was the chief component with variable contributions from the asthenospheric mantle (Rao et al. Reference Rao, Kumar, Sahoo, Nanda, Chahong, Lehmann and Rao2016; Sharma et al. Reference Sharma, Kumar, Pankaj, Pandit, Chakrabarti and Rao2019).
The Palaeoproterozoic basement of the CGGC underwent rifting that outpoured huge felsic magmas at ∼1450 Ma (reviewed in Mukherjee et al. Reference Mukherjee, Dey, Ibanez-Mejia, Sanyal and Sengupta2018 a). During ∼1000–950 Ma, these voluminous felsic magmas and the Palaeoproterozoic basement were buried to deep crustal levels, in a continent–continent collisional setting (∼10–13 kbar; Mukherjee et al. Reference Mukherjee, Dey, Sanyal, Ibanez-Mejia, Dutta, Sengupta, Pant and Dasgupta2017; Dey et al. Reference Dey, Karmakar, Ibanez-Mejia, Mukherjee, Sanyal and Sengupta2019 b,c). An association of felsic magma and nepheline syenite has been reported from many rift settings (Eby et al. Reference Eby, Woolley, Din and Platt1998; Ahmed et al. Reference Ahmed, Ma, Wang, Palinkaš, Girei, Zhu and Habib2018). Although no older DARC (>950 Ma) is hitherto reported from the CGGC, the possibility that the Grenvillian (or older) orogenesis in the CGGC transported >950 Ma old DARCs to the deep mantle cannot be ruled out. Transport of DARCs deep into the mantle has been advocated in many studies and is considered as an important source of carbon in the deep mantle (Burke & Khan, Reference Burke and Khan2006; Burke et al. Reference Burke, Khan and Mart2008; Ashwal et al. Reference Ashwal, Patzelt, Schmitz and Burke2016; Castillo, Reference Castillo2016). In view of the foregoing analysis it is likely that the LILE- and HFSE-rich magmatic protolith of the studied nepheline syenite could originate through a low degree of partial melting of an SCLM containing relicts of older DAR/DARC. However, in addition to older DARCs, the SCLM beneath the >950 Ma crust of the CGGC could also have received contributions from other sources (e.g. from fluid derived from the subducted oceanic crust (Castillo, Reference Castillo2016) or a mixture of HIMU and EM1 (Eby et al. Reference Eby, Woolley, Din and Platt1998) or metasomatism of SCLM by carbonate–silicate melt generated at >200 km mantle depth (Dasgupta et al. Reference Dasgupta, Mallik, Tsuno, Withers, Hirth and Hirschmann2013 b)). More studies on the DARCs of the CGGC may address the relative contributions of the different metasomatizing processes that shaped the compositions of the SCLM beneath the CGGC crust before 950 Ma.
7.b. Physical condition of alkaline magmatism
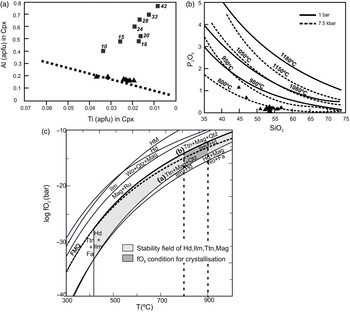
In the nepheline–kalsilite–silica system (Hamilton, Reference Hamilton1961; Tilley, Reference Tilley1954), as mentioned earlier, nephelines of the studied rock with lower normative nepheline and higher silica content is plotted within the temperature range bracketed by 750°C and 950°C (at 1 kbar; Fig. 5d). The approximate pressure of crystallization estimated from the Al and Ti contents of the clinopyroxene from the alkaline magma is below 10 kbar (Fig. 12a; Thompson, Reference Thompson1974). Similar temperatures are also recorded from apatite saturation thermometry where temperatures between 750 and 900°C are recorded (Fig. 12b; Green & Watson, Reference Green and Watson1982). Despite the fact that some magmatic nepheline and apatite could undergo recrystallization during deformation and metamorphism, temperatures of ∼800–900°C can be treated as the magmatic temperature at which the magmatic protolith of the studied nepheline syenite was crystallized. A similar crystallization temperature has been encountered for the Cerro Sarambí alkaline complex of NE Paraguay (Gomes et al. Reference Gomes, Velázquez, Azzone and Paula2011).
(a) Al and Ti content of the clinopyroxene, which suggest the crystallizing pressure of the clinopyroxene from the studied rock was below 10 kbar (Thompson, Reference Thompson1974). The squares represent the experimental pressures in terms of Ti and Al content of clinopyroxene. (b) Apatite saturation temperature gives an estimate of the near liquidus temperature for the alkaline magma of 900°C (Green & Watson, Reference Green and Watson1982). (c) log fO2 versus temperature diagram in the activity constrained CFTSO system indicates low oxygen fugacity conditions for the crystallization of the alkaline magma, below the FMQ buffer, within the stability field of hedenbergite, ilmenite, titanite and magnetite (Wones, Reference Wones1989; Lindsley, Reference Lindsley1991).

The fO2 condition during magmatic crystallization of the protolith of the studied rock was calculated using the stability of the hedenbergite (clinopyroxene) + ilmenite + titanite + magnetite assemblage on the log fO2 versus T diagram (Fig. 12c). The estimated magmatic temperatures (800–900°C) and the measured compositions of the minerals were used for this computation. Owing to slow diffusion of Fe and Mg in clinopyroxene structure, the magmatic pyroxenes (of larger grain size) are unlikely to reset during metamorphism (Chakraborty & Ganguly, Reference Chakraborty, Ganguly and Ganguly1991). The different fO2 buffers shown in Figure 12c are calibrated in the CaO–FeO–TiO2–SiO2–O2 (CFTSO) system (Wones, Reference Wones1989; Lindsley, Reference Lindsley1991). The clinopyroxene of the studied rock has significant MgO contents in its structure (XMg up to 0.4). Since ilmenite, magnetite and titanite have minimal non-CFTSO components, the presence of MgO will increase the stability of the assemblage ilmenite + hedenbergite by pushing the reaction ilmenite + hedenbergite + O2 → magnetite + titanite + quartz to higher fO2 values following the principles of chemical thermodynamics. The end-member reaction and the reaction line corrected for clinopyroxene activity are shown in Figure 12c as reactions (a) and (b), respectively.
At the estimated magmatic temperature of 800–900°C (Fig. 12b), the assemblage ilmenite–hedenbergite–titanite–magnetite in the studied rock constrains low fO2 conditions that vary within 10−12 bars (at 900°C) to 10−17 bars (at 800°C) (Fig. 12c; Wones, Reference Wones1989; Lindsley, Reference Lindsley1991). The estimated fO2 value is low as it falls close to or below the fO2 values obtained from the FMQ (fayalite–magnetite–quartz) buffer at the same temperature range (shown as a stippled line in Fig. 12c). The low fO2 at the time of magmatic crystallization was consistent with the observation that Eu in the studied rock was in the Eu2+ state and replaced Ca2+ in Ca-bearing phases including clinopyroxene. This explains the positive Eu anomaly shown in Figure 7a. This low oxygen fugacity condition is analogous with the nepheline syenite of the Coldwell complex, Ontario (fO2 = 10−14 – 10−19 bars; Mitchell & Platt, Reference Mitchell and Platt1982).
7.c. A tectonic model for the evolution of the DAR of the studied area
Collating all the geological information, an attempt has been made to trace the evolution of the studied nepheline syenite. It has been mentioned earlier that three so far reported occurrences of alkaline rocks (including this study) and two occurrences of carbonatite are located along two prominent shear zones, the NPSZ and SPSZ, in the CGGC (Fig. 1; Bhaumik et al. Reference Bhaumik, Mukherjee and Bose1990; Basu, Reference Basu1993, Reference Basu2003; Acharyya et al. Reference Acharyya, Ray, Chaudhuri, Basu, Bhaduri and Sanyal2006; Goswami & Bhattacharyya, Reference Goswami and Bhattacharyya2008; Goswami & Basu, Reference Goswami and Basu2013; Chakrabarty et al. Reference Chakrabarty, Mitchell, Ren, Saha, Pal, Pruseth and Sen2016; Das et al. Reference Das, Dasgupta, Sanyal, Sengupta, Karmakar and Sengupta2017, Reference Das, Sanyal, Karmakar, Sengupta and Sengupta2019; Paul et al. Reference Paul, Chandra and Halder2020). These alkaline rocks and carbonatite share features that signify that the magmatic protoliths of these rocks were emplaced within the granulite crust of the CGGC (in the NPSZ and part of the SPSZ) and were subsequently deformed and metamorphosed. The present study does not provide any direct constraints on the timing of intrusion of the magmatic protolith and the superimposed deformation and metamorphism. Nevertheless, a large geochronological dataset suggests that the rocks of the CGGC underwent high-temperature granulite-grade metamorphism and developed a strong metamorphic fabric (S2) during the Grenvillian orogeny (∼1000–950 Ma; Chatterjee et al. Reference Chatterjee, Crowley and Ghose2008, Reference Chatterjee, Banerjee, Bhattacharya and Maji2010; Maji et al. Reference Maji, Goon, Bhattacharya, Mishra, Mahato and Bernhardt2008; Karmakar et al. Reference Karmakar, Bose, Sarbadhikari and Das2011; Rekha et al. Reference Rekha, Upadhyay, Bhattacharya, Kooijman, Goon, Mahato and Pant2011; Sanyal & Sengupta, Reference Sanyal, Sengupta, Mazumder and Saha2012; Mukherjee et al. Reference Mukherjee, Dey, Sanyal, Ibanez-Mejia, Dutta, Sengupta, Pant and Dasgupta2017, Reference Mukherjee, Dey, Sanyal, Sengupta and Mukherjee2019 b; Chakraborty et al. Reference Chakraborty, Ray, Chatterjee, Deb and Das2019; Dey et al. Reference Dey, Roy Choudhury, Mukherjee, Sanyal and Sengupta2019 a,c). Field studies suggest that the magmatic protolith of the studied nepheline syenite cuts across this S2 fabric of the Grenvillian metamorphites and hence is coeval with the mafic dykes that occurred in different parts of the NPSZ and SPSZ (Reddy et al. Reference Reddy, Clarke, Mazumder, Saha and Mazumder2009; Mukherjee et al. Reference Mukherjee, Dey, Sanyal and Sengupta2018 b; Das et al. Reference Das, Sanyal, Karmakar, Sengupta and Sengupta2019). The magmatic protolith of the studied nepheline syenite and the mafic dykes underwent deformation (produced the regional S3 fabric), accompanied by amphibolite-facies metamorphism (occurred at conditions of 690–770°C and ∼9–10 kbar) at ∼900 Ma (Mukherjee et al. Reference Mukherjee, Dey, Sanyal and Sengupta2018 b; Das et al. Reference Das, Sanyal, Karmakar, Sengupta and Sengupta2019). In view of this information, it seems likely that the magmatic protolith of the studied nepheline syenite was emplaced between 950 and 900 Ma. This age bracket is consistent with the U–Pb zircon date of ∼922 Ma from the nepheline syenite of the SPSZ (Reddy et al. Reference Reddy, Clarke, Mazumder, Saha and Mazumder2009). It is now generally accepted that DARs/DARCs represent a change of tectonic polarity from an extensional to compressional regime when the ARs/ARCs are formed and converted to DARs/DARCs, respectively (Burke et al. Reference Burke, Ashwal and Webb2003; Burke & Khan, Reference Burke and Khan2006; Leelanandam et al. Reference Leelanandam, Burke, Ashwal and Webb2006; Ashwal et al. Reference Ashwal, Armstrong, Roberts, Schmitz, Corfu, Hetherington, Burke and Gerber2007; Upadhyay, Reference Upadhyay2008).
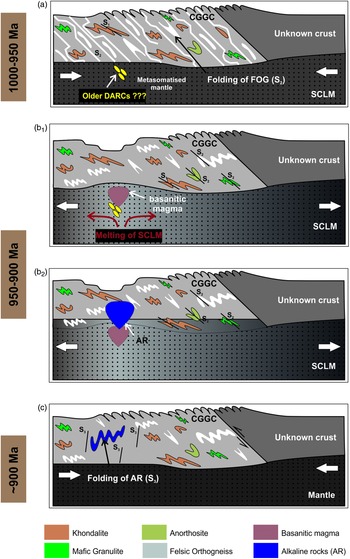
Figure 13 presents an evolutionary model for the deformed nepheline syenite of the studied area based on the geological information presented in the earlier sections. The evolutionary history begins with the formation of the high-grade rocks and the accompanying S2 fabric during the 1000–950 Ma continent–continent collisional event (Fig. 13a). The SCLM beneath the CGGC was metasomatized and possibly contained patches of older DARs/DARCs as a consequence of Grenvillian (or older) orogenesis. During ∼950–900 Ma, the Grenvillian basement and the SCLM beneath, were extended and rifted presumably due to upwarping of the subcontinental lithosphere (Fig. 13b1). As a consequence, a low degree of partial melting of the garnet peridotite in the SCLM generated basanitic melt (Fig. 13b1) that upon fractionation of clinopyroxene, apatite, ilmenite and titanite produced nepheline syenite magma, which intruded the Grenvillian basement of the CGGC along the NPSZ (Fig. 13b2). No discordance in terms of continuity of lithology, grade and age of metamorphism were noted across the NPSZ. Neither does the NPSZ expose any high-pressure mafic granulite. It is, therefore, likely that the continental rift in which the magmatic protolith of the studied rock and the adjoining carbonatite were emplaced did not evolve into an open ocean basin. We presume that the NPSZ with its alkaline rocks and carbonatite represents a ‘failed’ rift, similar to the east African rift zone. A change in tectonic polarity from an extensional to a compressional regime presumably in a continent–continent collisional setting deformed (generation of the regional S3 fabric) and metamorphosed the high-grade gneissic rocks of the CGGC including the alkaline rocks and carbonatite at ∼900 Ma (Fig. 13c; Mukherjee et al. Reference Mukherjee, Dey, Sanyal and Sengupta2018 b; Das et al. Reference Das, Sanyal, Karmakar, Sengupta and Sengupta2019). Our study corroborates the view of Burke et al. (Reference Burke, Ashwal and Webb2003) that DARs/DARCs represent extensional and compressional phases of the ‘Wilsonian cycle’. However, the extensional phase may or may not lead to opening of an ocean basin (as in case of CGGC); thus the DARCs along the NPSZ should not be treated as a marker for tracing ancient terrane boundaries.
Schematic diagram of the evolutionary model illustrating the petrogenesis of the studied deformed nepheline syenite showing the (a) formation of the high-grade rocks with the prominent S2 fabric in a continent–continent collision at 1000–950 Ma. (b1) Generation of a basanitic magma by low-degree partial melting of sub-continental lithospheric mantle (SCLM, compositionally garnet peridotite) in a continental rift setting. (b2) Further crystal fractionation of clinopyroxene, apatite, ilmenite, titanite and zircon produced the nepheline syenite (blue) magma that was emplaced in the crust at 950–900 Ma. (c) Rifting failed and the nepheline syenite along with the basement it includes was deformed and metamorphosed in another continent–continent collision at ∼900 Ma.

7.d. Significance of the studied DARs in the context of the supercontinent cycle
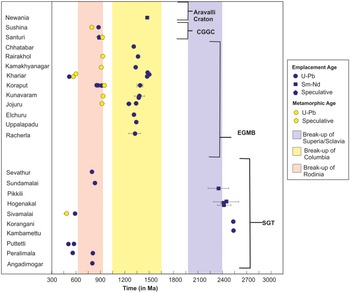
It is now generally accepted that the Proterozoic Eon witnessed four major supercontinent cycles including the Superia (Sclavia), Columbia (Nuna), Rodinia and Gondwana (Brown, Reference Brown2007). Extensive geochronological studies on the rocks of these supercontinents put reasonably tight constraints on the formation and breakdown phases of each of these supercontinents (Fig. 14). Paul et al. (Reference Paul, Chandra and Halder2020), in their exhaustive analyses of published data on the Indian DARs/DARCs, compiled the ages of emplacement of the magmatic protoliths and the metamorphism of these rocks. We have plotted these data in Figure 14 using the following filters: (1) Only the dates that are based on U–Pb and Sm–Nd systematics are considered; this will ensure interpretation of the DARs/DARCs in the context of supercontinent cycles. (2) The age data of a few DARs/DARCs are revised in recent studies. These changes have been accommodated. The inferred age range of the DARCs in the NPSZ are also included (Das et al. Reference Das, Sanyal, Karmakar, Sengupta and Sengupta2019).
Emplacement and metamorphic ages of Proterozoic alkaline rocks and carbonatites of India showing relationship of their emplacement and metamorphism with major supercontinent cycles. Detailed information on these localities is given in Paul et al. (Reference Paul, Chandra and Halder2020).

Corroborating the view of Burke et al. (Reference Burke, Ashwal and Webb2003), emplacement ages of the magmatic protoliths of practically all the DARs/DARCs coincide with the phases of supercontinent breakdown (Fig. 14). A preponderance of ARs/ARCs during the phase of breakdown of the Columbia supercontinent covering the Aravalli Craton, the Palaeoproterozoic part of the Eastern Ghats Belt, Dharwar Craton, to the Archaean Rengali Province raises the possibility that a large part of the Indian shield formed a coherent block during the formation of the Columbia supercontinent and subsequently rifted with or without the formation of an open ocean basin during Mesoproterozoic time (Fig. 14). The magmatic emplacement age of some DARs/DARCs from Koraput and Purulia (NPSZ and SPSZ) postdate the major phases of the Grenvillian orogeny (∼1000–950 Ma). Mukherjee et al. (Reference Mukherjee, Dey, Sanyal and Sengupta2018 b) showed that both India and east Antarctica (Rayner Complex), which share the ∼1000–950 Ma high-grade metamorphism, preserve phases of extension between ∼950 and 920 Ma. Subsequently, the Indo-Antarctic land mass witnessed another phase of continent–continent collision at ∼920–900 Ma (Maji et al. Reference Maji, Goon, Bhattacharya, Mishra, Mahato and Bernhardt2008; Karmakar et al. Reference Karmakar, Bose, Sarbadhikari and Das2011; Sanyal & Sengupta, Reference Sanyal, Sengupta, Mazumder and Saha2012; Chatterjee, Reference Chatterjee2018; Mukherjee et al. Reference Mukherjee, Dey, Sanyal and Sengupta2018 b, Reference Mukherjee, Dey, Sanyal, Sengupta and Mukherjee2019 b; Das et al. Reference Das, Sanyal, Karmakar, Sengupta and Sengupta2019; Dey et al. Reference Dey, Karmakar, Ibanez-Mejia, Mukherjee, Sanyal and Sengupta2019 b; Olierook et al. Reference Olierook, Clark, Reddy, Mazumder, Jourdan and Evans2019). Similar metamorphic ages are also recorded in the DARCs and the adjoining ∼1000–950 Ma basement of Purulia (Paul et al. Reference Paul, Chandra and Halder2020 and references therein). Figure 14 demonstrates that all the metamorphic ages of the Indian DARs/DARCs coincide with the formation of the Proterozoic supercontinents. In view of the foregoing analyses, we are of the view that detailed study of the DARs/DARCs is extremely important not only to demonstrate the ‘Wilsonian cycle’ but also to trace the supercontinental cycles.
8. Conclusions
The main results of our study lead to the following conclusions:
-
(a) The ∼1000–950 Ma old granulite-grade gneissic basement in the southern segment of the CGGC developed a rift zone now marked by the NPSZ during the period of 950–900 Ma.
-
(b) As a consequence of rifting, the metasomatized garnet peridotite of the SCLM beneath the CGGC underwent partial melting, presumably in response to the lithospheric extension.
-
(c) The low degree of partial melting of the SCLM produced a basanitic melt that upon fractional crystallization of clinopyroxene, ilmenite, apatite and titanite led to the generation of the studied nepheline syenite magma.
-
(d) Nepheline syenite magma eventually emplaced in the rift zone in the CGGC at ∼800–900°C, a mid crustal depth and low fO2 conditions (below FMQ).
-
(e) Extant geological information is consistent with the view that the rifting did not eventually lead to an open ocean and hence is a ‘failed’ rift.
-
(f) Subsequently, the CGGC with its nepheline syenite and carbonatite was buried under a continental block in a continent–continent collisional setting at ∼900 Ma.
-
(g) This study corroborates the view that the Indian shield and the granulites of east Antarctica (Rayner Complex) shared a common geological history with two phases of continent–continent collisional events at ∼1000–950 Ma and 920–900 Ma that are punctuated by a phase of crustal extension. The extension and compression cycle led to the formation of the DARCs of the NPSZ during the time span of ∼950–900 Ma.
Acknowledgements
SD acknowledges the University Grant Commission (UGC), New Delhi for financial support. SS, SK and PS acknowledge the grants awarded to the Department of Geological Sciences, Jadavpur University: Centre of Advanced Study (CAS–Phase VI), JU RUSA (Rashtriya Uchchattar Shiksha Abhiyan) 2.0 and Board of Research in Nuclear Sciences–Department of Atomic Energy (BRNS-DAE) sponsored project (Sanction No. 36(5)/14/44/2014-BRNS/1301). DS and BP appreciate financial support from the Board of Research in Nuclear Sciences–Department of Atomic Energy (BRNS-DAE). SRC acknowledges the Council of Scientific and Industrial Research (CSIR), New Delhi and Board of Research in Nuclear Sciences–Department of Atomic Energy (BRNS-DAE) for financial support. We genuinely appreciate the editor Dr Tim Johnson for editorial handling of the manuscript and also acknowledge the support he has extended for submission of the revised work. We heartily acknowledge the anonymous reviewers for their incisive reviews and extremely constructive comments that certainly helped us a lot in revising the work and improved the clarity of the manuscript. We also thank Mr Mohai Menul Hasan for his contribution during fieldwork.