Important developmental changes in brain structure occur during middle childhood (Gogtay et al., Reference Gogtay, Giedd, Lusk, Hayashi, Greenstein, Vaituzis and Thompson2004; Lange, Reference Lange2012; Marsh, Gerber, & Peterson, Reference Marsh, Gerber and Peterson2008; Mills et al., Reference Mills, Goddings, Herting, Meuwese, Blakemore, Crone and Tamnes2016). These changes coincide with the emergence of mental health problems, such as anxiety and depression (Beesdo, Knappe, & Pine, Reference Beesdo, Knappe and Pine2009). Structural magnetic resonance imaging (MRI) studies have found cortical thickness (CT) and cortical surface area (SA) alterations that corresponded to clinically significant symptoms (Drevets, Price, & Furey, Reference Drevets, Price and Furey2008; Ducharme et al., Reference Ducharme, Albaugh, Hudziak, Botteron, Nguyen, Truong and Karama2014; Feurer et al., Reference Feurer, Suor, Jimmy, Klumpp, Monk, Phan and Burkhouse2020; Newman et al., Reference Newman, Thompson, Bartsch, Hagler, Chen, Brown and Jernigan2016). However, the direction of change – thinner versus thicker CT or reduced versus increased SA – has been inconsistent across studies, with opposite outcomes across some. A possible confound is that many studies do not assess the nature and quality of parenting experiences and therefore fail to account for the context in which symptoms develop (e.g., see Ducharme et al., Reference Ducharme, Albaugh, Hudziak, Botteron, Nguyen, Truong and Karama2014; Gold et al., Reference Gold, Steuber, White, Pacheco, Sachs, Pagliaccio and Pine2017).
The early caregiving environment plays a critical role in children's brain development and susceptibility to mental health problems (Cicchetti, Reference Cicchetti2016; McLaughlin, Weissman, & Bitrán, Reference McLaughlin, Weissman and Bitrán2019). Preliminary evidence suggests that the parenting context uniquely shapes the neural correlates of anxious symptoms (La Buissonnière-Ariza et al., Reference La Buissonnière-Ariza, Séguin, Nassim, Boivin, Pine, Lepore and Maheu2019), despite the fact that distinct childhood experiences can lead to similar presenting symptoms – a phenomenon known as equifinality (Cicchetti & Rogosch, Reference Cicchetti and Rogosch1996). Of note, La Buissonnière-Ariza et al. (Reference La Buissonnière-Ariza, Séguin, Nassim, Boivin, Pine, Lepore and Maheu2019) have found that in the context of high versus low harsh parenting, unique functional connectivity (FC) patterns predicted fewer versus higher anxious symptoms. The authors interpreted these findings as adaptations to unique environmental demands that are associated with increased vulnerability to anxiety. Overall, initial steps have been taken to explore the FC patterns associated with anxiety in high- and low-risk parenting context, but little is known about whether the rearing context moderates the morphological correlates of anxious symptoms.
To further our understanding of how the quality of the early parenting context shapes the neurobiological correlates of anxious/depressive (A/D) phenotypes, in this cross-sectional study we explored the CT and SA outcomes of a community sample of children at risk for receiving inadequate care and children without known risk for inadequate care during middle childhood. By directly comparing these groups, this study sought to identify multiple neural pathways leading to A/D symptoms and test the hypothesis that the quality of the early caregiving context, despite social determinants that may differ between groups of children at high versus low risk of experiencing early insensitive care, can distinctly shape the morphological variations seen among children with A/D symptoms.
Early Adversities, Brain Development, and Mental Health Outcomes
The early years of brain development are characterized by profound structural and functional transformations. During the first two years of life the brain doubles in size with regionally heterogenous developmental patterns (Dobbing & Sands, Reference Dobbing and Sands1973; Lenroot & Giedd, Reference Lenroot and Giedd2006; Li et al., Reference Li, Wang, Yap, Wang, Wu, Meng and Shen2019; Stiles & Jernigan, Reference Stiles and Jernigan2010), and is more sensitive to environmental stimuli than in later years (Tierney & Nelson, Reference Tierney and Nelson2009). Neural growth occurs in an interpersonal context, where the quality and nature of caregiving practices play a critical role in shaping this change (Cicchetti & Curtis, Reference Cicchetti, Curtis, Cicchetti and Cohen2006; Newman, Sivaratnam, & Komiti, Reference Newman, Sivaratnam and Komiti2015). Growing evidence suggests that even normative variability in the quality of caregiving (e.g., parental sensitivity) during infancy is associated with measurable alterations in brain morphology both during infancy (Rifkin-Graboi et al., Reference Rifkin-Graboi, Kong, Sim, Sanmugam, Broekman, Chen and Qiu2015) and prospectively during middle childhood (Kok et al., Reference Kok, Thijssen, Bakermans-Kranenburg, Jaddoe, Verhulst, White and Tiemeier2015). More severe forms of malevolent care, such as abuse or neglect, alter children's structural and functional brain development (Callaghan & Tottenham, Reference Callaghan and Tottenham2016b), as indicated by abnormalities in white matter tract integrity (Choi, Jeong, Polcari, Rohan, & Teicher, Reference Choi, Jeong, Polcari, Rohan and Teicher2012; Hanson et al., Reference Hanson, Adluru, Chung, Alexander, Davidson and Pollak2013; Huang, Gundapuneedi, & Rao, Reference Huang, Gundapuneedi and Rao2012), altered FC in the fronto-limbic system (Gee et al., Reference Gee, Humphreys, Flannery, Goff, Telzer, Shapiro and Tottenham2013; Herringa et al., Reference Herringa, Birn, Ruttle, Burghy, Stodola, Davidson and Essex2013; Jedd et al., Reference Jedd, Hunt, Cicchetti, Hunt, Cowell, Rogosch and Thomas2015), reduced neuroplasticity (Callaghan & Tottenham, Reference Callaghan and Tottenham2016a), increased or atrophied dendritic arborization (Bennett & Diamond, Reference Bennett and Diamond1996; Bennett, Rosenzweig, Diamond, Morimoto, & Hebert, Reference Bennett, Rosenzweig, Diamond, Morimoto and Hebert1974; Molet et al., Reference Molet, Maras, Kinney-Lang, Harris, Rashid, Ivy and Baram2016), and gray matter reduction (De Brito et al., Reference De Brito, Viding, Sebastian, Kelly, Mechelli, Maris and McCrory2013; Lim, Radua, & Rubia, Reference Lim, Radua and Rubia2014; Mehta et al., Reference Mehta, Golembo, Nosarti, Colvert, Mota, Williams and Sonuga-Barke2009; Tozzi et al., Reference Tozzi, Garczarek, Janowitz, Stein, Wittfeld and Dobrowolny2020).
Sociodemographic factors, such as low income and low parental educational attainment are also among the risk factors that have been linked to reduced gray matter, estimated total intracranial volume (Brito & Noble, Reference Brito and Noble2014), and altered emotion-regulation neurocircuitry activation (Kim et al., Reference Kim, Evans, Angstadt, Ho, Sripada, Swain and Phan2013; Liberzon et al., Reference Liberzon, Ma, Okada, Ho, Swain and Evans2015). Although parenting and sociodemographic risk factors have cumulative effects on brain development and associated cognitive outcomes (Chad-Friedman, Botdorf, Riggins, & Dougherty, Reference Chad-Friedman, Botdorf, Riggins and Dougherty2021), randomized clinical trials suggest that the quality of care has unique causal effects on neurodevelopment and associated psychological functioning (Valadez, Tottenham, Tabachnick, & Dozier, Reference Valadez, Tottenham, Tabachnick and Dozier2020). Importantly, the aforementioned morphological alterations, either as a function of insensitive care or sociodemographic determinants, or the cumulative risk of both have been linked to increased vulnerability to psychopathologies, including anxiety and treatment-resistant depression later in development (Busso et al., Reference Busso, McLaughlin, Brueck, Peverill, Gold and Sheridan2017; Callaghan & Tottenham, Reference Callaghan and Tottenham2016a, Reference Callaghan and Tottenham2016b; Cicchetti & Toth, Reference Cicchetti, Toth, Lerner and Lamb2015; Jensen et al., Reference Jensen, Dickie, Schwartz, Evans, Dumontheil, Paus and Barker2015; Masten & Cicchetti, Reference Masten and Cicchetti2010; Nanni, Uher, & Danese, Reference Nanni, Uher and Danese2012).
Cortical Morphology Alterations and Anxious/Depressive Symptoms
There are a few different measures that can assess cortical morphometry. Most studies examine cortical volume, CT, and cortical SA as they relate to psychopathology. Cortical volume is the product of SA and CT, whereas CT and SA are independent of each other both genetically and phenotypically (Grasby et al., Reference Grasby, Jahanshad, Painter, Colodro-Conde, Bralten, Hibar and Amlien2020; Panizzon et al., Reference Panizzon, Fennema-Notestine, Eyler, Jernigan, Prom-Wormley, Neale and Kremen2009; Winkler et al., Reference Winkler, Kochunov, Blangero, Almasy, Zilles, Fox and Glahn2010). In our analyses we will focus on CT and SA.
Cortical thickness
CT is a measure of cortical gray matter morphology, calculated as the shortest distance between the gray–white matter boundary and the pial surface (Fischl & Dale, Reference Fischl and Dale2000). Normative CT maturation is characterized by a linear thinning trajectory across development (LeWinn, Sheridan, Keyes, Hamilton, & McLaughlin, Reference LeWinn, Sheridan, Keyes, Hamilton and McLaughlin2017), with increased or reduced thickness associated with anxiety (Gold et al., Reference Gold, Steuber, White, Pacheco, Sachs, Pagliaccio and Pine2017) and depression (Drevets et al., Reference Drevets, Price and Furey2008). Longitudinal studies have also shown that the direction of the association between CT and anxious symptoms may depend on the developmental stage when the MRI assessment occurs (childhood vs. adolescence vs. adulthood) (Ducharme et al., Reference Ducharme, Albaugh, Hudziak, Botteron, Nguyen, Truong and Karama2014). Such atypical neural signatures indicate that these morphological changes in the geometric organization of the cortex correspond to differences in their functional output (Molet et al., Reference Molet, Maras, Kinney-Lang, Harris, Rashid, Ivy and Baram2016).
Perturbation in CT development is a neurophenotype of nonmaltreated, low-risk individuals with A/D symptoms, but reports have been inconsistent in establishing a reliable direction of change. Most studies have found reduced thinning over time (Taylor et al., Reference Taylor, Eastman, Frenzel, Embury, Wang, Stephen and Wilson2020) or thicker cortices in attention- and control networks (ventromedial prefrontal cortex, orbitofrontal cortex, precentral gyrus, and superior temporal cortices) among a wide age range of low-risk anxious individuals as compared to their nonanxious counterparts (Blackmon et al., Reference Blackmon, Barr, Carlson, Devinsky, DuBois, Pogash and Thesen2011; De Bellis et al., Reference De Bellis, Keshavan, Shifflett, Iyengar, Dahl, Axelson and Ryan2002; Gold et al., Reference Gold, Steuber, White, Pacheco, Sachs, Pagliaccio and Pine2017; Schwartz et al., Reference Schwartz, Kunwar, Greve, Kagan, Snidman and Bloch2012). At the same time, others have identified thinner mean cortices (Newman et al., Reference Newman, Thompson, Bartsch, Hagler, Chen, Brown and Jernigan2016) or regional specificities in the direction of cortical alterations among adolescents, painting a nuanced picture of the neural correlates of anxious symptoms (Strawn et al., Reference Strawn, Wehry, Chu, Adler, Eliassen, Cerullo and DelBello2013, Reference Strawn, John, Dominick, Swartz, Wehry, Patino and DelBello2014, Reference Strawn, Hamm, Fitzgerald, Fitzgerald, Monk and Phan2015). Although these studies are important in examining the effects of anxiety on brain development, they disregard the context in which anxious symptoms develop, which might contribute to the inconsistency of findings across participant pools.
Inadequate care, or in more severe cases, maltreatment, during early childhood is also a predictor of altered CT development and vulnerability to neuropsychiatric disorders later in life (Busso et al., Reference Busso, McLaughlin, Brueck, Peverill, Gold and Sheridan2017; Kelly et al., Reference Kelly, Viding, Wallace, Schaer, De Brito, Robustelli and Mccrory2013). Specifically, both retrospective and prospective reports have identified reductions in medial prefrontal and temporal CT as a predictor of vulnerability to anxious symptoms in children with experiences of caregiving adversities (Busso et al., Reference Busso, McLaughlin, Brueck, Peverill, Gold and Sheridan2017; Gorka, Hanson, Radtke, & Hariri, Reference Gorka, Hanson, Radtke and Hariri2014).
Cortical surface area
SA is a measure of both the visible pial surface area and the surface hidden between the sulci (Winkler et al., Reference Winkler, Sabuncu, Yeo, Fischl, Greve, Kochunov and Glahn2012). SA is closely related to cortical gray matter volume and is a phenotype that has been linked to a variety of psychopathologies (Bois et al., Reference Bois, Ronan, Levita, Whalley, Giles, McIntosh and Lawrie2015; Prasad et al., Reference Prasad, Goradia, Eack, Rajagopalan, Nutche, Magge and Keshavan2010; Zhang et al., Reference Zhang, Luo, Wang, Qiu, Pan, Kuang and Gong2020) and general cognitive ability (Vuoksimaa et al., Reference Vuoksimaa, Panizzon, Chen, Fiecas, Eyler, Fennema-Notestine and Kremen2015). Arguably, SA is a phenotype of great interest in anxiety research, yet existing findings are relatively mixed regarding how SA relates to the quality of early care and severity of anxiety during childhood. For instance, some have reported no main effect of maltreatment on prefrontal cortex SA (Gold et al., Reference Gold, Sheridan, Peverill, Busso, Lambert, Alves and McLaughlin2016), whereas others have shown SA reductions in maltreated versus nonmaltreated children and adolescents in prefrontal (Herzberg et al., Reference Herzberg, Hodel, Cowell, Hunt, Gunnar and Thomas2018; Hodel et al., Reference Hodel, Hunt, Cowell, Van Den Heuvel, Gunnar and Thomas2015), temporal, and occipitotemporal cortical regions (Kelly et al., Reference Kelly, Viding, Wallace, Schaer, De Brito, Robustelli and Mccrory2013). Reductions in SA among maltreated children are in line with prior work, suggesting that maltreatment is associated with average smaller estimated brain size (Brito & Noble, Reference Brito and Noble2014). The effects of anxiety on SA are also inconsistent across studies. For instance, in a large group of typically developing participants (age range: 3–20 years), Newman et al. (Reference Newman, Thompson, Bartsch, Hagler, Chen, Brown and Jernigan2016) found a negative association between anxious symptoms and ventromedial prefrontal cortex SA, whereas Bas-Hoogendam et al. (Reference Bas-Hoogendam, van Steenbergen, Tissier, Houwing-Duistermaat, Westenberg and van der Wee2018) found regional specificities, such that self-reported anxious symptoms negatively correlated with right caudal anterior cingulate cortex and positively with right precuneus at the uncorrected level. Finally, to our knowledge, there is no evidence suggesting that the association between SA and anxiety varies between maltreated and nonmaltreated children.
Other than SA, researchers have studied the effects of anxiety on cortical volume – which is closely related to SA – but most studies focused on young adults and not children. For instance, Rosso et al. (Reference Rosso, Makris, Britton, Price, Gold, Zai and Rauch2010) found a positive association between anxiety sensitivity and the volume of the insular cortex among young adults. Qi et al. (Reference Qi, Ning, Li, Guo, Chi, Gao and Wu2014) found similar results by showing that the positive association between anxious symptoms and cortical volume in the insula was unique to young adults with anxious symptoms as compared to depressed individuals. Overall, the existing literature on cortical SA and volume points toward the prefrontal and insular cortices being potential areas of interest in anxious symptomatology among young adults; however, little is known about these associations among children.
The Present Study
Taken together, growing evidence suggests that the quality of the early caregiving context can lead to variable morphological outcomes in cortical regions associated with social and emotional processing. These associations are meaningfully related to internalizing symptoms, such as anxiety or depression. In the context of SA, early adversity has been linked to reductions in SA but the findings on how SA relates to anxious symptoms are mixed. With regards to CT, children at risk for maltreatment reliably show thinner cortices in prefrontal, temporal, and parietal regions as their anxiety symptoms increase, whereas nonmaltreated children are more likely to show thicker cortices. However, little is known about whether the caregiving context moderates the association between anxious symptoms and different indices of brain morphology. Preliminary evidence suggests that such moderation effects are present at the functional level (La Buissonnière-Ariza et al., Reference La Buissonnière-Ariza, Séguin, Nassim, Boivin, Pine, Lepore and Maheu2019), with high versus low chronic harsh parenting leading to distinct associations between amygdala–rostral anterior cingulate cortex (rACC) FC and anxiety symptoms in adolescents. Overall, initial steps have been taken to explore the FC patterns associated with anxiety in high- and low-risk parenting context, but little is known about whether the rearing context moderates the morphological correlates of anxious symptoms.
The present study addressed several of the limitations of prior research findings contrasting the brain morphological outcomes of a community sample of middle childhood-aged children who received inadequate care (high risk) during infancy versus children without a known history of inadequate care (low risk) with varying severity of A/D symptoms. We hypothesized that children in the high-risk group would show higher anxiety scores and different CT outcomes in frontal and limbic regions than low-risk children with A/D symptoms. We also expected to see smaller SA in regions rendered important in emotion regulation, but we did not have strong predictions about whether SA and anxiety would show unique associations between high- and low-risk caregiving contexts. Characterizing how early experiences shape morphometric changes during middle childhood could advance our understanding of individual differences and morphological vulnerabilities associated with A/D symptoms and inform research on prevention and psychotherapeutics.
Method and Materials
Sample
Participants included 45 high-risk and 25 low-risk children. Families in the high-risk group were referred by Child Protective Services (CPS) from a large mid-Atlantic city as part of a diversion from foster care program for parents deemed at risk for losing their children to foster care. Parents were invited to enroll in a randomized clinical trial testing the efficacy of an early parenting intervention. Families were enrolled in the intervention before the participating children turned 2 years old. The goal of the intervention was to enhance responsive and sensitive caregiving among parents at risk for providing inadequate care to their children. We did not receive access to formal CPS records or information about whether the allegations were substantiated, so we cannot speak to whether children in the high-risk sample had substantiated reports of maltreatment, such as abuse or neglect. However, we know that they were all deemed at risk for not receiving adequate care due to factors such as homelessness, possible maltreatment, parental substance abuse, maltreatment of other children in the family, physical or educational neglect, or domestic violence. Therefore, we characterize these children as high risk.
At the time of the intervention, all but one participating infant were living with their biological mothers. During the middle childhood assessment all but two children were living with their biological parents (the aforementioned child and another high-risk child were placed in the legal custody of their aunts).
At the time of the middle childhood assessment, an age and race-matched group of typically developing 8-year-old children was also recruited in local community centers and schools. Exclusion criteria in this low-risk group included prior history of CPS-involvement, homelessness, or family history of drug abuse at the time of enrollment.
A subset of children from the larger study was invited for an MRI scanning. Inclusion criteria included having an IQ higher than 70 and the absence of neurological disorders. Given that we did not find significant intervention effects on structural brain outcomes, we collapsed the high-risk experimental and control intervention groups into a high-risk group for all analyses.
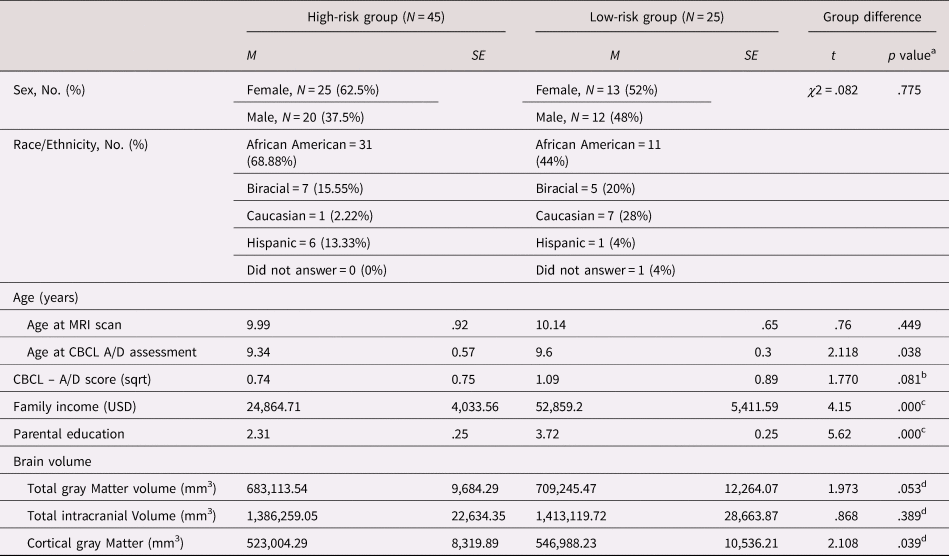
An initial sample of 80 children underwent MRI scanning. Ten participants’ (N = 10) data were excluded due to failed data processing (N = 5) or poor image quality (N = 5; high-risk group excluded data: N = 9, low-risk group excluded data: N = 1). The final sample included 70 children (age range = 8.08–12.14 years, M age = 10.05 years), of whom 45 were in the high-risk group (25 females) and 25 in the low-risk comparison group (13 females). The high- and low-risk groups did not differ significantly in sex distribution [χ2 (1, N = 70) = .082, p = .78] or age [t(68) = −.68, p = .50]. The sample was racially diverse (see more information on racial/ethnic information in Table 1).
Sociodemographic and developmental characteristics of high- and low-risk children (n = 70)

A/D = anxious/depressed; CBCL = Child Behavioral Checklist; MRI = magnetic resonance imaging
a Significant at the p = .05 level, two-sided test.
b Regression model controlled for age and sex.
c Educational background was measured on a scale of 6 [1 = did not complete high-school; 2 = GED; 3 = high-school diploma; 4 = some college; 5 = 4-year college degree; 6 = postgraduate degree (MA, MBA, PhD, JD, MD)]
d Regression model controlled for age, sex, and the amount of motion in the MRI images.
Procedure
Prior to scanning, parents completed the Child Behavioral Checklist (CBCL; Achenbach, Dumenci, & Rescorla, Reference Achenbach, Dumenci and Rescorla2003) to assess children's anxious/depressive symptomatology and the Brief Symptom Inventory (BSI; Derogatis, Reference Derogatis1975) to report on their own mental health status. The average time between the completion of the parent-reported measures and the MRI scanning was 7.29 months (SD = 8.5 months, range 0.7 to 28.67 months). CBCL profiles are relatively stable in pediatric samples, even across a 6- to 8-year period (Biederman et al., Reference Biederman, Monuteaux, Greene, Braaten, Doyle and Faraone2001; Frizzo, Pedrini, Souza, Bandeira, & Borsa, Reference Frizzo, Pedrini, Souza, Bandeira and Borsa2015; Mattison and Spitznagel, Reference Mattison and Spitznagel1999; McElroy, Belsky, Carragher, Fearon, & Patalay, Reference McElroy, Belsky, Carragher, Fearon and Patalay2018; Verhulst and Van der Ende, Reference Verhulst and Van der Ende1995), which decreases the likelihood that the variability in the time between CBCL completion and the MRI scan in our influenced the results.
Children were accompanied by a female primary caregiver (biological mother for 68, biological aunts for two) to the MRI scan. All children passed the MRI safety screening and had an IQ score of at least 70. Children's comfort in a mock MRI scanner was assessed, followed by the MRI scan. The study protocol was approved by the Institutional Review Board at the University of Delaware.
Image acquisition and processing
T1-weighted magnetization prepared - rapid gradient echo sequences (MP-RAGE) (1 × 1 × 1 mm isometric voxels) were acquired at the Center for Biomedical and Brain Imaging at the University of Delaware using a 3-Tesla Siemens MAGNETOM Prismafit scanner, equipped with a 20-channel head coil for multiband capability. We used standard image processing procedures in the FreeSurfer image analysis software suite (Version 6, http://surfer.nmr.mgh.harvard.edu), including cortical mantle reconstruction and spatial smoothing of 10 mm FWHM. Technical details of the FreeSurfer procedures are described elsewhere (Dale, Fischl, & Sereno, Reference Dale, Fischl and Sereno1999; Fischl et al., Reference Fischl, Salat, Busa, Albert, Dieterich, Haselgrove and Dale2002, Reference Fischl, Van Der Kouwe, Destrieux, Halgren, Ségonne, Salat and Dale2004; Fischl & Dale, Reference Fischl and Dale2000).
Quality control of the MRI images
Of the 80 brains, 75 were successfully processed with FreeSurfer, followed by two rounds of quality control. First, a graduate student rated the quality of each image on a scale of 1 through 4 (1 = great segmentation, no motion, include in analyses; 2 = good segmentation, some motion, include in analyses; 3 = satisfactory segmentation, substantial motion, include in analyses; 4 = poor segmentation, extensive motion, exclude from analyses) based on Afacan et al.'s (Reference Afacan, Erem, Roby, Roth, Roth, Prabhu and Warfield2016) guidelines. Secondary quality assessment was performed using the Qoala-T supervised-learning tool (Klapwijk, van de Kamp, van der Meulen, Peters, & Wierenga, Reference Klapwijk, van de Kamp, van der Meulen, Peters and Wierenga2019). Of the 75 processed brains the same five scans were recommended for exclusion by the trained rater and Qoala-T. The low- and high-risk groups did not differ significantly in mean Qoala-T percentile scores (t(69) = −.25, p = .81) or the rater's scorings [t(69) = .48, p = .63], and the correlation between the two rating schemes was r(68) = −.43, p = .00. The MRI images were not edited manually to avoid the introduction of unsystematic noise. We controlled for image quality, as rated by the trained graduate student, in our analyses.
Measures
Demographics
We assessed age, sex, race, family income, caregiver educational background, and caregiver mental health outcomes. Eight families in the high-risk group did not report on their income; therefore, the average indicated income in the high-risk group (M = $34,862.74) represents the income of the 37 families with reported data.
Anxious/depressive symptoms
Child Behavioral Checklist – anxious/depressed subscale (CBCL A/D)
The CBCL is a parent-reported standardized questionnaire that reliably assesses symptoms of anxiety and depression between the ages of 6 and 18 (Achenbach & Rescorla, Reference Achenbach and Rescorla2001). The internal consistency of the CBCL was excellent in the present sample (overall Cronbach α = .946; high-risk group: α = .969; low-risk group: α = .902). The A/D subscale is a composite of 13 items and has been widely used in a variety of pediatric populations. One item related to suicidal thoughts was removed from the questionnaire, resulting in a 12-item scale in the present study (overall internal consistency in our sample: α = .678; high-risk group: α = .709; low-risk group: α = .628).
Brief Symptom Inventory (BSI)
The BSI is a 53-item self-report symptom inventory that measures psychiatric symptom patterns on a 5-point Likert scale (0 – not at all; 4 – very much). It has nine primary symptom dimensions and two global indices of psychological functioning (Derogatis, Reference Derogatis1975).
Statistical analyses
We used linear regression analyses in R (Version 3.5.1; R Core Team, 2019) to examine the main effect of risk status on A/D symptoms. We then examined the association between risk status, A/D symptoms, CT and SA using FreeSurfer's Qdec application (www.surfer.nmr.mgh.harvard.edu). To test our CT-related hypotheses, we performed vertex-wise general linear model analyses across the entire cortex with an interaction term between A/D symptoms and risk status. The main effect was included in the model. In our SA models, we examined the main effect of risk status and CBCL A/D symptoms, as well as the interaction between the two in separate models. Once again, the main effect was included in the SA model with the interaction term.
We used a Gaussian kernel of 10 mm full width at half maximum (FWHM) to spatially smooth the data. The vertex-wise threshold of significance was p < .01. We corrected for multiple comparisons using Monte Carlo simulations with a cluster-wide corrected threshold being -log10(p) (Hagler, Saygin, & Sereno, Reference Hagler, Saygin and Sereno2006). Clusters that survived multiple comparisons corrections were used then as masks to calculate mean CT and SA in that region for each study participant, which then were entered into a regression model and were visualized in R. Only the clusters that survived multiple comparisons correction are reported. All statistical models included sex and age at the time of scanning to follow the example of previous studies on brain morphology (Busso et al., Reference Busso, McLaughlin, Brueck, Peverill, Gold and Sheridan2017; Gold et al., Reference Gold, Sheridan, Peverill, Busso, Lambert, Alves and McLaughlin2016; McLaughlin, Sheridan, & Lambert, Reference McLaughlin, Sheridan, Winter, Fox, Zeanah and Nelson2014) and because we hypothesized that anxiety-related alterations in morphology would be unique to the caregiving context and not simply explained by normative, age-related thinning (LeWinn et al., Reference LeWinn, Sheridan, Keyes, Hamilton and McLaughlin2017) or age-related changes in anxious symptoms (Beesdo et al., Reference Beesdo, Knappe and Pine2009).
In addition, we controlled for image quality (as rated by the trained graduate student). Finally, in separate models, we also controlled for estimated total intracranial volume (ETIV) as a covariate to test if the effects changed with an increase in brain size.
To assess the effect of possible confounding sociodemographic variables on the association between A/D scores and CT, we completed secondary analyses in which we controlled for income, parental education, and race (in addition to sex, age, and image quality). In these models we also controlled for ETIV to make our results comparable to prior studies (e.g., McLaughlin et al., Reference McLaughlin, Sheridan, Winter, Fox, Zeanah and Nelson2014).
Results
Demographics
High- and low-risk groups differed in educational background and income, with low-risk parents having significantly higher educational background and income than the high-risk group. In our primary analyses we did not control for parental education and income to avoid biasing the estimate of the risk status, A/D, and interaction effects on CT (Miller & Chapman, Reference Miller and Chapman2001). For detailed demographic information, see Table 1.
Preliminary analyses
Most parents reported subclinical levels of A/D symptoms for their children (range 0–11; M = 1.41, SD = 1.96), which resulted in positively skewed A/D scores. To adjust for the skew, the square root of the raw A/D scores (range 0–3.32; M = .87, SD = .81) were used in all analyses. The high-risk and the low-risk groups showed a marginally significant group difference in A/D symptoms [b = .36, t(66) = 1.77, p = .08], in the direction of lower risk being associated with higher anxiety. Age and sex were included in the preliminary analyses as covariates of noninterest.
The parents of high- and low-risk children did not differ in their own report of psychopathology as measured by the nine primary symptom dimensions, the Global Severity Index, and Positive Symptom Total Index of the BSI. Given the null effects on the BSI, we did not control for caregiver mental health outcomes in our models.
Primary analyses
Risk status and anxious/depressive (A/D) symptom interaction in predicting cortical morphology
Cortical thickness
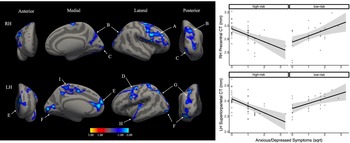
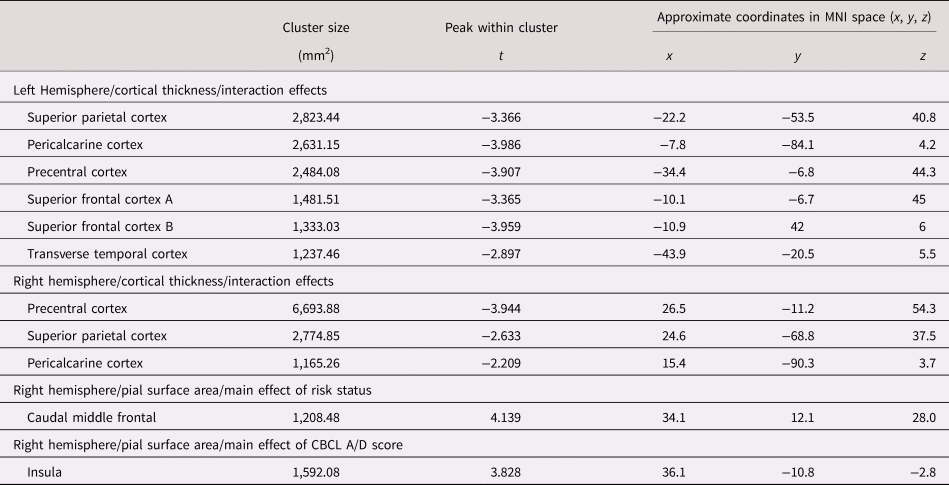
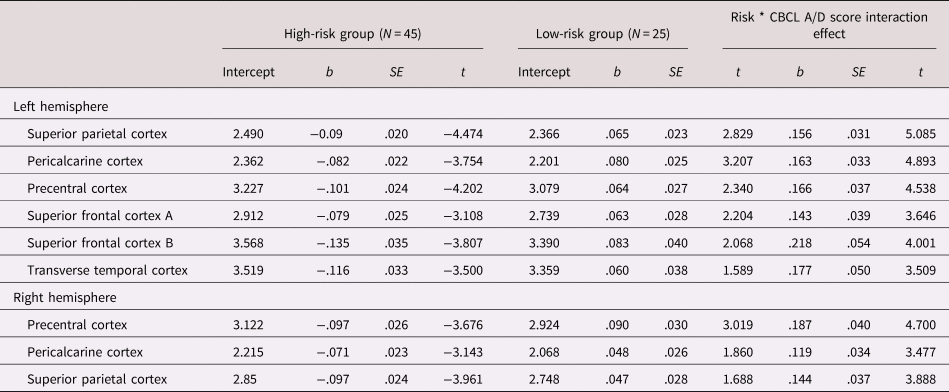
Our primary hypotheses aimed to test interaction effects between risk status and A/D symptoms in predicting CT. See Figure 1 for visual representation of our significant findings. In the right hemisphere, three clusters (clusters A, B, and C) survived Monte Carlo multiple comparison corrections. These clusters peaks were in the (A) precentral, (B) superior parietal, and (C) pericalcarine cortices. In the left hemisphere, six clusters emerged (clusters D through I) with their peaks in the (D) precentral-, (E and I) superior frontal-, (F) pericalcarine-, (G) superior parietal-, and (H) transverse temporal cortices. For information on cluster characteristics (size, Montreal Neurological Institute [MNI] coordinates and peak), see Table 2. In all the clusters, greater A/D symptoms were associated with decreased CT among the high-risk children and increased CT in low-risk children (Figures 1). As can be seen in the right panel of Figure 1, as the number of A/D symptoms increase, CT decreases in the high-risk group. In contrast, in the right panel, as the number of A/D symptoms increase, CT increases in the low-risk group. For simple slope effects, see Table 3.
Significant risk status by Child Behavioral Checklist (CBCL) anxious/depressed (A/D) symptoms interactions on cortical thickness (CT) on the group average brain, following Monte Carlo multiple comparison corrections in both hemispheres. Greater A/D symptoms were associated with decreasing CT among the high-risk group and increasing CT in the low-risk group. The model controlled for age, sex, and image quality. The scatter plots are prototypical associations that were similar across all the clusters. RH – right hemisphere; LH – left hemisphere; A – RH precentral Cortex (including areas of the superior frontal-, paracentral-, caudal middle frontal-, rostral middle frontal-, pars triangularis-, rostral middle frontal-, pars opercularis-, and postcentral cortex); B – RH superior parietal cortex (including areas of the precuneus, lateral occipital-, and inferior parietal cortex); C – RH pericalcarine Cortex (including areas of the lateral occipital-, lingual and fusiform cortex); D – LH precentral Cortex (including areas of the caudal middle frontal-, and rostral middle frontal cortex); E – LH superior frontal Cortex (including areas of rostral middle frontal, medial orbitofrontal, rostral anterior cingulate, and caudal anterior cingulate cortex); F – LH pericalcarine Cortex (including areas lingual and lateral occipital cortex); G – LH superior parietal Cortex (including areas of the postcentral-, inferior parietal-, and lateral occipital cortex); H – LH transverse temporal Cortex (including areas of the insula, superior temporal and transverse temporal cortex); I – LH superior frontal Cortex (including areas of the paracentral-, precuneus, and posterior cingulate cortex);.

Left and right hemisphere cluster characteristics for the clusters that survived multiple comparisons correction
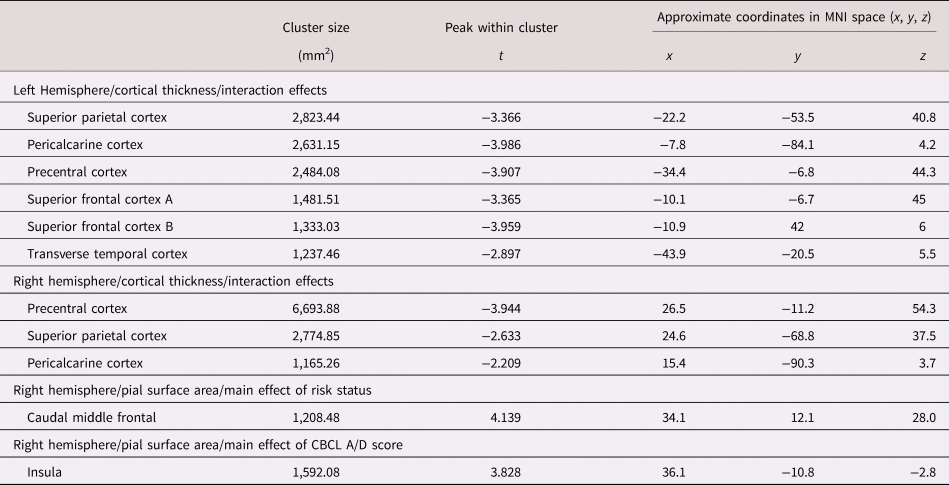
A/D = anxious/depressed; CBCL = Child Behavioral Checklist; anxious/depressed; MNI = Montreal Neurological Institute.
All analyses controlled for age, sex, and amount of motion in individual MRI images.
Simple slopes results for the interactions between anxious/depressive outcomes and cortical thickness in the high- and the low-risk group
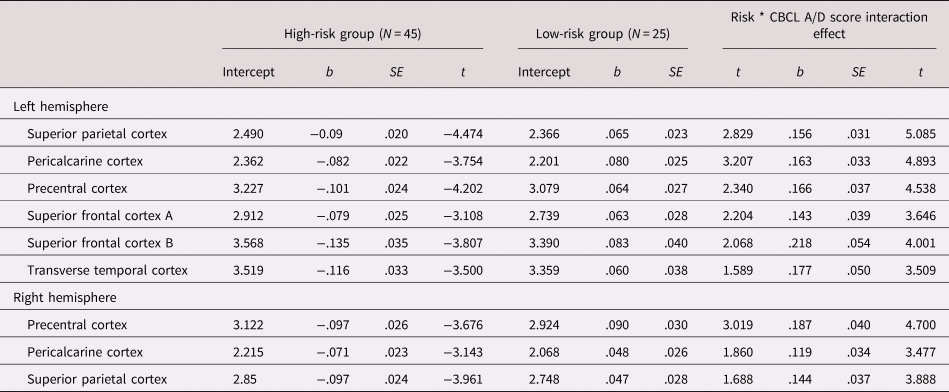
Note. The estimates reflect unstandardized regression coefficients. A/D = anxious/depressed; CBCL = Child Behavioral Checklist
Cortical surface area
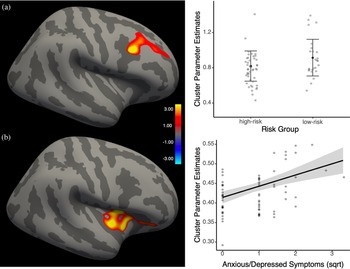
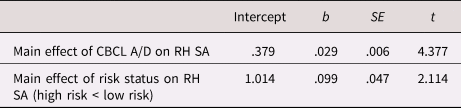
We hypothesized that children in the high-risk group would show smaller cortical areas in regions rendered key for healthy social and emotional functioning. We also tested for significant associations between SA and CBCL A/D scores across the pial surface. Finally, we examined the effect of the interaction term between A/D symptoms and risk status on SA. See Figure 2 for our results. Children in the high-risk group showed significantly smaller SA than low-risk children in the prefrontal cortex, with the cluster peak being in the rostral middle frontal cortex in the right hemisphere (see Figure 2A and Table 4). SA also significantly correlated with CBCL A/D scores in the right hemisphere insular cortex, such that as anxious symptoms increased, SA also increased (see Figure 2B). The effect remained significant even after we controlled for risk status. Finally, risk status did not interact with anxious symptoms in predicting SA.
Significant pial surface area outcomes. 2A – significant main effect of risk status on right hemisphere caudal middle frontal region surface area on the inflated brain surface and the distribution plot of individual average surface area outcomes (the error bars represent ± 3 standard deviations). 2B – significant main effect of Child Behavioral Checklist (CBCL) anxious/depressed (A/D) scores on insular cortex SA on the inflated brain surface. The scatter plot depicts the positive association between the CBCL A/D scores and SA. Both models controlled for age, sex, and image quality.
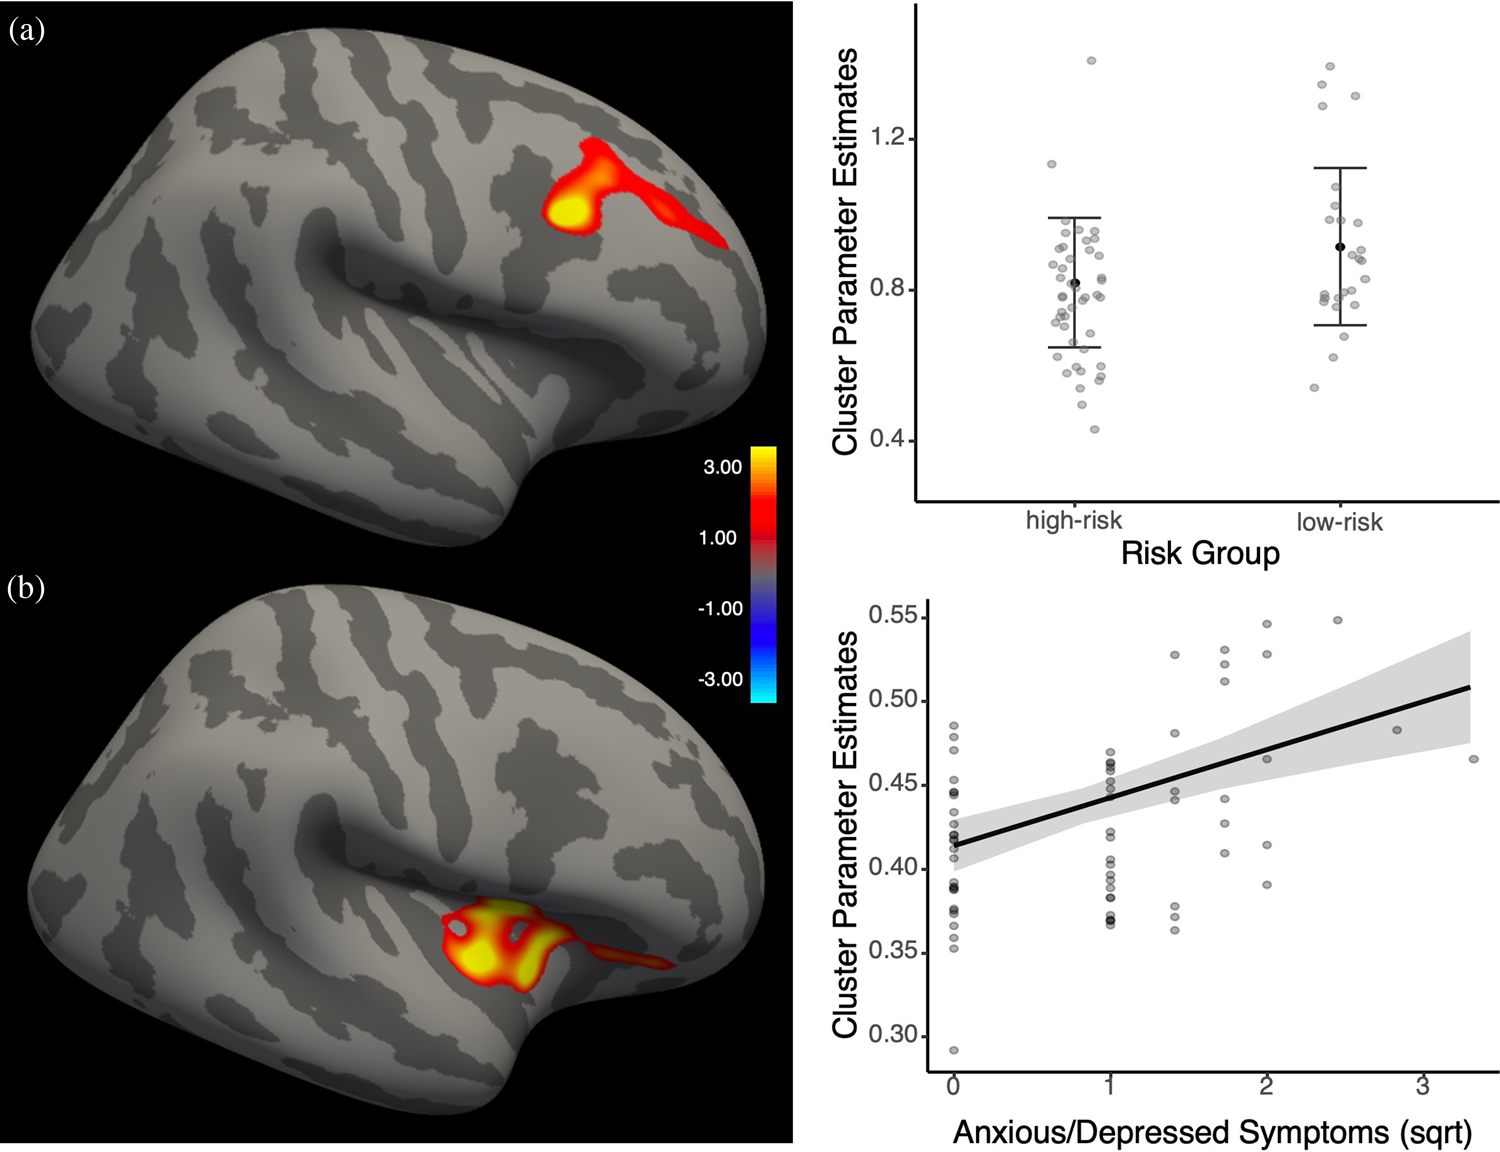
Significant main effects of Child Behavioral Checklist (CBCL) anxious/depressed (A/D) symptoms and risk status on pial surface area
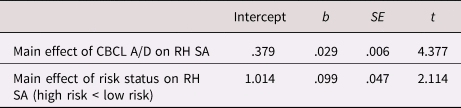
Note. The estimates reflect unstandardized regression coefficients.
RH = right hemisphere; SA = pial surface area.
Secondary analyses
Our secondary analyses examined if sociodemographic variables, including income, parental education, and race would change the results of our primary analyses. The findings related to CT and SA remained significant. Finally, we tested the additional effect of ETIV on our results. The CT findings and the main effect of anxiety on insular cortex SA remained significant with the inclusion of ETIV in the model; however, the main effect of risk status on SA became nonsignificant.
Discussion
The present study investigated the association between two indices of cortical morphology, namely CT and CSA, and associated A/D symptoms in high- versus low-risk caregiving environments during middle childhood. We found that in the high-risk group, as the severity of A/D symptoms increased, CT decreased, whereas in the low-risk group, as A/D symptoms increased, CT increased. We also found a significant main effect of risk status on SA, with children in the high-risk group showing smaller SA in a subregion of the prefrontal cortex than low-risk children. In addition, SA was positively associated with CBCL A/D symptoms in the insular cortex. These associations were observed in cortical regions responsible for higher-level cognitive, and attentional processes and regulation of emotional stimuli (e.g., frontal, medial prefrontal, temporal, and parietal areas). These preliminary findings highlight the importance of assessing the quality of children's caregiving environment when examining the CT correlates of A/D symptoms; however, the results should be viewed in light of the small sample size and the exploratory nature of our results that need future replication.
This exploratory study encourages future studies to consider early caregiving as a moderator of brain–behavior associations, but we cannot tell why we are seeing distinct associations between the two. There can be many explanations as to why distinct morphometric phenotypes were observed in high- and low-risk contexts, all of which are speculative given the present data. For instance, considering that the cortex shows a normative linear thinning trajectory across development, thinner cortices as a function of higher anxious symptoms might reflect accelerated thinning in high-risk contexts. Perhaps chronic experiences of threat and insensitive care in the high-risk group lead to premature maturation of the optimally slow-paced development of the prefrontal- and orbitofrontal cortices in the service of improved self-regulation early in life (Callaghan & Tottenham, Reference Callaghan and Tottenham2016b), which might become a vulnerability factor during middle childhood when internalizing symptoms commonly arise. Exposure to challenges can also alter stress hormone production that has the potential to shape brain morphology (Kim & Yoon, Reference Kim and Yoon1998; Lupien et al., Reference Lupien, Leon, Santi, Convit, Tarshish, Thakur and Meaney1998; McEwen, Nasca, & Gray, Reference McEwen, Nasca and Gray2016; Sapolsky, Reference Sapolsky1996) by reducing dendritic arborization and soma size, hence leading to reductions in gray matter volume and thickness. In sum, although thinner cortices may be adaptive and may aid high-risk children's emotion regulation in coping with challenges, they likely become a vulnerability factor at an older age in the context of chronic stressors.
In the case of children from low-risk backgrounds with A/D symptoms, the significance of altered cortical development, as manifested by thicker cortices, is still debated. Findings have suggested that there is a delay in structural maturation of the medial prefrontal cortex (mPFC) (Ducharme et al., Reference Ducharme, Albaugh, Hudziak, Botteron, Nguyen, Truong and Karama2014) as well as the white matter tracts between the PFC and limbic structures among anxious adolescents (Miller et al., Reference Miller, Duka, Stimpson, Schapiro, Baze, McArthur and Sherwood2012; Paus, Keshavan, & Giedd, Reference Paus, Keshavan and Giedd2008). Thicker cortices might also indicate a compensatory mechanism, where the PFC becomes more active as it tries to control the overly active amygdala (Herringa et al., Reference Herringa, Burghy, Stodola, Fox, Davidson and Essex2016; McLaughlin, Peverill, Gold, Alves, & Sheridan, Reference McLaughlin, Peverill, Gold, Alves and Sheridan2015). Increased PFC activation can lead to increased cell numbers and myelination, which in turn can result in thicker cortices (Hegarty et al., Reference Hegarty, Foland-Ross, Narr, Townsend, Bookheimer, Thompson and Altshuler2012; Vidal-Pineiro et al., Reference Vidal-Pineiro, Parker, Shin, French, Jackowski and Mowinckel2020). Finally, dispositional factors, such as genetic vulnerability or temperament, might also shape neural correlates of A/D symptomatology.
Although it is speculative, the observed cortical phenotype among children from low-risk environments are perhaps also related to characteristics of their caregiving environments. Parents of anxious children tend to model anxious behaviors, encourage maladaptive coping, and engage in overprotective and overcontrolling behaviors (Kendall, Reference Kendall and Kendall2012). Under such circumstances, the normative maturation of the mPFC may be delayed – as seen in thicker cortices with the increase of anxious symptoms – leading to prolonged dependence on the caregiver for co-regulation, later onset of normative cortical thinning, and poor self-regulation during middle childhood.
Our findings might also be in line with La Buissonnière-Ariza and colleagues’ work (Reference La Buissonnière-Ariza, Séguin, Nassim, Boivin, Pine, Lepore and Maheu2019) where the quality of parenting (high vs. low harsh parenting) predicted unique associations between anxious symptoms and FC patterns between the rACC and the amygdala. Future studies are necessary to confirm this, but the unique morphological profiles observed in our study might be related to distinct FC patterns between the amygdala and the rACC.
We note that children from low-risk and high-risk groups showed a marginally significant difference in their parent-reported anxious symptom severity. More specifically, caregivers of children in the high-risk group were marginally more likely to report fewer anxious symptoms than children in the low-risk group. It is also important to highlight that although early caregiving adversities in general increase children's vulnerability to internalizing psychopathologies, null findings between high- and low-risk children have emerged in prior studies as well (Cicchetti, Rogosch, Gunnar, & Toth, Reference Cicchetti, Rogosch, Gunnar and Toth2010; Dubois-Comtois, Moss, Cyr, & Pascuzzo, Reference Dubois-Comtois, Moss, Cyr and Pascuzzo2013; Keiley, Howe, Dodge, Bates, & Petti, Reference Keiley, Howe, Dodge, Bates and Petti2001; Wiik et al., Reference Wiik, Loman, Van Ryzin, Armstrong, Essex, Pollak and Gunnar2011).
Unlike CT, risk status did not predict unique associations between anxious symptoms and SA. Instead, we found group differences in average SA in the prefrontal cortex, such that children at risk for inadequate care showed smaller SA than low-risk children. These effects are in line with our findings related to total gray matter volume where children in the high-risk group showed reductions compared to the low-risk children (Brito & Noble, Reference Brito and Noble2014). Given that gray mater volume is closely related to SA (more so than CT) (Winkler et al., Reference Winkler, Kochunov, Blangero, Almasy, Zilles, Fox and Glahn2010), such a group difference was expected.
We also found a significant positive association between SA and CBCL A/D scores in the insular cortex that was unrelated to the quality of early care. Considering that the insular cortex is a central node of the fear circuitry and is a cross-modal integration hub where interoceptive, emotional, sensory, cognitive, and motivational input converge to shape behavior (Gogolla, Reference Gogolla2017; Kurth, Zilles, Fox, Laird, & Eickhoff, Reference Kurth, Zilles, Fox, Laird and Eickhoff2010), our results might indicate increased engagement of the insular cortex in the service of modulation of subclinical anxious symptoms during middle childhood. To our knowledge, insular SA has not been directly linked to anxious symptoms in children, but some studies have found similar associations between insular cortex volume and anxious symptom severity (Rosso et al., Reference Rosso, Makris, Britton, Price, Gold, Zai and Rauch2010). Our results are also in line with a vast literature on the insular cortex showing increased activation among anxious individuals (Kurth et al., Reference Kurth, Zilles, Fox, Laird and Eickhoff2010), which has the potential to increase insular volume and perhaps SA. Given that our sample showed mainly subclinical levels of anxiety, future studies are encouraged to examine these associations in clinically anxious pediatric populations.
The present study has possible preventive and psychotherapeutic implications, especially in the context of CT. Given that distinct neurophenotypes were associated with anxious symptoms, children from high- and low-caregiving contexts might benefit from different forms of interventions. At the subclinical symptom level, children at risk for developing anxiety may benefit from school-based prevention and early intervention programs. Most of these programs use techniques from cognitive behavioral therapy (CBT), mindfulness-based activities, and psychoeducation and have shown to reduce short- and longer-term anxiety (Neil & Christensen, Reference Neil and Christensen2009). Children with clinically significant symptoms may benefit from targeted mindfulness-based interventions (Hofmann, Sawyer, Witt, & Oh, Reference Hofmann, Sawyer, Witt and Oh2010), CBT (Seligman & Ollendick, Reference Seligman and Ollendick2011), and the combination of the two (mindfulness-based CBT; Semple & Lee, Reference Semple and Lee2007), all of which have been identified as powerful treatments for anxiety. To our knowledge, there is no evidence from randomized clinical trials deeming one approach superior to the other for children from high- versus low-risk caregiving contexts. The causal effects of evidence-based interventions on changes in CT are also unknown. A recent study has found that thinner cortices in parietal and occipital regions, including the lingual gyrus, were predictive of worse treatment outcomes among anxious youth (Gold et al., Reference Gold, Steuber, White, Pacheco, Sachs, Pagliaccio and Pine2017); this study, however, did not assess the quality of the early caregiving context and was not a randomized clinical trial. Nevertheless, if thinner cortices are indicative of worse treatment outcomes in general, thicker cortices among low-risk anxious children might suggest better odds for symptom reduction following therapy than high-risk anxious children with thinner cortices. Although the biological processes underlying these hypothesized mechanisms are speculative, perhaps thicker cortices are indicative of enhanced neuroplasticity. Future studies are needed to address this gap in the literature and systematically investigate the causal effects of therapy on CT development in high- and low-risk contexts to maximize children's therapeutic gains.
Strengths and Limitations
There are several limitations that need to be addressed. First, the high- and low-risk groups are unbalanced on several sociodemographic factors (e.g., income, parental education, distribution of race). High sociodemographic risk factors tend to coincide (Smith et al., Reference Smith, Nichols, Vidaurre, Winkler, Behrens, Glasser and Miller2015) and are associated with gray matter volume reductions in high-risk populations (Brito & Noble, Reference Brito and Noble2014; De Bellis et al., Reference De Bellis, Keshavan, Shifflett, Iyengar, Dahl, Axelson and Ryan2002; Lim et al., Reference Lim, Hart, Mehta, Worker, Simmons, Mirza and Rubia2018; VanTieghem et al., Reference VanTieghem, Korom, Flannery, Choy, Caldera, Humphreys and Tottenham2021). Although similar sample characteristics are common in other studies comparing high- versus low-risk groups of children (e.g., see Busso et al., Reference Busso, McLaughlin, Brueck, Peverill, Gold and Sheridan2017), such group differences might bias or even introduce alternative interpretations of the results. To address this, we statistically accounted for this unbalance in our data and our results did not change, suggesting that risk status continued to predict unique morphological variations over and above sociodemographic determinants. Second, we have limited information about the allegations and the associated parental care that resulted in the families’ CPS involvement. Some of the allegations were likely substantiated and were associated with insensitive care, however, they were not severe enough to result in the child's removal from the family. Despite evidence suggesting that both substantiated and unsubstantiated allegations of maltreatment have a similar negative effect on developmental outcomes (Hussey et al., Reference Hussey, Marshall, English, Knight, Lau, Dubowitz and Kotch2005), further research needs to consider and characterize how the type, severity, and frequency of maltreatment relate to mental health outcomes and alterations in brain morphology. Third, the sample size of the low-risk group is relatively small. Underpowered studies are vulnerable to Type 1 errors, therefore studies with a larger sample size are encouraged to replicate our preliminary findings. The present study was exploratory, nevertheless, relative to other studies with a much wider age range, the present study represents a valuable initial step toward characterizing structural changes as a function of A/D symptoms and risk status during a narrow but critical developmental period when mood disorders commonly arise. For more information on age-related changes in CT and anxiety, see Ducharme et al. (Reference Ducharme, Albaugh, Hudziak, Botteron, Nguyen, Truong and Karama2014). In addition, we used a parent-report measure to assess A/D symptoms, which could be influenced by parental biases in the perception and reporting of behavior problems. Despite this limitation, the CBCL is a widely used measure and gives an important assessment of children's mental health problems from the parents’ perspective. Lastly, although studying how subclinical levels of A/D symptoms shape the neural phenotypes of children is critical, extrapolations to potential neural changes in pediatric populations with more severe psychopathology remain speculative.
The current study presents preliminary evidence for the effect of the early caregiving environment on the morphological associations of subclinical anxiety symptoms during middle childhood. Future studies are needed to continue to examine the factors influencing the direction of CT differences, as well as explore prospective associations between early-life caregiving experiences and patterns of structural brain development, with the goal to explain individual variability in negative mental health outcomes and the biological characteristics influencing children's therapeutic gains.
Acknowledgments
Marta Korom completed data processing, quality control of all images, statistical analyses and wrote the manuscript. As a co-Investigator, Dr. Tottenham helped develop the research design and assisted in analyses and manuscript development. Emilio A. Valadez was responsible for data collection, helped develop the research design, and assisted in manuscript editing. As the primary investigator, Dr. Dozier wrote the grant that funded the study, developed the research design, and assisted in analyses and manuscript development.
Funding Statement
This research was supported by the National Institute of Mental Health R01 R01MH074374-07S1 grant.
Conflicts of Interest
None.