





Human milk (HM) is widely recognised as the gold standard for neonatal nutrition(Reference Miller, Tonkin and Damarell1,Reference Peila, Moro and Bertino2) . However, during the early postpartum period, especially among mothers of preterm infants, milk production may be insufficient to meet the infants’ nutritional requirements(Reference Escuder-Vieco, Rodríguez and Espinosa-Martos3,Reference Haiden and Ziegler4) . In such cases, the WHO and the American Academy of Pediatrics recommend donor HM when maternal milk is unavailable or insufficient(Reference Peila, Moro and Bertino2,Reference Haiden and Ziegler4) .
Human milk banks (HMB) play a pivotal role in this context by recruiting and screening potential milk donors; collecting, processing and storing HM; and distributing it to meet the nutritional needs of neonates(Reference Haiden and Ziegler4–Reference Unger and O’Connor6). Upon receipt of donated HM, HMB implement procedures to ensure the milk’s safety and quality before administration(Reference Unger and O’Connor6).
Initially, donated HM is stored at –20°C until processing. The European Milk Bank Association (EMBA) recommends Holder pasteurisation (HoP) as the standard method for HM processing(Reference Unger and O’Connor6,Reference Moro, Billeaud and Rachel7) . HoP entails rapid heating of milk to 62·5°C ± 0·5°C for 30 min, followed by rapid cooling to 4°C(Reference Unger and O’Connor6–Reference Müller, Toll and Manzardo9). This method is considered to achieve a favourable balance between microbiological safety and preservation of the milk’s nutritional and bioactive components(Reference Peila, Moro and Bertino2,Reference Haiden and Ziegler4,Reference Moro, Billeaud and Rachel7,Reference Caballero Martín, Sánchez Gomez De Orgaz and Sánchez Luna8) . After pasteurisation, the milk is frozen again until it is administered to the infant. For long-term storage, freezing at –80°C is regarded as the gold standard, although it is not routinely used in clinical practice(Reference Lev, Gdalevich and Zisapel10,Reference García-Lara, Escuder-Vieco and García-Algar11) . Each step in the processing chain may alter the nutritional and biochemical properties of HM, making it essential to understand these modifications to optimise neonatal nutritional management(Reference García-Lara, Escuder-Vieco and García-Algar11–Reference Mohd-Taufek, Cartwright and Davies14).
The present study aims to investigate changes in macronutrient, mineral (Cu, Zn, iodine and Se) and heavy metal (As, Cd, Hg and Pb) concentrations in HM across four distinct stages of routine processing in an HMB (fresh, frozen at –20°C, pasteurised and frozen at –80°C).
Materials and methods
Study design and participants
After providing written informed consent form, twenty-two women donated 50 mL of fresh HM between February and October 2024 at the Human Milk Bank of Asturias.
The sample size was estimated for a repeated-measures analysis with four measurements per sample, a significance level of 0·05 and a statistical power of 80 %. Assuming a moderate effect size, approximately 20–30 participants were required. Feasibility considerations were based on the number of neonatal admissions during the study period and the expected breast-feeding rate among eligible mothers.
All lactating mothers with infants admitted to a tertiary care hospital during the study period who provided written informed consent were eligible for inclusion.
All samples were collected using sterile, single-use plastic containers.
Samples were stored in dedicated food-grade plastic containers at 4°C until initial processing.
Participating mothers completed a comprehensive health and dietary questionnaire. Information collected included maternal age, weight and height, nationality, place of residence, dietary intake during the previous week, use of medications and dietary supplements, occupational exposure to toxins, gestational age at delivery and date of delivery.
Sample preparation
Samples were processed in accordance with the current standard protocol of the Milk Bank of the Principality of Asturias.
Upon collection, 7 mL of fresh HM were immediately aliquoted into two sterile Falcon tubes for baseline analysis (fresh HM). Remaining volumes were stored at –20°C. After a mean storage duration of 41·6 d (95 % CI 39·4–44·8), samples were thawed in a thermostatic water bath, and 7 mL were aliquoted for subsequent analysis (frozen –20°C HM). The residual milk was subjected to HoP using the Sterifeed S90 system, and 7 mL were collected for pasteurised HM analysis. Finally, the remaining HM was stored at –80°C for an average of 98·6 d (95 % CI 95·4–101·8) before thawing and analysis (frozen –80°C HM). All aliquoting procedures were performed using sterile syringes to maintain sample integrity. The processing workflow is summarised in Figure 1.
Processing flow chart. HM, human milk.

Figure 1. Long description
Panel A: A container labeled No 14 is shown, indicating the first analysis of fresh human milk. Panel B: The container is placed in a freezer set at -20 degrees Celsius, with a label indicating a duration of 41.6 days for the second analysis of frozen human milk. Panel C: The human milk undergoes a process labeled HM post-HoP. Panel D: The container is then placed in a freezer set at -80 degrees Celsius, with a label indicating a duration of 98.6 days for the third and final analysis of frozen human milk.
Macronutrients analysis
For nutritional analysis, HM samples were first heated to 40 ± 2°C in a thermostatically controlled water bath for 15 min to ensure uniform temperature throughout the sample. Following heating, each sample was homogenised for 5 s using a vortex mixer to achieve a consistent distribution of macronutrients and other soluble components. Nutritional composition, including macronutrient content, was subsequently determined using the MIRIS® HM analyser, following the manufacturer’s instructions and calibration protocols.
Trace element and heavy metal analyses
The concentrations of Cu, Zn, Se, iodine, As, Cd, Hg and Pb were determined in the Clinical Biochemistry Laboratory of the Central University Hospital of Asturias. Their determination was carried out using inductively coupled plasma mass spectrometry (ICP-MS). The analysis was performed using a 7700× ICP-MS (Agilent Technologies) according to the centre’s protocol for trace element analysis.
Arsenic, cadmium, mercury and lead analysis
To perform this test, 200 μL of breast milk were diluted 1:20 using an aqueous solution composed of EDTA (0·05 %), Triton X-100 (0·05 %), 1-butanol (2 %), ammonium hydroxide (1 %) and 20 μg/L of Ge (72Ge), Ir (198Ir), Bi (209Bi) and Rh (103Rh) as internal standards. The instrument is used in ‘Helium’ mode (flow rate: 4·5 mL/min). The measurement time is 0·5 s for 206Pb and 2 s for 75As, 111Cd and 3 s for 201Hg. The acquisition time is 126 s, and the total analysis time is 3 min per sample. Argon gas in the plasma is used at a flow rate of 15 L/min.
Copper, selenium and zinc analysis
To perform this analysis, 100 μL of breast milk were diluted 1:40 using an aqueous solution composed of EDTA (0·05 %), Triton X-100 (0·05 %), 1-butanol (2 %), ammonium hydroxide (1 %) and 20 μg/L of Ge (72Ge) as an internal standard. The instrument is used in ‘Helium’ mode (flow rate: 4·5 mL/min). The measurement time is 0·5 s for 63Cu and 66Zn and 1 s for 78Se. The acquisition time is 15 s, and the total analysis time is 2 min per sample. Argon plasma gas is used at a flow rate of 15 L/min.
Iodine analysis
For this analysis, 200 μL of breast milk was diluted 1:20 with an aqueous solution composed of EDTA (0·05 %), Triton X-100 (0·05 %), 1-butanol (2 %), ammonium hydroxide (1 %) and 20 μg/L of tellurium (128Te) as the internal standard for 127I. The instrument is used in ‘no gas’ mode. The measurement time for 127I is 2 s. The acquisition time is 9 s, and the total analysis time is less than 2·5 min per sample. Plasma argon gas is used at a flow rate of 15 L/min.
For each trace element and heavy metal, the limit of detectability and quantification were established: for Cu <1 μg/dL and 9 μg/dL, respectively, for Se 2 and 11 μg/L, respectively, for Zn 1 μg/dL and 16 μg/dL, respectively, for iodine <1 μg/L and 10 μg/L, respectively, for Cd and Hg <0·25 μg/L and 1·25 μg/L, respectively, for As <0·25 μg/L and 2·5 μg/L, respectively, and for Pb <0·25 μg/dL and 5 μg/dL, respectively.
Data analysis
All statistical analyses were performed using SPSS software, version 24 (IBM Corp.) and the R statistical environment with the R Commander package (version 2.9-5). Categorical variables are presented as frequencies and percentages, whereas continuous variables are presented as means and 95 % CI.
The normality of continuous variables was evaluated using the Kolmogorov–Smirnov test. Differences in concentrations across the four processing stages were assessed using repeated-measures ANOVA followed by paired t tests for pairwise comparisons. To examine differences in macronutrients, trace elements and heavy metal concentrations according to the type of freezing, paired t tests were employed. Associations between continuous variables were evaluated using Pearson’s correlation coefficient. All statistical tests were two-tailed, and a p-value < 0·05 was considered statistically significant.
Premature birth was defined as delivery before 37 weeks of gestation. HM was categorised by lactation stage as follows: colostrum (days 1–7 postpartum), transitional milk (days 8–14) and mature milk (≥15 d postpartum).
Results
A total of eighty-eight HM samples were analysed, corresponding to four samples from each of the twenty-two donors, one at each processing stage. The mean age of the donors was 33·8 years (95 % CI 31–36·7). The mean gestational age at delivery was 34·1 weeks (95 % CI 31·7–36·4), with 50 % of births classified as premature.
The average duration of lactation at the time of donation was 53·6 d (95 % CI 26·3–80·9). Based on lactation stage classification, five samples (22·7 %) were categorised as transitional milk and seventeen samples (77·3 %) as mature milk; no sample of colostrum was obtained.
Twenty-one donors completed a dietary questionnaire. Among them, one donor reported following an ovo-lacto-vegetarian diet, with appropriate supplementation of vitamin B12 and folic acid. Overall, 95·2 % of donors reported using vitamin and mineral supplements. Specifically, thirteen donors (61·9 %) received iodine supplementation, eleven (53·8 %) received Zn and Se and six (28·6 %) received Cu supplements.
Macronutrients
Macronutrient concentrations at the four processing stages are presented in Table 1. No statistically significant differences in macronutrient concentrations were observed across the four processing stages.
Concentration of different macronutrients and energy in the different stages of processing

Table 1. Long description
A table comparing macronutrient concentrations across different stages of milk processing. The table has five rows and five columns. The columns are labeled Fresh milk, Frozen −20 °C, Pasteurised, Frozen −80 °C, and p. The rows are labeled Fat (g/100 mL), Carbohydrates (g/100 mL), Proteins (g/100 mL), and Energy (kcal/100 mL). Each cell contains values for the respective macronutrient and processing stage. Notable trends include similar concentrations of fat, carbohydrates, proteins, and energy across the different processing stages, with no statistically significant differences observed.
* Test used: repeated-measures ANOVA.
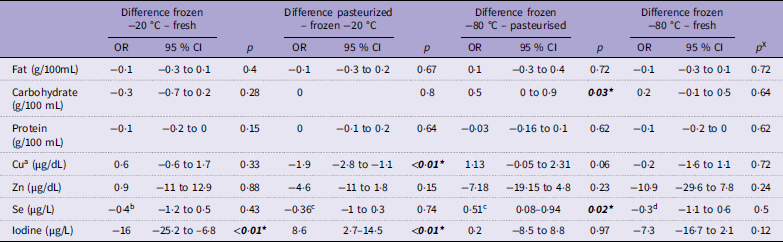
The effect of each processing stage was analysed independently (Table 2), showing a significant increase in carbohydrate concentration following freezing at –80°C, which may be attributable to insufficient sample homogenisation.
Effect of the three procedures performed on an HMB on the concentration of macronutrients and minerals

Table 2. Long description
The table has 10 rows and 12 columns. The columns are labeled as follows: Difference frozen -20 °C – fresh OR, Difference frozen -20 °C – fresh 95 % CI, Difference frozen -20 °C – fresh p, Difference pasteurized – frozen -20 °C OR, Difference pasteurized – frozen -20 °C 95 % CI, Difference pasteurized – frozen -20 °C p, Difference frozen -80 °C – pasteurized OR, Difference frozen -80 °C – pasteurized 95 % CI, Difference frozen -80 °C – pasteurized p, Difference frozen -80 °C – fresh OR, Difference frozen -80 °C – fresh 95 % CI, Difference frozen -80 °C – fresh p. The rows are labeled with the following variables: Fat (g/100 mL), Carbohydrate (g/100 mL), Protein (g/100 mL), Cu (µg/dL), Zn (µg/dL), Se (µg/L), Iodine (µg/L. Each cell contains numerical values representing the differences in concentration of the respective variable under different processing conditions.
HMB, human milk bank.
a Differences calculated for the twenty-one samples with detectable Cu values.
b Difference calculated for the fifteen samples with detectable Se values in HM before and after processing.
c Difference calculated for the fourteen samples with detectable Se values before and after processing.
d Difference calculated for the seventeen samples with detectable Se values before and after processing.
* Statistically significant value.
x Statistical test used: paired Student’s t test.
Regarding freezing at −20°C, a moderate, negative correlation (r = −0·631, p = 0·002) was observed between freezing duration and carbohydrate concentration (Figure 2). This correlation was not observed for the other macronutrients. No correlation was found between freezing duration at −80°C and any macronutrient.
Scatter plot. Correlation between freezing duration at −20 °C and carbohydrate concentration in HM frozen at −20 °C. HM, human milk.

Minerals
Mineral concentrations at the four processing stages are presented in Table 3. Statistically significant differences were observed between groups for paired samples in Cu and iodine concentrations.
Concentration of different minerals in the different stages of processing

Table 3. Long description
A table with five columns and five rows, including headers. The columns are labeled Fresh, Frozen -20 C, Post-HoP, Frozen -80 C, and p. The rows are labeled with different minerals: Cu (g/dL), Zn (g/dL), Se (g/L), and Iodine (g/L). Each cell contains values representing the concentration of minerals at different stages. Row 1: Cu (g/dL), N 21, Fresh OR 40.8, 95 % CI 33.5-48.1, Frozen -20 C OR 41.35, 95 % CI 33.6-49.1, Post-HoP OR 39.42, 95 % CI 31.6-47.3, Frozen -80 C OR 40.55, 95 % CI 33.4-48.1, p <0.01. Row 2: Zn (g/dL), N 22, Fresh OR 260.2, 95 % CI 189.6-330.7, Frozen -20 C OR 261.06, 95 % CI 197.2-324.9, Post-HoP OR 256.47, 95 % CI 192.5-320.4, Frozen -80 C OR 249.3, 95 % CI 187.2-311.4, p 0.22. Row 3: Se (g/L), N 14, Fresh OR 15.69, 95 % CI 14.3-17.1, Frozen -20 C OR 15.35, 95 % CI 14.1-16.7, Post-HoP OR 14.99, 95 % CI 13.7-16.3, Frozen -80 C OR 15.5, 95 % CI 14.3-16.7, p 0.09. Row 4: Iodine (g/L), N 22, Fresh OR 205.94, 95 % CI 148.1-199.8, Frozen -20 C OR 189.92, 95 % CI 137.8-242, Post-HoP OR 198.51, 95 % CI 145.7-251.3, Frozen -80 C OR 198.7, 95 % CI 142.2-255.1, p 0.02.
HoP, Holder pasteurization.
a Test used: repeated-measures ANOVA.
* Statistically significant value.
The effect on HM’s mineral concentration of the different stages of processing is shown in Table 2.
Heavy metals
The levels of the heavy elements analysed did not exceed the limit of quantification at any stage of the processing. Likewise, Cd and Pb were not detected at any point during the process.
Table 4 illustrates the detectability percentages of Hg and As throughout the different processing stages. Table 5 shows the concentrations of As and Hg across the different processing stages. Statistically significant differences between groups were observed for Hg concentrations.
Detectability of mercury and arsenic at the different points of processing

Table 4. Long description
The table presents data on the detectability of mercury (Hg) and arsenic (As) at four different points of processing: Fresh, Frozen at -20 degrees Celsius, Post-HoP, and Frozen at -80 degrees Celsius. The table has four rows and four columns. The columns are labeled as Fresh, Frozen -20 degrees Celsius, Post-HoP, and Frozen -80 degrees Celsius, each with sub-columns for count (n) and percentage (%). The row labels are Hg and As. Row 1: Hg, Fresh, n 13, percent 59; Frozen -20 degrees Celsius, n 14, percent 63.6; Post-HoP, n 14, percent 63.6; Frozen -80 degrees Celsius, n 6, percent 27.3. Row 2: As, Fresh, n 13, percent 59; Frozen -20 degrees Celsius, n 13, percent 59; Post-HoP, n 15, percent 68.2; Frozen -80 degrees Celsius, n 14, percent 63.6.
Concentration of heavy metals at the different stages of processing

Table 5. Long description
The table compares the concentrations of heavy metals, specifically Hg and As, across different processing stages. It has four columns and two rows. The columns are labeled as Fresh, Frozen -20 degrees Celsius, Post-HoP, and Frozen -80 degrees Celsius. The rows are labeled with the heavy metals Hg and As. Each cell contains the concentration range with OR and 95 percent CI values. For Hg, the concentrations are 0.3 with a range of 0.2-0.4 for Fresh, 0.3 with a range of 0.2-0.4 for Frozen -20 degrees Celsius, 0.3 with a range of 0.2-0.4 for Post-HoP, and 0.2 with a range of 0.1-0.3 for Frozen -80 degrees Celsius. For As, the concentrations are 0.4 with a range of 0.3-0.5 for Fresh, 0.4 with a range of 0.3-0.6 for Frozen -20 degrees Celsius, 0.4 with a range of 0.2-0.5 for Post-HoP, and 0.4 with a range of 0.3-0.5 for Frozen -80 degrees Celsius. The p-values for Hg and As are less than 0.001 and 0.34, respectively.
a Test used: repeated-measures ANOVA.
* Statistically significant value.
Discussion
This study aimed to evaluate the impact of each stage of routine processing in an HMB on the concentrations of macronutrients, trace elements and heavy metals in HM.
Macronutrients
The concentrations of the analysed macronutrients remained stable throughout the processing, indicating that the applied protocol was effective for the preservation of these nutrients.
The effects of storage at –20°C and HoP on macronutrient concentrations have been extensively investigated in recent years, with the fat fraction reported as the most affected(Reference García-Lara, Escuder-Vieco and García-Algar11–Reference Vieira, Soares and Pimenta13,Reference Păduraru, Zonda and Avasiloaiei15) ; however, these findings were not confirmed in the present study.
The duration of freezing at –20°C may represent an important factor influencing macronutrient stability. Notably, García-Lara et al. reported a progressive decline in carbohydrate concentrations over time, a trend that is consistent with our observations(Reference García-Lara, Escuder-Vieco and García-Algar11,Reference García-Lara, Vieco and De La Cruz-Bértolo12) . This diminution may be attributed to the gradual adsorption of carbohydrates onto the surfaces of storage containers, as previously suggested(Reference Lev, Gdalevich and Zisapel10).
The effects of HoP on the protein and carbohydrate composition of HM remain a subject of considerable investigation. Reported reductions in protein content range from 1 % to 12·5 %(Reference Escuder-Vieco, Rodríguez and Espinosa-Martos3,Reference Vieira, Soares and Pimenta13,Reference Piemontese, Mallardi and Liotto16–Reference Chang, Fang and Chang18) , while decreases in carbohydrate content have been documented between 0·2 % and 3 %(Reference Escuder-Vieco, Rodríguez and Espinosa-Martos3,Reference Vieira, Soares and Pimenta13,Reference Piemontese, Mallardi and Liotto16–Reference Espinosa-Martos, Montilla and De Segura19) . Notably, in most studies, including the present analysis, these changes do not attain statistical significance, a finding that aligns with the observations in our cohort.
Freezing at –80°C is widely regarded as the gold standard for the long-term preservation of HM, as it is thought to better preserve its nutritional and bioactive components compared with higher storage temperatures(Reference García-Lara, Escuder-Vieco and García-Algar11,Reference Orbach, Mandel and Mangel20) . However, limited data are available regarding its specific impact on macronutrient composition. In our study, freezing at –80°C did not result in a reduction in macronutrient concentrations. These findings contrast with those of Lev et al., who reported a significant decrease in both fat and carbohydrate concentrations following storage at –80°C(Reference Lev, Gdalevich and Zisapel10). In line with our findings, Orbach et al. (2019) reported stability in macronutrient concentrations during storage at –80°C, suggesting that freezing at this temperature may preserve the nutritional composition of HM(Reference Orbach, Mandel and Mangel20).
Trace elements
To date, there is a paucity of studies assessing the impact of routine processing of HM in HMB on trace elements content, with the majority of research concentrating primarily on the effects of HoP(Reference Mohd-Taufek, Cartwright and Davies14,Reference Da Costa, Do Carmo and Saunders21,Reference Davis, Lee and Hampel22) . Cu was the mineral most affected by HoP in our study, with a reduction of 4·7 %. These findings are consistent with those reported in the literature, showing a 4·5 % decrease in Da Costa et al. and a 7·9 % decrease in Davis et al.(Reference Da Costa, Do Carmo and Saunders21,Reference Davis, Lee and Hampel22) . Trace elements are not degraded; therefore, any observed decrease in their concentration may be attributed to the formation of microprecipitates and/or the formation of insoluble complexes(Reference Da Costa, Do Carmo and Saunders21,Reference Davis, Lee and Hampel22) . Zn and Se concentrations remained stable throughout processing, as observed in our study and previously reported in the literature(Reference Mohd-Taufek, Cartwright and Davies14,Reference Davis, Lee and Hampel22) . In our study, the marked reduction in iodine levels following freezing is noteworthy. Considering its solubility, this decrease may be attributable to conformational alterations induced by the thermal treatment. No previous studies evaluating iodine modifications during processing in HMB have been identified; therefore, further investigations to corroborate our findings are essential.
The observed changes in HM Cu concentration may warrant careful monitoring, particularly in preterm infants. Although severe Cu deficiency is uncommon, it has been associated with anaemia, neutropenia, thrombocytopenia and osteoporosis. Likewise, iodine is essential for thyroid hormone synthesis and normal growth and neurodevelopment. In this context, individualised HM fortification may help ensure adequate micronutrient intake and compensate for potential losses during milk processing(Reference Embleton, Jennifer Moltu and Lapillonne23).
Heavy metals
The presence of heavy substances in HM has been widely documented in the scientific literature(Reference Rebelo and Caldas24–Reference Oliveira, Rodrigues and Faria26). In the present study, Hg and As were detected in all samples; though, their mean concentrations remained below the acceptable limits established by the WHO(Reference Cherkani-Hassani, Ghanname and Mouane27). Although the processing of biological materials and their storage in plastic containers have been proposed as potential sources of increased concentrations of heavy metals(Reference Zhang, Chao and Tang28), our data did not demonstrate such an effect. Accordingly, processing following our operating procedures can be considered a safe practice.
Hg concentrations are generally reported to remain stable during frozen storage(Reference Sommer, Ward and Pan29), which contrasts with the results obtained in our study. The discrepancies observed may be related to the adsorption of Hg onto the surfaces of storage containers during prolonged freezing (mean of 98·6 d). Nonetheless, further research is required to confirm this hypothesis and to elucidate the mechanisms involved.
Conclusions
HM processing, including freezing at –20°C and –80°C and HoP, preserves the macronutrient profile (fat, protein, carbohydrates and energy) with no statistically significant alterations across processing stages. Freezing at –80°C storage maintained nutrient stability, confirming its suitability for long-term preservation.
Trace element analysis revealed minor yet significant reductions in Cu and iodine post-processing, likely attributable to microprecipitation or thermal-induced conformational changes, while Zn and Se remained stable.
Hg and As were consistently detected at concentrations below WHO safety thresholds, and processing did not induce accumulation, corroborating the biosafety of our HMB protocol.
Data availability statement
The data that support the findings of this study are available on request from the corresponding author. The data are not publicly available due to privacy or ethical restrictions.
Author contributions
A.R.-G.: Conceptualisation-Lead, Funding acquisition-Lead, Methodology-Lead, Writing – original draft-Lead, Writing – review and editing-Lead; M.S.-R.: Conceptualisation-Equal, Formal analysis-Equal, Supervision-Equal, Writing – original draft-Equal, Writing – review and editing-Equal; L.C.-G.: Formal analysis-Equal, Investigation-Lead, Methodology-Lead, Writing – original draft-Equal, Writing – review and editing-Equal; C.G.-L.: Formal analysis-Equal, Investigation-Equal, Writing – original draft-Equal; M.T.P.-N.: Investigation-Equal; N.A.-G.: Investigation-Equal; B.P.-G.: Conceptualisation-Equal, Formal analysis-Equal, Investigation-Equal, Writing – review and editing-Equal; G.S.-S.: Conceptualisation-Equal, Methodology-Equal, Writing – original draft-Lead, Writing – review and editing-Lead.
Financial support
This work was supported by Ernesto Sánchez Villares´ foundation.
Competing interests
The authors declare none.
Ethical standards
This study was conducted according to the guidelines laid down in the Declaration of Helsinki, and all procedures involving human subjects were approved by the Healthcare Ethics Committee of the Principality of Asturias (code 2023.399). Written informed consent was obtained from all participants.
Declaration of generative AI and AI-assisted technologies in the writing process
During the preparation of this work, the author(s) have not used artificial intelligence.







 Open access

