Introduction
Central line-associated bloodstream infections (CLABSI) are a major contributor to morbidity and mortality among hospitalized patients and are a focus of nationwide quality initiatives. Reference Burke1 Despite substantial investment by health systems, CLABSIs remain a threat to hospitalized patients who require central venous access. Reference Stevens, Geiger, Concannon, Nelson, Brown and Dumyati2,Reference Digiovine, Chenoweth, Watts and Higgins3
Initiatives for reducing CLABSIs are generally applied broadly to all patients with central venous catheters, Reference Buetti, Marschall and Drees4,Reference Pisney, Camplese, Greene, Saint, Fowler and Chopra5 many of whom may be at low risk of CLABSI. Technological advances in catheter devices and dressings, performance improvement initiatives related to catheter insertion and maintenance techniques, and efforts to rapidly remove unnecessary catheters may be effective Reference Buetti, Marschall and Drees4 but are difficult to maintain across large hospital systems and require large resource investments. The ability to predict which patients are at highest risk of developing CLABSI at time of catheter insertion would allow for more proactive and directed approaches, wherein the most effective tools can be applied at a higher intensity by a smaller number of stakeholders. While others have developed predictions tools for CLABSI, these tools have generally used large, non-granular databases (ie those lacking detailed patient-level data) and relied on administrative codes for identification of CLABSI Reference Tabaie, Orenstein, Nemati, Basu, Clifford and Kamaleswaran6–Reference Rahmani, Garikipati and Barnes9 —which have been found to be poorly predictive resulting from low sensitivity. Reference Bond, Issa, Nasrallah, Bahroloomi and Blackwood10 Some have explored the risk of development of CLABSI over time, but this may identify high-risk catheters too late and after opportunities for CLABSI prevention have passed. Reference Beeler, Dbeibo and Kelley11
In the present study, we utilized readily available electronic health record (EHR) data from three hospitals to predict CLABSI. We hypothesized that data from the peri-insertion period can be used to identify central lines at higher risk for the future development of CLABSI and could be leveraged to guide performance initiatives.
Methods
Setting and patients
The study was conducted at three urban hospitals part of the Montefiore Medical Center. Data were included from 2017 through 2022. All adult patients (≥18 years old) who had a central venous catheter inserted while admitted to the hospital were included. The study was approved by the Einstein Institutional Review Board (IRB # 2022-14186).
Exposures and outcomes
The primary exposure was the central line insertion event. Central lines were defined by any percutaneously placed intravenous catheter, where the tip extends into the central circulation. The primary outcome was the occurrence of CLABSI. CLABSI events were identified by the institutional infection prevention and control team and reported as part of national reporting requirements. For CLABSI events in which more than one central line was in place, the CLABSI was attributed to all lines in place ≥48 hours. CLABSI definitions followed standards as put forth by the Centers for Disease Control and Prevention National Healthcare Safety Network (https://www.cdc.gov/nhsn/).
Data collection
CLABSI events were collected from the institutional epidemiology quality improvement database. The denominator of central line insertion events was obtained from the hospital EHR using digital data extraction techniques based on a Lines, Drains, and Airways flowsheet. Of note, the brand and type of dialysis catheter or other catheters were not available in the flowsheet for abstraction. Potential predictors of CLABSI were selected by the author group based on review of existing literature. These predictors were also abstracted from the EHR. Detailed information on all abstracted variables, including missing data, can be found in the data supplement (Supplement Table S1). Overall, missing data were rare (<1%) for all included variables.
Statistical analysis
Data processing
All analyses were performed using the catheter as the event of interest (as opposed to patient-level). The full cohort was randomly separated into training (75% of the cohort) and testing (25% of the cohort) sets. Stratified sampling was used to ensure a balanced distribution of the minority case (CLABSI-associated catheters) between the training and the testing set. Missing values for continuous variables were imputed using normal values. Reference Seymour, Liu and Iwashyna12,Reference Seymour, Kahn, Cooke, Watkins, Heckbert and Rea13 Vital sign and laboratory values were normalized to have a standard deviation of 1 and a mean of 0 based on data from the training set.
Modeling and prediction
The prediction of CLABSI was performed using three different models—LASSO (least absolute shrinkage and selection operator) regression, random forest, and gradient-boosted machine (GBM). These approaches were selected for consistency with prior studies on this topic and were assessed as most appropriate by the study authors. A regression model (LASSO) was included as one of the approaches as the estimated regression coefficients following regression are highly interpretable to the user and can be used to identify high-risk insertions without need for implementing a more complex machine learning algorithm. A LASSO model is a penalized logistic regression model that controls for overfitting by shrinking model coefficients toward zero. Less impactful factors will frequently be shrunk to zero and only the strongest predictors will remain in the final model. Random forest and gradient boosted machine are tree-based, machine learning models. Random forest builds decision trees in parallel and averages across trees. Gradient boosted machine models are based on sequentially generated trees, with each tree learning from the residuals of the prior tree such that poorly predicted observations (ie with large residuals) will be increasingly focused on in subsequent trees.
The LASSO regression model was specified with the binary dependent variable of CLABSI/no CLABSI, and independent variables as identified in Table 1. Internal importance weights were used to address the imbalance in the outcomes by having the line insertion observations that developed CLABSI influence the model fitting procedure 100 times more than observations with no CLABSI. This decision was made to increase the impact of CLABSI-associated catheters on the models, given the low frequency of CLABSI in the cohort. The lambda (λ) shrinkage parameter was selected based on cross-validation to balance model accuracy and simplicity. Model coefficients are reported in the form of odds ratios with values >1.0 suggesting a higher odds of CLABSI.
Cohort characteristics

The random forest model was built using a q* classifier that optimizes the true positive rate and true negative rate instead of the misclassification rate given the imbalanced data. Reference O’Brien and Ishwaran14 The cost of misclassifying the majority case is the prevalence of infection and the cost of misclassifying the minority class is one minus the prevalence. This approach was selected as misclassification is rare when the event is rare and thus true negatives are very common. The random forest was constructed by splitting the data at each node using the feature that best maximizes the area under the received operating curve (AUC) and the performance was assessed with the geometric mean of the true negative rate and true positive rate. 5-fold cross-validation was performed and hyperparameter tuning was done using a grid-search technique for the training set. These steps help find the best settings for the model; the data was split into five parts, and the model was trained multiple times, each time leaving out one part to check accuracy. Different values for key model settings were tested in a systematic way to find the combination that worked best.
The GBM learning model used XGBoost to model the data. Max delta step hyperparameter was used to minimize the class imbalance’s effect on the model, a step necessary given that CLABSI is very uncommon in the cohort. The model was optimized for precision-recall area under the curve (PR AUC). 5-fold cross-validation was performed and hyperparameter tuning was done using a grid-search technique for the training set. Hyperparameters tested are max depth, learning rate, column sample by tree, subsample of training instances, minimum child weight or minimum sum of instance weight needed in child, max delta step, and gamma or minimum loss reduction required to make a partition on a tree leaf node. Similar to random forest, these steps help find the best settings for the model. Feature importance, the ranked degree to which each variable is important to the model, was assessed and presented graphically for both the random forest and the GBM models.
Model Performance was summarized using several different metrics including 1) the area under the receiver operating curve (AUC) which examines the balance between sensitivity and specificity of the model and gives the probability that an insertion that results in a CLABSI will have a higher predicted value compared to an insertion that did not result in a CLABSI, and 2) the area under the precision-recall curve which examines whether as recall (correctly identifying insertions that result in CLABSI) increases, the number of false positives remains low. Model performance was assessed at a 1% probability threshold for defining CLABSI based on the average predicted CLABSI rate.
Catheter insertion site was not included as an independent variable in the models as it was found to perfectly match the catheter type in some circumstances (ie peripheral vein and peripherally inserted central catheter). A sensitivity analysis was performed excluding central venous catheters placed in a femoral site. This sensitivity analysis was performed as placement of central venous catheters in a femoral site is discouraged by local hospital policies, and femoral-placed catheters are generally removed as soon as feasible.
Statistical program and packages
All analyses were performed using R statistics version 4.3.1. The R packages recipes, tidymodels, randomForestSRC, xgboost, and DALEX were used for data processing, LASSO modeling, random forest modeling, gradient-boosted tree modeling, and generating variable importance plots respectively.
Results
Study cohort characteristics
22,252 patients with 40,008 central venous catheters were included in the final cohort. Overall, 409 (1.02%) central venous catheters were associated with CLABSI. Cohort characteristics both overall and divided by CLABSI occurrence can be found in Table 1. Patients who developed CLABSI had longer ICU (median 13 [7, 23] days vs. median 5 [3, 11] days, P ≤ .001) and hospital lengths of stay (36 [23, 59] days vs. 11 [6, 20] days, P ≤ .001) as well as higher rates of hospital mortality (148 [46.98 %] vs. 5,054 [18.04 %], P ≤ .001).
CLABSI prediction
For all prediction purposes, results are presented for the testing dataset only. The AUC for all models are in Figure 1. The PR-AUCs for all models are in Supplemental Figure S1.
Area under the receiver operating curve for each model.

LASSO regression
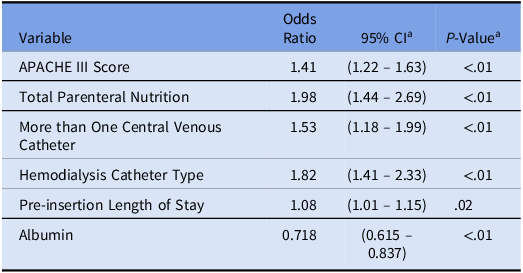
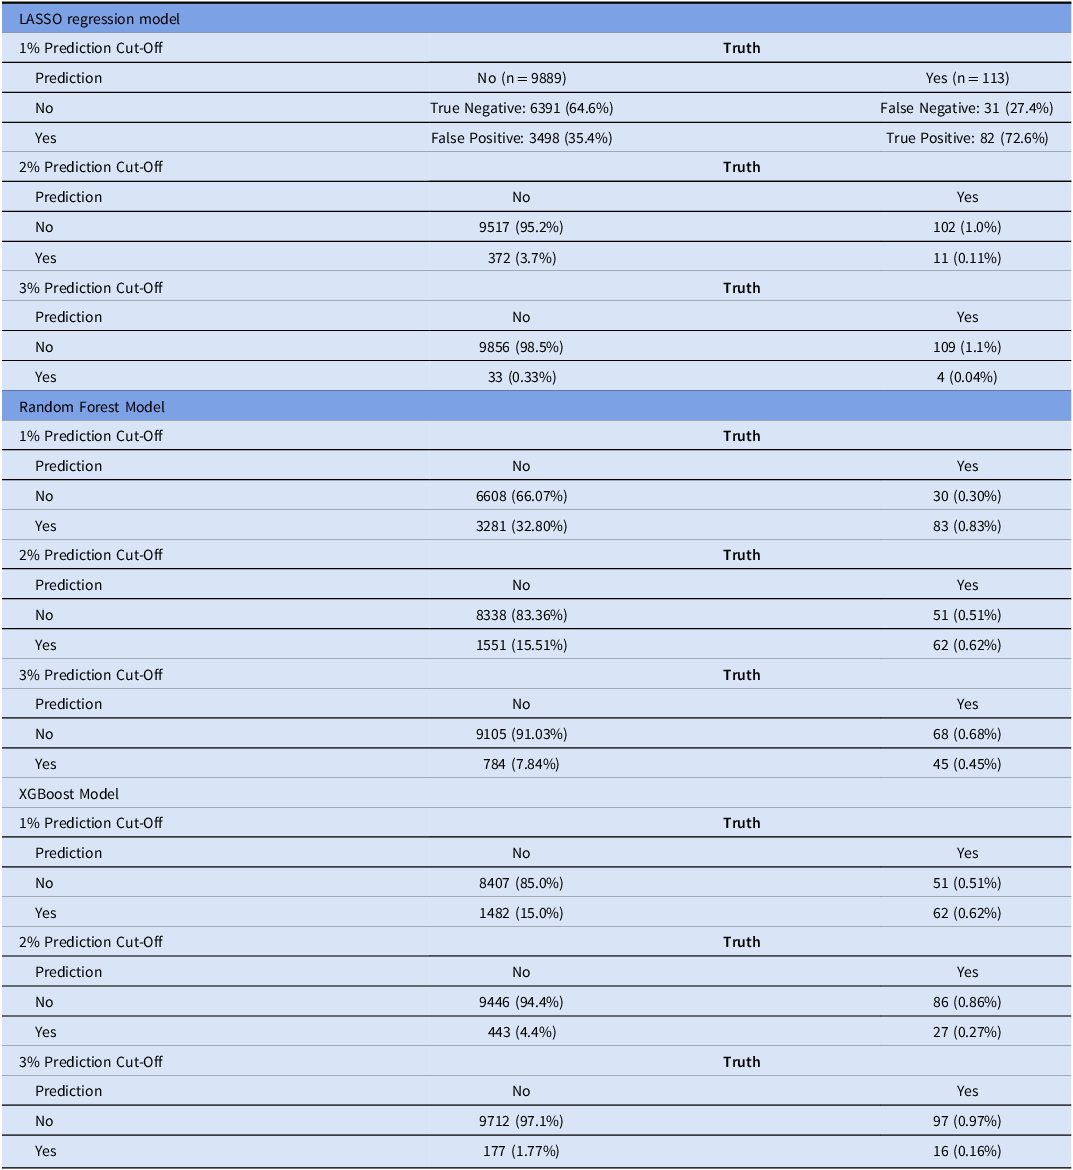
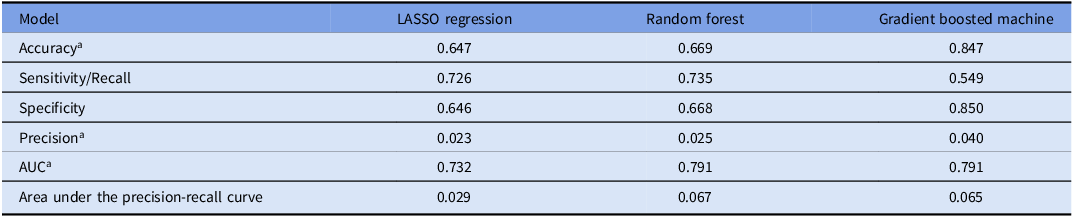
The LASSO regression model yielded an AUC of 0.732. The strongest predictors of CLABSI were a high APACHE III score, receipt of total parental nutrition, central catheter already in place (for a catheter inserted in a patient who already had another centrally inserted catheter in place), hemodialysis catheter type, the pre-catheter length of stay, and low albumin levels (Table 2). Confusion matrices for classifying a central venous catheter as being associated with CLABSI based on various prediction thresholds (1%, 2%, 3%) can be found in Table 3. Given a classification cut-off of 1%, model performance for the LASSO regression model can be found in Table 4. Hyperparameters used for the LASSO and other models can be found in Supplemental Table S3.
LASSO predictors

a Confidence intervals and P-values derived from standard logistic regression modeling without LASSO.
Confusion matrices at selected probability cut-offs

Model performance at 1% probability cut-off

a Accuracy = percent of correct predictions divided by total predictions; Precision = true positive predictions divided by all predicted positives; AUC is the area under the receiver operating characteristic curve.
Random forest
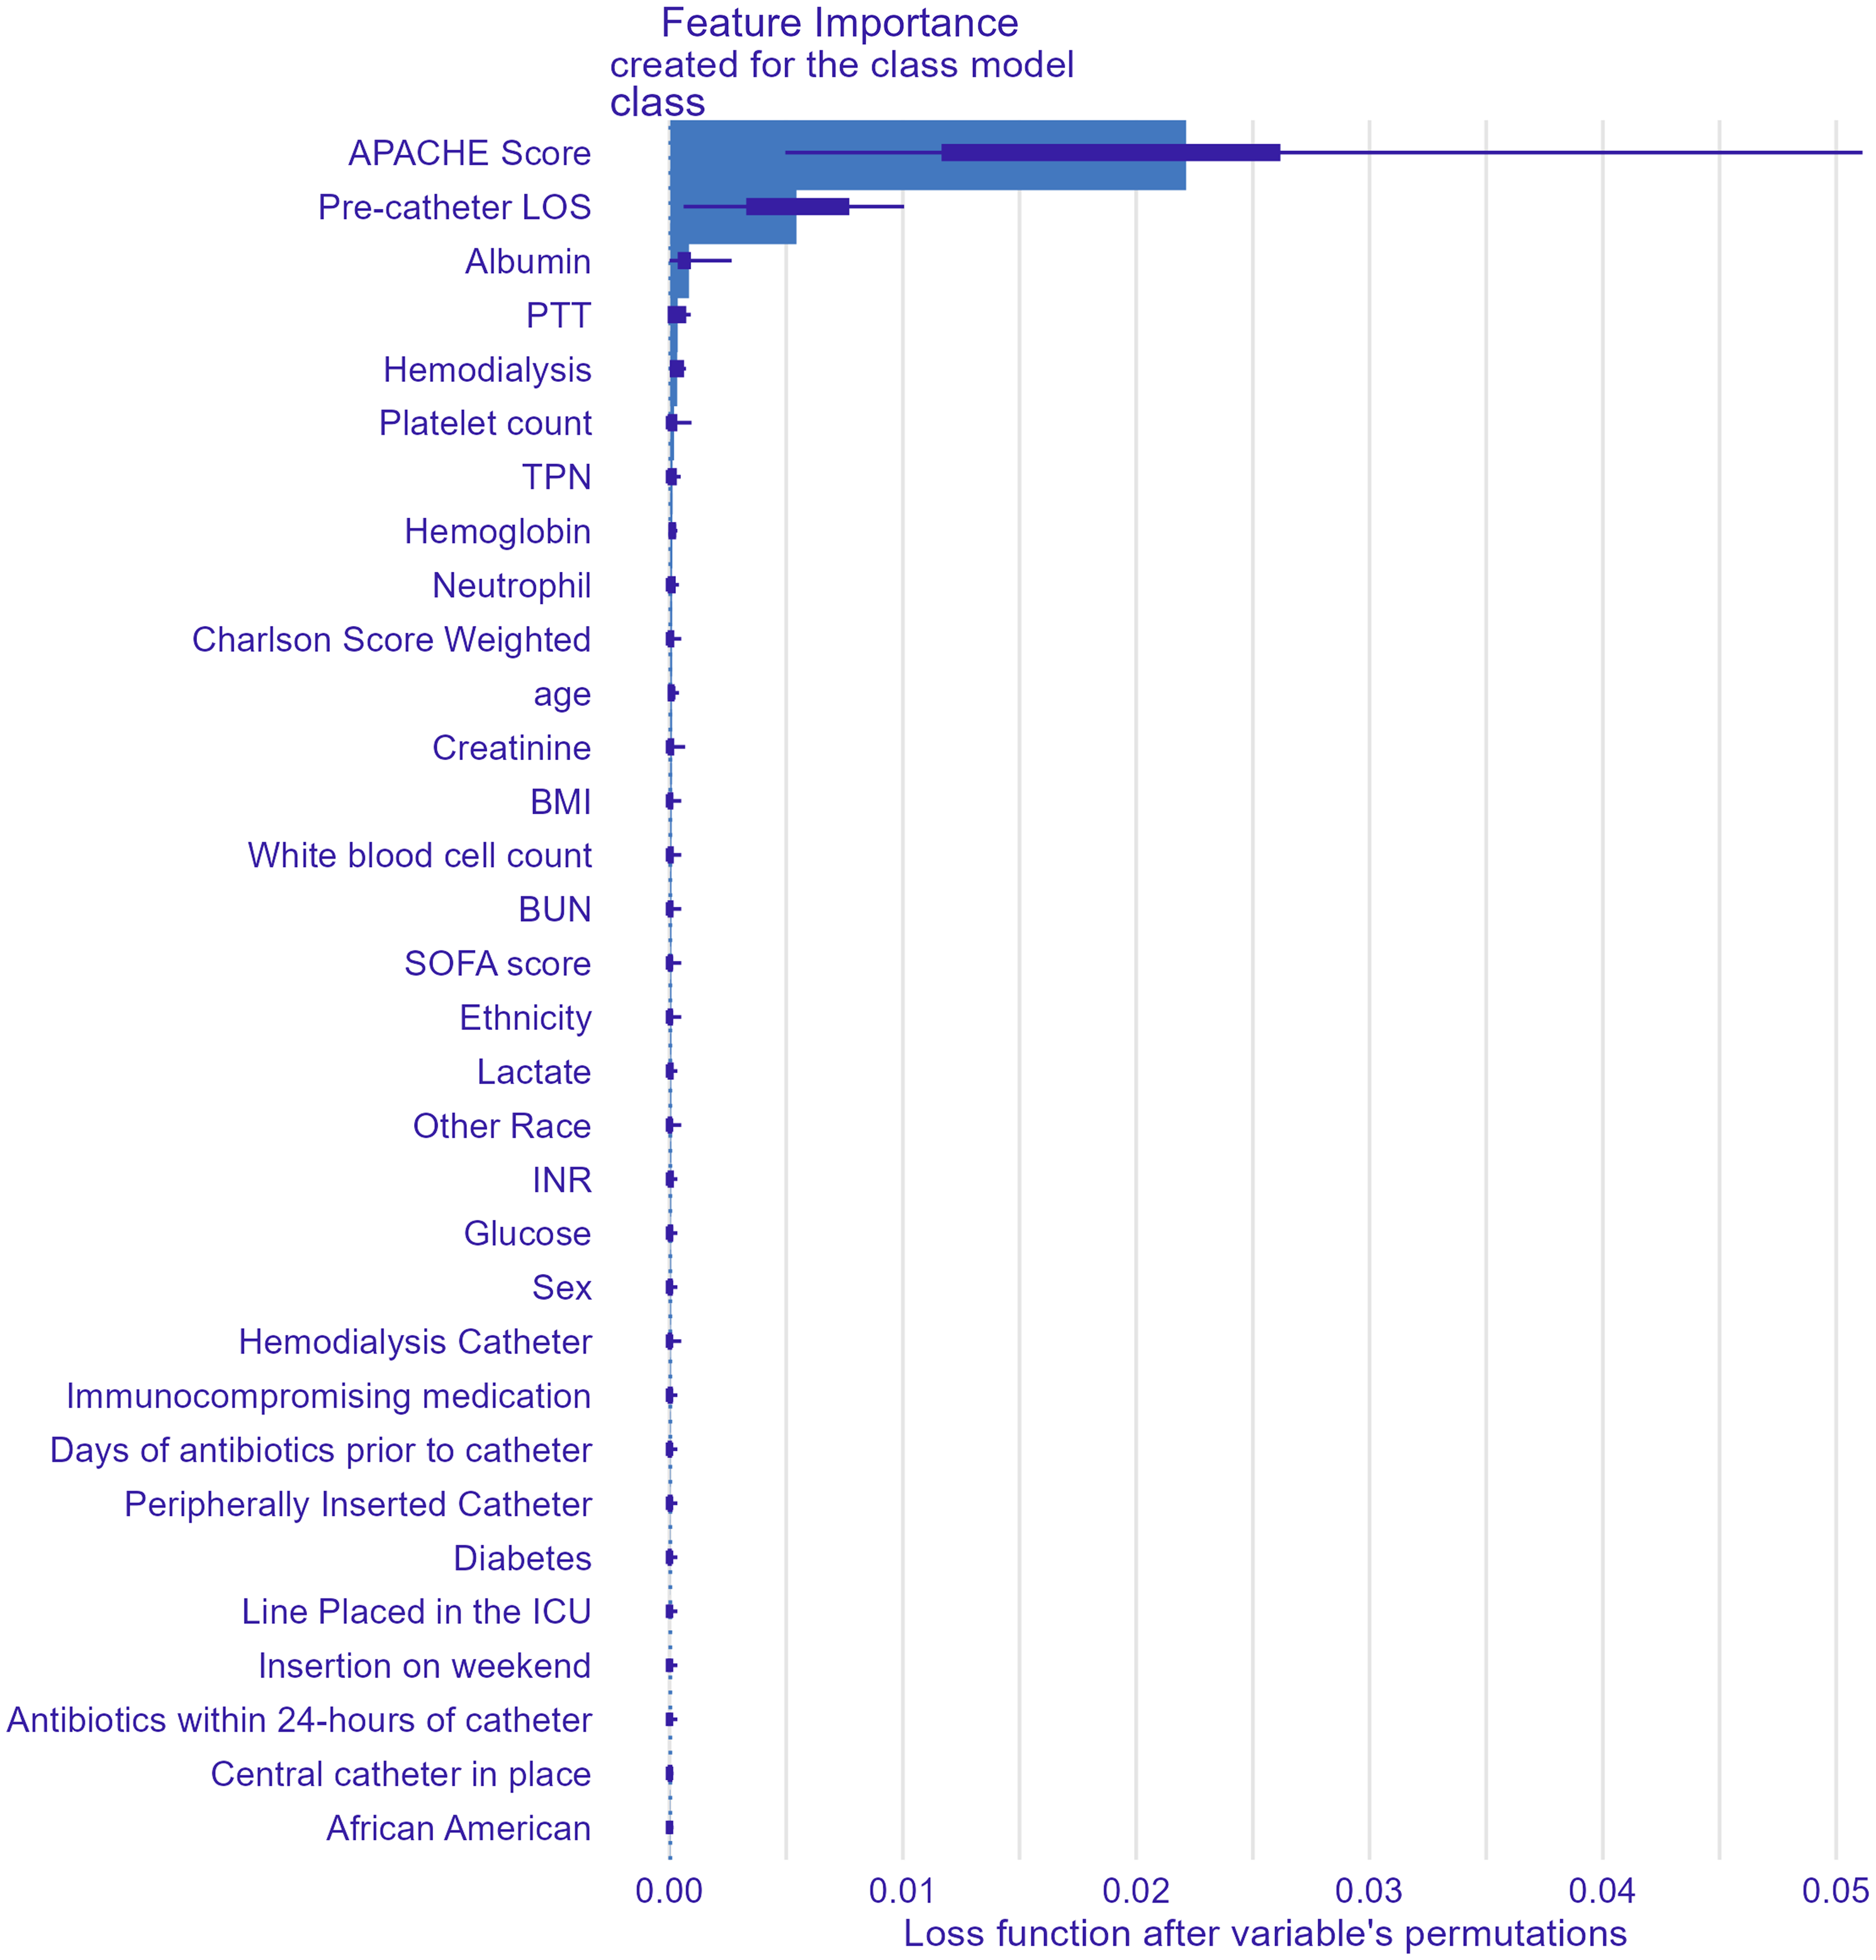
The random forest model yielded an AUC of 0.791. Key variables for the creation of the trees included APACHE III score, pre-insertion length of hospital stay, hemodialysis catheter type, receipt of total parental nutrition, and albumin level (Figure 2). Confusion matrices can be found in Table 3, with test characteristics under the selected 1% cut-off shown in Table 4.
Feature importance plot for the random forest model.

Gradient boosted machine (XGBoost)
The XGBoost model yielded an AUC of 0.791. Key variables for the creation of the trees included APACHE III score, pre-insertion length of hospital stay, hemodialysis catheter type, partial thromboplastin time, and receipt of total parenteral nutrition (TPN). Confusion matrices can be found in Table 3, with test characteristics under the 1% cut-off shown in Table 4. As compared to the confusion matrices for the LASSO and Random Forest models, the GBM model has fewer false positive identifications (at the 1% threshold, 15.0% false positives in GBM compared to 35.4% for LASSO and 32.8% for Random Forest). A feature importance plot can be found in Supplemental Figure S2.
Sensitivity analysis
A sensitivity analysis was performed excluding central venous catheters placed in the femoral location (cohort characteristics in Supplemental Table S3). Results of the models can be found in Supplemental Table S4. In the sensitivity analysis, the AUC of the XGBoost model was 0.769 and slightly higher than that of the random forest model.
Discussion
The present study explored three different approaches to CLABSI prediction and identified key CLABSI predictors including a higher APACHE III score, hemodialysis catheter type, a longer pre-insertion length of hospital stay, receipt of more than one central catheter, low albumin levels and receipt of total parental nutrition. While all three models boasted good prediction based on their AUC, these were likely inflated by the small minority class (CLABSI). The random forest model and the GBM models had higher AUCs (0.791) than the LASSO model (0.732).
Given the rare occurrence and numerous potential pathways to the development of a central venous catheter infection, the prediction of CLABSI is quite challenging. As seen in this study, we were not able to create a model with high levels of precision and recall for CLABSI prediction. The predictive power of our models, based on AUC, is similar to other studies conducted in this space. Recognizing the difficulty in predicting CLABSI, we have further explored the confusion matrices at several prediction thresholds. This work highlights important trade-offs that should be considered in the design of a performance improvement initiative aiming to get upstream in CLABSI prevention. For instance, if implementing a costly intervention (in terms of staff time [eg additional staff at the bedside to ensure sterile insertion technique], equipment expense [eg a silver/platinum-impregnated catheter]), a prediction threshold resulting in few false-positives (at the expense of more false-negatives) might be selected. An inexpensive intervention (eg a packet of hand sanitizer delivered with the insertion kit) might instead select a prediction threshold with many false-positives but few false-negatives—such that the intervention can be applied more broadly even if many who receive the intervention do not benefit. These trade-offs are key in considering how a more liberal prediction model with increased false positives might burden infection control teams in their daily work and potentially contribute to higher CLABSI rates from spread of focus too thin. Local CLABSI incidence should also be considered in this calculation as a higher baseline incidence of CLABSI will reduce false-positive rates.
Several prior studies have used machine learning techniques to predict CLABSI. Reference Bonello, Emani, Sorensen, Shaw, Godsay and Delgado7–Reference Rahmani, Garikipati and Barnes9,Reference Beeler, Dbeibo and Kelley11 In a study by Bonello et. al., predictors of bloodstream infection were identified in a single-pediatric intensive care unit (ICU). The authors predicted whether a bloodstream infection would occur in each 24-hour time-period and found key predictors that included an elevated maximum heart rate and an elevated temperature. Reference Bonello, Emani, Sorensen, Shaw, Godsay and Delgado7 While Bonello et. al. predicted the occurrence of bloodstream infection, other studies used administrative codes to identify CLABSI. Administrative codes have been found to be specific but not sensitive for the identification of CLABSI. Reference Bond, Issa, Nasrallah, Bahroloomi and Blackwood10 Only one study attempted to identify CLABSI based on the complex National Healthcare Safety Network definition—although the criteria were only applied retrospectively which is challenging. Reference Beeler, Dbeibo and Kelley11 A key strength of our study is the use of actual reported CLABSI events, which is unique among machine learning prediction models for CLABSI.
In addition, and unlike other studies in this space, we predicted CLABSI at the time of central venous catheter insertion. Predicting CLABSI after insertion, eg using elevated temperature or heart rate as in Bonello et. al., may be of limited utility as the prediction may just be of an infection that has already developed. Reference Bonello, Emani, Sorensen, Shaw, Godsay and Delgado7 Prediction of CLABSI at the time of insertion allows for performance improvement interventions for the insertion itself and allows maintenance phase interventions to begin sooner.
While the strengths of our study are outlined above, our findings should be interpreted in the context of several limitations. First, the study was conducted at three hospitals in a single system within a geographic area—this limits generalizability. Second, it is possible that other variables not included in our models may improve CLABSI prediction. Third, the approach taken in this study is aimed at predicting CLABSI at time of central venous catheter insertion, and the prediction models do not consider changes in patient condition over time. Fourth, the study spanned the years of the COVID-19 pandemic, during which many CLABSI prevention initiatives were halted, CLABSI rates rose above typical levels, and mortality for all patients was increased above baseline levels. Fifth, the reason and appropriateness of central venous catheter placement was not able to be determined. Sixth, the intent of the line (eg for TPN or dialysis) could only be determined by using post-insertion data, although strict limits were placed on definitions to maintain the link between insertion and the reason for insertion. Finally, the models have not been prospectively validated—however that is the next step for this initiative.
Conclusions
Prediction of future CLABSI at the time of central venous catheter insertion can guide process improvement initiatives. In this study, the random forest and GBM models had a higher AUC than LASSO regression, but LASSO coefficients may be more interpretable to the bedside clinician. The GBM model had fewer false positives than the other two models. Analysis of confusion matrices may identify prediction thresholds that could be adjusted based on specific needs and resources of a process improvement focus.
Supplementary material
The supplementary material for this article can be found at https://doi.org/10.1017/ice.2025.1
Financial support
Dr. Moskowitz is funded by the National Heart, Lung, and Blood Institute (R33HL162980).
Competing interests
None.