Implications
The model developed in the companion paper (Symeou et al., Reference Symeou, Leinonen and Kyriazakis2014) and evaluated here predicts adequately the P digestion, retention and excretion of growing–finishing pigs for a wide range of dietary compositions and for pigs of different genotypes. Consequently, the model can be applied to develop feeding strategies to optimize phosphorus (P) utilization and minimize the different forms of P excreted to the environment. The model can be further improved, by considering ‘reactive’ as opposed to total phytate content of the diet, as well as experimentally establishing the net efficiency of digestible P utilization for growth and the non-phytate P absorption coefficient from the small intestine into the bloodstream, for pigs offered access to different diets.
Introduction
In a previous paper a deterministic, dynamic model, which accounts for the digestibility of dietary phosphorus (P) by growing and finishing pigs, and its fate as retained and excreted P, was developed (Symeou et al., Reference Symeou, Leinonen and Kyriazakis2014). The model enables the prediction of the effects of pig genotype and its interaction with diet on P retention, as well as the prediction of the form of P excreted, as soluble and insoluble P. These are important advances over existing models that predict P digestion (Létourneau-Montminy et al., Reference Létourneau-Montminy, Narcy, Lescoat, Magnin, Bernier, Sauvant, Jondreville and Pomar2011) or P retention (Fernandez, Reference Fernández1995; Dias et al., Reference Dias, Lopez, Moreira, Schulin-Zeuthen, Vitti, Kebreab and France2010). The developed model allows for the simultaneous testing of a range of variables, and enables the formulation of diets with high P digestibility, while supplying digestible P that closely matches pig requirements; therefore it enables minimization of P excreted.
Model behaviour was consistent with our current understanding of P digestion and retention (Symeou et al., Reference Symeou, Leinonen and Kyriazakis2014). When compared with British Society of Animal Science (BSAS, 2003) nutrient requirement standards, our model moderately over-estimated digestible P requirements for growing pigs, while for finishing pigs the same requirements were moderately under-estimated. The differences in estimated requirements may reflect differences in the methodology, and as a result before confidence can be placed on the predictions of the model, this needs to be evaluated. The scarcity of appropriate studies identified during model development resulted in an inherent uncertainty for the values of a number of model parameters. A sensitivity analysis of the predictions to changes in the main model parameters needed to be undertaken and this was the first aim of this paper. The second aim was to qualitatively and quantitatively compare model predictions with observations from the literature that were not used during model parameterization. The wider the circumstances under which model predictions can be tested, the more confidence can be applied on the appropriateness of the model concepts, the accuracy of parameters upon which it is based and the relevance of its predictions (Black, Reference Black1995).
Material and methods
Sensitivity analyses
A reference pig genotype and diet were chosen as the starting point for the sensitivity analysis. The reference diet used is described in the Supplementary Material S1. The reference (default) pig genotype used in the sensitivity analysis was characterized by BSAS (2003) as being of ‘intermediate growth’ with 40 and 48 kg protein (Pr m ) and lipid (L m ) at maturity, respectively, and a 0.01175 Gompertz growth rate parameter (per day). The in silico pig was simulated to grow from 30 to 60 kg BW and was given an ad libitum access to food and water.
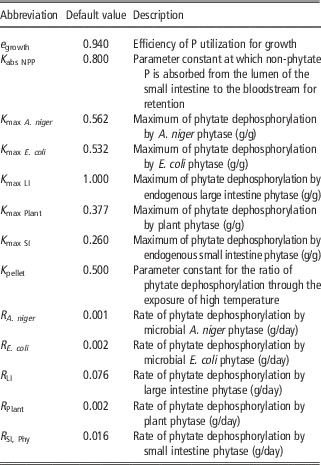
A sensitivity analysis was undertaken to evaluate the effect of variation in the values of the model parameters given in Table 1 on model outputs, in terms of P retained, total P and soluble P excreted (Vagenas et al., Reference Vagenas, Bishop and Kyriazakis2007). The sensitivity analysis was performed using ±20% change in the investigated default value parameter, while keeping all other parameters constant. The only exceptions were the analysis for the effects of the efficiency of P utilization (e growth) and the maximum phytate P (oP) dephosphorylation by endogenous large intestine phytase (K max LI), since their default values were 0.94 and 1, respectively. The excreted soluble P is the desired trait to measure, because water soluble P excretion represents the highest potential risk for losses by runoff in agricultural fields causing eutrophication (Maguire et al., Reference Maguire, Dou, Sims, Brake and Joern2005).
Abbreviation, descriptions, default values and units of parameters used by the model

Model evaluation
Independent data sets of published experiments were used to evaluate model performance based on graphical comparisons and statistical analysis. Model performance was evaluated on the basis of the goodness-of-fit of the observed against the predicted P digested, P retained, total and soluble P excreted as g/day. The literature studies selected for evaluation purposes were based on the following criteria: (1) they used growing–finishing pigs within the range of ~20 to 120 kg BW; (2) pigs grew in a thermo-neutral environment and no environmental stressors were assumed to be operating (Wellock et al., Reference Wellock, Emmans and Kyriazakis2004); and (3) the studies provided information at least on P intake, digestible and excreted P in the faeces, and when possible, information on retained P, total and soluble P excreted. Preference was given to studies that contained more than one treatment in addition to the control, as this allowed for systematic exploration of the model.
Studies that met the above criteria were used in the evaluation process to test for the effect of: (1) inclusion of inorganic P (Ekpe et al., Reference Ekpe, Zijlstra and Patience2002; Lopes et al., Reference Lopes, Moreira, Kebreab, Vitti, Abdalla, Crompton and France2009); (2) different levels of phytate in the diet (Trujillo et al., Reference Trujillo, Lindemann and Cromwell2010); (3) Aspergillus niger and Escherichia coli phytase supplementation (Akinmusire and Adeola, Reference Akinmusire and Adeola2009; Jendza and Adeola, Reference Jendza and Adeola2009; Poulsen et al., Reference Poulsen, Carlson, Nørgaard and Blaabjerg2010; Trujillo et al., Reference Trujillo, Lindemann and Cromwell2010; Almeida and Stein, Reference Almeida and Stein2012); (4) different levels of dietary Ca (Poulsen et al., Reference Poulsen, Carlson, Nørgaard and Blaabjerg2010; Stein et al., 2011). For detailed description of these studies, see Supplementary Material S2. The observed feed intakes of these experiments were treated as inputs to the model. In the few occasions where pigs were fed above their requirements, as in the experiments of Ekpe et al. (Reference Ekpe, Zijlstra and Patience2002), the pig genotype values were adjusted in order to treat the maximum P retention as an input, in the manner described by Wellock et al. (Reference Wellock, Emmans and Kyriazakis2003). When the studies used did not provide the analyzed oP and non-phytate P (NPP) contents of their diets, then their oP and NPP contents were estimated (Sauvant et al., Reference Sauvant, Perez and Tran2004).
The statistical package MODEVAL v1.1 developed by Smith et al. (Reference Smith, Smith, Powlson, McGill, Arah, Chertov, Coleman, Franko, Frolking, Jenkinson, Jensen, Kelly, Klein-Gunnewiek, Komarov, Molina, Mueller, Parton, Thornley and Whitmore1997) was used for the purposes of model evaluation in a series of statistical tests to assess their goodness-of-fit. (1) The correlation coefficients (r) is used to assess whether simulated values followed the same pattern as observed values, with the value of unity being the best fit. (2) The CV for the root mean square error (CV-RMSE) measures how close the predicted measurements are to the observed values.
The statistical significance of CV-RMSE was then assessed by CV-RMSE95%. A RMSE value greater than CV-RMSE95% suggests that the predicted values are not within the 95% confidence intervals of the observed data. (3) The relative error (E) determines the bias of the predicted results, which is the total difference between predictions and observations:
 $$E= {{\sum{{\left( {O_{i} {\minus}P_{i} } \right)} \over {O_{i} }}} \over n} {\times}100\,\%\,$$
where, E is the relative error (%), O i the observed value, P i the predicted value and n the number of observations. The closer to 0 the E value is, the less bias exists between predicted and observed results. A positive E value indicates under-estimation by the predictions and the opposite is the case for negative E values. The statistical significance of E was then assessed with E 95%. An E value <E 95% indicates that the simulated values fell within the 95% confidence interval of the measurements.
Results
Sensitivity analyses
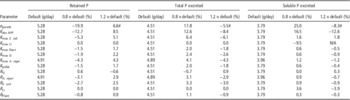
The results of the sensitivity analyses on retained P and total, soluble and insoluble P excreted are presented in Table 2.
Output of the sensitivity analyses performed when a specific model parameter was increased or decreased by 20%

Default outputs of the analyses performed were for a pig simulated to grow between 30 and 60 kg BW, having an ‘Intermediate’ BSAS (2003) pig genotype and offered a typical UK commercial diet. The sensitivity analysis outputs on retained P, total and soluble P are shown as the % change from the default values (Table 1).
#The default value of the efficiency of digestible P utilization was set at 0.94% and a 20% increase of this parameter was not possible, therefore it was set as unity.
Varying model parameters generally had small overall effects on P outputs, the exception being the e growth and the absorption coefficient of the NPP from the small intestine lumen (K abs NPP) parameters. A decrease of 20% in the e growth parameter resulted in ∼20% decrease in the P retained and 20% increase in the total and soluble P excreted. A 20% decrease in K abs NPP resulted in a 13% decrease in P retained, as well as 13% and 17% increase in the total and soluble P excreted, respectively. There was a smaller magnitude of change for the 20% increase in the K abs NPP parameter, compared with the 20% decrease. Smaller effects originated from the change in the parameter that defined the maximum oP dephosphorylation by endogenous large intestine phytase (K max LI); a reduction of 10% was achieved when this parameter decreased by 20% from its default value. On the other hand, the change in the maximum value of oP dephosphorylation by E. coli phytase (Kmax E. coli ) had a relatively small impact on the P retained and total P excreted. All other parameters investigated had <4% effect on model outputs when their values changed by ±20%.
Comparison of the model with published trials
The effect of increasing dietary levels of inorganic P
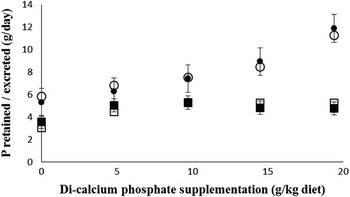
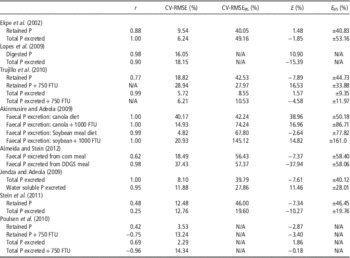
The graphical comparison between the experimental observations and the model predictions for Ekpe et al. (Reference Ekpe, Zijlstra and Patience2002) are shown in Figure 1, while their statistical comparisons are presented in Table 3. P retained increased with increasing inorganic P supplementation in a linear-plateau manner, while the total P excreted increased at a faster rate, once maximum P retained was achieved. The simulated values followed the same pattern as the observed results, with correlation coefficients of 0.88 and 1.00 for P retained and total P excreted, respectively. The predicted measurements were very close to the observed results, as shown by the low CV-RMSE for both P retained and excreted, which were smaller than the CV-RMSE95%, indicating that the simulated values fell within the 95% confidence interval of the measurements. An E value lower than E 95% also indicated that there was no bias in the simulations; as they did not consistently over- or under-estimate the predicted results compared with the observed values.
Comparison of experimental observations (■,●) by Ekpe et al. (Reference Ekpe, Zijlstra and Patience2002) to simulated predictions (□,○) for retained phosphorus (■,□) and total phosphorus (tP) excreted (●,○). Ekpe et al. (Reference Ekpe, Zijlstra and Patience2002) evaluated the effect of increasing dicalcium phosphate (iP) in pig diets (for details of the diets see ‘Material and methods section’.

The outcomes of the statistical analyses used to assess the goodness-of-fit between the simulated predictions against observed outcomes of experiments reported in the literature

r=correlation coefficient; CV-RMSE=CV of root mean square error; CV-RMSE95=95% confidence interval of CV-RMSE; E=relative error; E 95=95% confidence interval of E; DDGS=dried distillers grains with solubles.
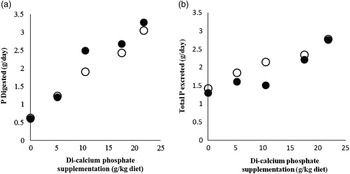
The experiment of Lopes et al. (Reference Lopes, Moreira, Kebreab, Vitti, Abdalla, Crompton and France2009) revealed that the P digested from the lumen of the small intestine into the bloodstream responded linearly to dicalcium phosphate supplementation and the response was in good agreement with the predicted results (Figure 2). The correlation between observed and predicted results for P digested and excreted were high, with correlation coefficients of 0.90 and 0.98, respectively (Table 3). The predicted measurements and observed results were close to each other and had a low CV-RMSE. Nevertheless, despite the low CV-RMSE, there was a high E, indicating that there was a bias in the predicted results. It can be seen from Figure 2 that there was an under-estimation of the P digested and an over-estimation of the total P excreted; this was particularly the case for one of the treatments. Lopes et al. (Reference Lopes, Moreira, Kebreab, Vitti, Abdalla, Crompton and France2009) did not provide standard errors of the observed results, therefore the RMSE95% and E 95% could not be calculated.
Comparison of experimental observations (●) by Lopes et al. (Reference Lopes, Moreira, Kebreab, Vitti, Abdalla, Crompton and France2009) to simulated predictions (○) for (a) digested phosphorus and (b) total phosphorus excreted. Lopes et al. (Reference Lopes, Moreira, Kebreab, Vitti, Abdalla, Crompton and France2009) evaluated the effect of increasing dicalcium phosphate using a radio isotopic experiment.

The effect of different levels of phytate in the diet
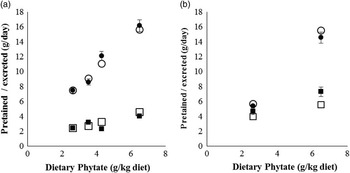
Trujillo et al. (Reference Trujillo, Lindemann and Cromwell2010) investigated the effect of different levels of phytate with or without the supplementation of 750 FTU of microbial A. niger phytase. The P retained and total P excreted without phytase supplementation increased with increasing phytate content of the diet, with the rate of the increase being similar between observed values and predicted results (Figure 3; Table 3). The correlation coefficient (0.99) between observed and predicted values suggested that the total P excreted was predicted well. However, the correlation coefficient for retained P was lower (0.77). The predicted P retained also had three times higher CV-RMSE than the CV-RMSE for total P excreted. Despite the larger CV-RMSE in P retained, the low E value indicated that there was no bias in the predictions, as there was no consistent over or under-estimation of the predicted results. As far as supplementation of 750 FTU phytase was concerned, the P retained for phytase supplementation had 4.7 times higher CV-RMSE, 29% as opposed to 6% for the total P excreted. The bias in the predictions was high for P retained when phytase was supplemented, with the predicted values being consistently under-estimated.
Comparison of experimental observations (■,●) by Trujillo et al. (Reference Trujillo, Lindemann and Cromwell2010) to simulated predictions (□,○) for retained phosphorus (■,□) and total phosphorus (tP) excreted (●,○). Trujillo et al. (Reference Trujillo, Lindemann and Cromwell2010) investigated the effects of different levels of phytate through the supplementation of rice bran, (a) without and (b) with 750 FTU of microbial Aspergillus niger phytase.

The effect of phytase supplementation
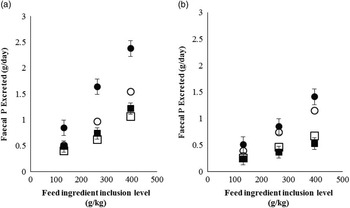
Akinmusire and Adeola (Reference Akinmusire and Adeola2009) investigated the effect of different levels of canola and soybean meals, with and without the supplementation of 1000 FTU E. coli phytase. From the graphical analysis of the results in Figure 4, it can be seen that the model predicts with high accuracy the faecal P excreted with and without phytase supplementation for the soybean-based diets. There was a very high correlation coefficient and low CV-RMSE between predicted and observed results for all these (Table 3). Nevertheless, the statistical analysis revealed that there was a bias in over-estimating the faecal P excreted when phytase was supplemented, as the E value was high (14.82%). While the model predicted accurately the faecal P excreted from the soybean-based diets, the model failed to predict accurately the response of faecal P excreted when the pigs were fed the canola-based diets. Despite the very high correlation coefficient between predicted and observed results for the canola-based diets (both with and without phytase supplementation), there was a very high CV-RMSE between predicted and observed results, especially in the diets without phytase supplementation. The later values in combination with the high relative error (E) suggested that there was a consistent and significant under-estimation of the predicted P excreted by the model for canola-based diets.
Comparison of experimental observations (■,●) by Akinmusire and Adeola (Reference Akinmusire and Adeola2009) to simulated predictions (□,○) for phosphorus excreted in the faeces. Akinmusire and Adeola (Reference Akinmusire and Adeola2009) studied the effect of P digestibility in semi-purified diets made of canola (●,○) and soybean meal (■,□) (a) without and (b) with 1000 FTU of microbial Escherichia coli phytase through the gradual supplementation of the feed ingredient investigated.

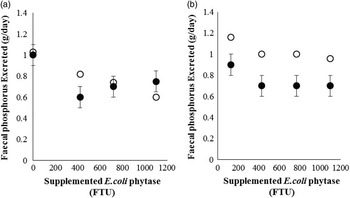
Almeida and Stein (Reference Almeida and Stein2012) examined the effect of graded levels of microbial E. coli supplementation on corn and dried distillers grains with solubles (DDGS)-based diets. The graphical comparison in Figure 5 illustrates that when compared with the observed data, the simulated results of faecal P excretion for corn-based diet were in closer agreement to the observed values than for the DDGS-based diets. Table 3 shows that the corn-based diet simulations had half the CV-RMSE compared with the DDGS-based diet simulations. The lower CV-RMSE implied closer predictions to the observed values for corn-based diets. Similarly, the simulated values for the corn-based diet had lower E values, indicating an absence of bias, while the opposite was the case for the values of the DDGS-based diets. Nevertheless, the statistical analysis also revealed that the simulated values of the corn-based diet did not follow the same pattern as the observed values (r=0.62), in comparison to the DDGS-based diets that had a very high correlation coefficient (r=0.98) between observed and simulated values.
Comparison of experimental observations (●) by Almeida and Stein (Reference Almeida and Stein2012) to simulated predictions (○) for phosphorus excreted in the faeces. Almeida and Stein (Reference Almeida and Stein2012) studied the effect of graded levels of microbial Escherichia coli phytase supplementation for (a) corn-based diet and (b) dried distillers grains with solubles (DDGS)-based diets.

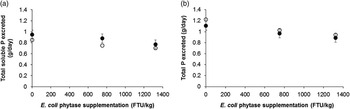
Jendza and Adeola (Reference Jendza and Adeola2009) tested the effect of graded levels of microbial phytase enzymes on soluble P excreted. The observed total and soluble P excreted were in good agreement with the predicted results with high correlation coefficients, 1.00 and 0.95, respectively (Figure 6). The low CV-RMSE of the predicted total and soluble P excreted indicated the closeness of the predicted to the observed values. In addition, both predicted total and soluble P excreted had low bias values, in comparison to the observed results.
Comparison of experimental observations (●) by Jendza and Adeola (Reference Jendza and Adeola2009) to simulated predictions (○) of (a) total soluble P excreted and (b) total P excreted at graded levels of microbial Escherichia coli phytase supplementation.

The effect of increasing dietary levels of Ca
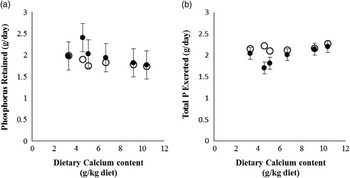
Stein et al. (Reference Stein, Adeola, Cromwell, Kim, Mahan and Miller2011) determined the effect of different dietary Ca levels on P retention and excretion in g/day. It can be seen from Figure 7 that the observed and predicted P retained decreased with increasing dietary Ca. The relatively poor agreement in the rate of change in P retained and excreted between observed and predicted was reflected in the low correlation coefficients, of 0.48 and 0.25, respectively (see Table 3). Despite the predicted measurements not being able to follow the same pattern as the observed results, there were low CV-RMSE and E values, for both retained and excreted P, indicative of the lack of bias and closeness of fit between predicted and observed values.
Comparison of experimental observations (●) by Stein et al. (Reference Stein, Adeola, Cromwell, Kim, Mahan and Miller2011) to simulated predictions (○) of (a) retained P and (b) total P excreted at graded levels of dietary Ca.

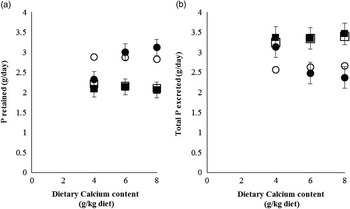
Finally, Poulsen et al. (Reference Poulsen, Carlson, Nørgaard and Blaabjerg2010) evaluated the effect of dietary Ca with and without microbial phytase supplementation in a plant phytate-rich diet. The simulated and observed data for P retained without phytase supplementation decreased with increasing dietary Ca content (r=0.42; Figure 8). When 750 FTU phytase was supplemented the observed P retained increased with increasing dietary Ca, but this was not the case for the predicted values (r=−0.75). The predicted P retained without phytase supplementation had 3.75 times lower CV-RMSE than the predicted P retained with phytase supplementation, compared with the observed values. Increasing the dietary Ca content caused an increase in the total P excreted in both observed and predicted values for the unsupplemented diet, with a relatively high correlation coefficient (r=0.69). The opposite was the case for the phytase supplemented diets as far as total P excreted was concerned (r=−0.96) between observed and predicted results.
Comparison of experimental observations (■,●) by Poulsen et al. (Reference Poulsen, Carlson, Nørgaard and Blaabjerg2010) to simulated predictions (□,○) of (a) retained P and (b) total P excreted. They investigated the effects of different levels of dietary calcium, with (●,○) and without (■,□) 750 FTU of microbial Aspergillus niger phytase and the diet had 600 FTU/kg diet plant phytase activity.

Discussion
Sensitivity analysis
The sensitivity analysis revealed that only four parameters were able to influence model outcomes to a major extent. Model parameters e growth and K abs NPP had a big effect on the predictions of P retained, and total and soluble P excreted. The parameter dealing with the maximum oP dephosphorylation by E. coli phytase (K max E. coli ), influenced only the predictions for P retention and total P excreted, but not soluble P excreted. Finally, the maximum oP dephosphorylation by large intestine phytase (K max LI) parameter influenced the predictions only for the different forms of P excreted, that is, soluble and insoluble.
The e growth parameter determines the amount of digestible P retained in the body. Therefore, it has a direct impact on urinary P excreted and determines requirements. A lower value of e growth would result in a higher excretion of soluble P through the urinary tract, as well as higher requirements for digestible P. We have previously stated that despite the importance of estimating this parameter accurately, it is very surprising that there is considerable uncertainty over its value and how this is affected by the animal intrinsic factors, such as BW, sex and genotype. In this model owing to lack of existing data on its variation, the value of this parameter was kept constant across these factors, in line with Sandberg et al. (Reference Sandberg, Emmans and Kyriazakis2005).
Decreasing the value of K abs NPP in the model resulted in a reduction of NPP absorbed into the bloodstream; as a result less digestible P was available for retention. The NPP not absorbed into the bloodstream is excreted through the faeces and as a consequence there is an amount of soluble P being excreted in them (Jendza and Adeola, Reference Jendza and Adeola2009). Interestingly, when the value of the K abs NPP parameter was increased the percentage change in the investigated model outputs was smaller than when this parameter decreased. This demonstrates the fact that the model outputs were relatively insensitive to the mechanism of P absorption (i.e. passive or active). The effect of an increase in the parameter is the result of digestible P intake exceeding the maximum P retention. A 20% higher K abs NPP coefficient meant that there was an increase in the digestible P, which could not be retained and was excreted as soluble P under the default conditions used (Ekpe et al., Reference Ekpe, Zijlstra and Patience2002).
A reason for K max A. niger not exhibiting a major influence on model predictions, compared with the influence of K max E. coli , is owing to the fact that the model assumes that the rates of oP dephosphorylation are different among commercial phytases (Symeou et al., Reference Symeou, Leinonen and Kyriazakis2014). Because more oP is dephosphorylated with E. coli compared with A. niger at the default phytase activity (750 FTU), the same level of change in the parameters had a greater impact on model outputs when E. coli, as opposed to A. niger phytase was supplemented (Symeou et al., Reference Symeou, Leinonen and Kyriazakis2014).
The final parameter with a major effect in the sensitivity analysis was K max LI, resulting in a 10% change in soluble P excretion. This is because the endogenous large intestine phytase has a major role in oP dephosphorylation (Sandberg et al., Reference Sandberg, Larsen and Sandström1993; Fan et al., Reference Fan, Archbold, Sauer, Lackeyram, Rideout, Gao, de Lange and Hacker2001). The dephosphorylated oP in the large intestine does not play an important role in P retention, because the resulting NPP is not absorbed into the bloodstream from the large intestine (Jongbloed et al., Reference Jongbloed, Mroz and Kemme1992; Peerce, Reference Peerce1997) and is excreted as soluble P (Jendza and Adeola, Reference Jendza and Adeola2009). Therefore, an accurate quantification of oP dephosphorylation in the large intestine as a function of dietary Ca and other cations, such as Zn, Fe and Mn, and protein (Selle et al., Reference Selle, Ravindran, Cowieson and Bedford2011), is crucial in the prediction of the soluble and insoluble P excreted to the environment. More experiments are needed to provide more confidence in the value of the K max LI parameter.
Comparison of model with published trials
The model predicted very accurately the direction of response to inorganic P supplementation for digested, retained and total P excreted in the experiments of Ekpe et al. (Reference Ekpe, Zijlstra and Patience2002) and Lopes et al. (Reference Lopes, Moreira, Kebreab, Vitti, Abdalla, Crompton and France2009). The agreement with the experiment of Lopes et al. (Reference Lopes, Moreira, Kebreab, Vitti, Abdalla, Crompton and France2009) also gives some confidence in the value of 0.8 for the digestibility coefficient used in the model and on the assumption that in pigs there is little regulation of P digested from the lumen into the bloodstream.
The model also accurately predicted P retained and excreted for different dietary phytate levels in the experiment by Trujillo et al. (Reference Trujillo, Lindemann and Cromwell2010). The model, however, under-estimated the retained P and over-estimated excreted P at the highest level of phytate, while supplemented with phytase. The explanation for this inconsistency may lie in the fact that the first-order kinetics equation used to describe the relationship of oP dephosphorylation with A. niger phytase may not have been sufficiently sensitive to describe dephosphorylation at the high concentrations of dietary oP used, which were well beyond the oP concentration of normal, commercial diets.
The model only slightly under-estimated the effects of phytase addition to a corn–soya-based diet on soluble P excreted (Jendza and Adeola, Reference Jendza and Adeola2009). Such an under-estimation may imply that there was more phytate dephosphorylation in the large intestine than the model predicted. As the model was developed with the aim of predicting the different forms of P excreted, the relatively good agreement between observed and predicted values of P excreted is important. The major failures of the model were in its inability to predict accurately the P retention and excretion on the canola and DDGS diets supplemented with phytase and, to a lesser extent, on diets with low levels of Ca.
The model significantly under-estimated the faecal P excretion on canola-based diets, for the study of Akinmusire and Adeola (Reference Akinmusire and Adeola2009). This under-estimation by the predictions was the result of over-estimation of the P digested (data not shown). The over-estimation of predicted digested P could be attributed to: (1) lack of phytate digestion by dephosphorylation from the small intestine phytase or (2) the digestion coefficient used by the model to simulate the absorption of NPP from the lumen to the bloodstream was an over-estimate.
The model was developed on the basis that no Ca–NPP complexes would be formed in the small intestine, even though according to Létourneau-Montminy et al. (Reference Létourneau-Montminy, Narcy, Lescoat, Magnin, Bernier, Sauvant, Jondreville and Pomar2011) this is theoretically possible. The justification for this model assumption was the 11 times greater affinity of Ca to phytate, than to NPP (Luttrell, Reference Luttrell1993). In a realistic pig diet, there will always be enough phytate reaching the small intestine to form phytate–Ca in preference over NPP–Ca complexes.
The differences in the predictions of phytate dephosphorylation in canola- and soyabean meal-based diets (Adeola et al., Reference Adeola, Sands, Simmins and Schulze2004) may be due to the differences in the storage sites of phytate in the feed ingredients. In soybean seeds, oP is located within protein bodies distributed throughout the cotyledon tissue that constitutes 90% of the seed, while in canola, oP is found in globoids inside protein bodies situated in the radicle and cotyledons comprising about 80% of the seed (Blaabjerg et al., Reference Blaabjerg, Carlsson, Hansen-Møller and Poulsen2010). This has led some to suggest the term ‘reactive’ phytate in order to account for the inability of phytase to dephosphorylate plant phytate (Leske and Coon, Reference Leske and Coon1999). If the ingredients are needed to be classified in terms of the ‘reactive’ and ‘non-reactive’ phytate content, then this would impose additional requirements on the ‘sufficient’ description of the pig diet. Currently, we are not aware of a readily available feed evaluation test that will allow this, although a measurements of the solubility of phytate in pig diets may be one way forward (Létourneau-Montminy et al., Reference Létourneau-Montminy, Narcy, Lescoat, Magnin, Bernier, Sauvant, Jondreville and Pomar2011). Similarly, the fibre content of the diet may play an important role in this response, although currently we do not have any data available to test this effect.
The over-estimation of the predicted faecal P excretion for a DDGS-based diet, from Almeida and Stein (Reference Almeida and Stein2012), implies that there was an under-estimation of the predicted P digestion, compared with observations. Such an under-estimation of P digestion could be a reflection of the higher amount of P being actually present as digestible myo-inositol dihydrogen phosphate (IP), IP2 to IP5, in the case of DDGS, instead of the assumed, dominant IP6 that characterises the majority of P in plant-based feed ingredients (Zijlstra and Beltranena, Reference Zijlstra and Beltranena2009). The partial breakdown of IP6 in DDGS is usually the result of fermentation and drying process, from the production of fuel ethanol.
The model showed a moderate qualitative and quantitative agreement with the measured P retained and total P excreted of the studies of Stein et al. (Reference Stein, Adeola, Cromwell, Kim, Mahan and Miller2011) and Poulsen et al. (Reference Poulsen, Carlson, Nørgaard and Blaabjerg2010) who investigated the effects of different levels of limestone supplementation. The predicted and observed P retained in the study of Stein et al. (Reference Stein, Adeola, Cromwell, Kim, Mahan and Miller2011) followed the same pattern when limestone was supplemented, indicating that the model accurately predicted the effect that dietary Ca had on P retained and excreted. There was a linear decrease between limestone supplementation and P retained, attributed to the higher availability of Ca cations, acting as substrate for the formation of indigestible Ca–phytate complexes, therefore limiting the digestibility of P into the bloodstream for retention. In this study the P content of the diet was relatively low, explaining the negative effect of increasing Ca on P digestion.
Nevertheless, the model over-estimated the P retained and hence under-estimated the P excreted when phytase was supplemented at low dietary Ca content diets in the study of Poulsen et al. (Reference Poulsen, Carlson, Nørgaard and Blaabjerg2010). Such an over-estimation would be accounted for by the suggestion of Létourneau-Montminy et al. (Reference Létourneau-Montminy, Jondreville, Sauvant and Narcy2012), who stated that if not sufficient amount of dietary Ca is digested then digestible P cannot bind with digestible Ca for bone formation, therefore digestible P is excreted through the urinary tract. The model could not predict Ca digestion in adequate terms, but rather assumed that there was enough Ca digested for P retention to take place. Thus, the model would benefit from a more careful consideration and representation of Ca digestion and the interaction between dietary Ca and the different forms of P in the digestive tract of the pig.
Conclusion
The model satisfactorily predicts the pig responses in terms of P digested, retained and excreted to variation in: (1) inorganic P supply; (2) phytate; and (3) phytase. However, the model predicts less well pig responses to dietary supplementation with less conventional ingredients, such as canola meal and DDGS. Although the model is able to predict the effect of Ca supplementation on P digestion in Ca-abundant diets, there are inconsistencies in model predictions that may arise from the interactions between Ca and the different forms of P in the digestive tract. Currently, this is an area of research where effort is being directed (Selle et al., Reference Selle, Ravindran, Cowieson and Bedford2011). In conclusion, given its relative success in predicting accurate pig responses to dietary variations in P content, the model may be applied to develop feeding strategies to optimize P retention and minimize P excretion, therefore, decreasing the feed costs and the environmental impacts in growing and finishing pig operations.
Acknowledgement
The authors are grateful to the British Pig Executive (BPEX), a division of the Agriculture and Horticulture Development Board, for funding this project.