1. Introduction
Three-dimensional (3D) structures of proteins and nucleic acids provide insight into fundamental biological processes and play an important role in strategies for the rational design of drugs against human diseases. Methodologies for the determination of 3D protein structures thus play a central role in structural biology. Their development sets a pace for our understanding of life at the molecular level. When J. C. Kendrew and his colleagues beheld the first model of a 3D protein structure, they expressed their amazement in the words (Kendrew et al. Reference Kendrew, Bodo, Dintzis, Parrish, Wyckoff and Phillips1958): “Perhaps the most remarkable features of the molecule are its complexity and its lack of symmetry. The arrangement seems to be almost totally lacking in the kind of regularities which one instinctively anticipates, and it is much more complicated than has been predicted by any theory of protein structure.”
After 50 years, much of this excitement remains. On March 31, 2009, there were 56 751 experimentally determined structures of biological macromolecules available from the Protein Data Bank (PDB), the central repository of 3D structural data of proteins and nucleic acids (Berman et al. Reference Berman, Westbrook, Feng, Gilliland, Bhat, Weissig, Shindyalov and Bourne2000). This wealth of structures is the fruit of the efforts of a large number of curiosity-driven individual research groups, as well as recent large-scale ‘structural genomics’ projects that aim at supplementing the knowledge of the linear amino acid sequences of proteins by information on their 3D structure on a genome-wide scale (Chandonia & Brenner, Reference Chandonia and Brenner2006).
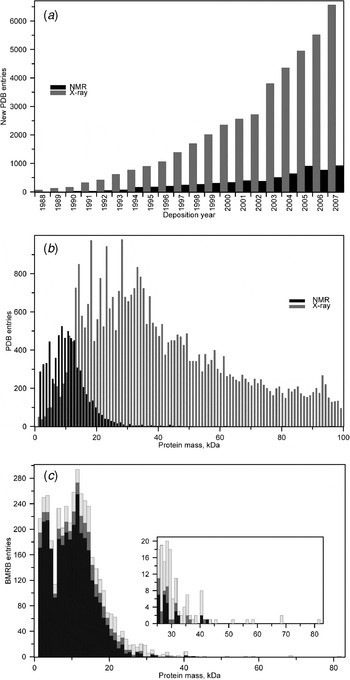
More than 99% of the 3D structures in the PDB were solved by X-ray crystallography or NMR spectroscopy, the two principal experimental methods for elucidating protein structures at atomic resolution. The number of new 3D structure depositions in the PDB has been rising nearly exponentially for many years (Fig. 1a). The distribution of X-ray or NMR protein structures as a function of the molecular mass (Fig. 1b) reveals the ‘size problem’ of NMR protein structure analysis: NMR has delivered, with few exceptions, only 3D structures of proteins smaller than 25 kDa. This is compounded by the observation from the Biological Magnetic Resonance Data Bank (BMRB) (Ulrich et al. Reference Ulrich, Akutsu, Doreleijers, Harano, Ioannidis, Lin, Livny, Mading, Maziuk, Miller, Nakatani, Schulte, Tolmie, Wenger, Yao and Markley2008) that obtaining nearly complete chemical shift assignments, which are required to solve a high-quality structure by NMR, is difficult for larger proteins (Fig. 1c). The reason for this is that spectra of larger polypeptides are more complex, with more signals and consequently more overlap within the same limited range of frequencies. Furthermore, larger proteins tumble slowly in solution, which results in broad, eventually not interpretable peaks in the spectra.
(a) Annual depositions of X-ray and NMR structures to the PDB 1988–2007 (Berman et al. Reference Berman, Westbrook, Feng, Gilliland, Bhat, Weissig, Shindyalov and Bourne2000). (b) Size distribution of X-ray and NMR structures in the PDB of January 2009. The molecular mass was calculated by summing up the mass of all protein atoms for which coordinates are provided. (c) Completeness of the assignments of backbone amide 1H and aliphatic 1H chemical shifts in the BMRB of January 2009 (Ulrich et al. Reference Ulrich, Akutsu, Doreleijers, Harano, Ioannidis, Lin, Livny, Mading, Maziuk, Miller, Nakatani, Schulte, Tolmie, Wenger, Yao and Markley2008). Completeness of the chemical shift assignments 10%–30%, black bars; 30%–70%, dark gray bars; 70%–90%, medium gray bars; more than 90%, light grey bars. The molecular mass was calculated by summing up the mass of all residues in the amino acid sequence. In the case of symmetric multimers, one monomer is considered. The inset provides an enlarged representation of the data for proteins greater than 25 kDa.

In recent years, NMR spectroscopy has been applied to biomolecular systems of ever increasing size. Transverse relaxation optimized spectroscopy (TROSY) provides sharper lines for amide and aromatic groups in large proteins (Pervushin et al. Reference Pervushin, Riek, Wider and Wüthrich1997). Polarization transfer schemes based on cross-correlated relaxation were developed for solution NMR with large molecules (Riek et al. Reference Riek, Wider, Pervushin and Wüthrich1999). Backbone assignments and global folds of a small number of proteins larger than 30 kDa could be derived on the basis of conformational restraints for amide and selected methyl groups (Mueller et al. Reference Mueller, Choy, Yang, Forman-Kay, Venters and Kay2000; Tugarinov et al. Reference Tugarinov, Choy, Orekhov and Kay2005). However, assignments and conformational data for other aliphatic or aromatic groups remain difficult to collect for proteins larger than 25 kDa.
It has long been recognized that labeling with the stable isotopes 2H, 13C and 15N can lead to simpler and more readily interpretable NMR spectra. The two principal strategies are to reduce the number of NMR-active nuclei in a molecule and to introduce additional NMR-active nuclei that resonate at different frequencies. Deuterium (2H) is a spin 1 nucleus that is not detected by most NMR experiments. Replacing hydrogen 1H nuclei by 2H simplifies the spectra by eliminating the corresponding signals and relaxation pathways. On the other hand, the nuclear spin-1/2 isotopes 13C and 15N make the otherwise undetectable carbon and nitrogen atoms visible for NMR. Spectral overlap of the crucial hydrogen (1H) signals can be resolved by spreading the peaks in additional dimensions indexed by the 13C and 15N resonance frequencies.
Many different approaches that rely on the labeling with stable isotopes have been devised and reviewed (Arrowsmith & Wu, Reference Arrowsmith and Wu1998; Gardner & Kay, Reference Gardner and Kay1998; Goto & Kay, Reference Goto and Kay2000; Kainosho, Reference Kainosho1997; Lian & Middleton, Reference Lian and Middleton2001; Ohki & Kainosho, Reference Ohki and Kainosho2008). Several of these methods are in widespread use in biomolecular NMR and have been instrumental for extending the original homonuclear NMR structure determination method (Wüthrich, Reference Wüthrich1986) beyond its size limit of about 100 amino acid residues.
Nevertheless, before the introduction of stereo-array isotope labeling (SAIL) labeling patterns and the approaches for achieving them have remained suboptimal. Only the SAIL method (Kainosho et al. Reference Kainosho, Torizawa, Iwashita, Terauchi, Ono and Güntert2006) achieved a complete stereospecific and regiospecific pattern of stable isotopes, which is optimal with regard to the quality and information content of the resulting NMR spectra. This review summarizes earlier labeling schemes for protein NMR in section 2 and gives a detailed overview of the SAIL method in the sections 3–6.
2. Stable isotope labeling strategies
2.1 Historical development of stable isotope labeling with proteins
Even at the dawn of biological NMR spectroscopy, when only one-dimensional (1D) continuous wave experiments were possible, stable isotope labeling techniques were recognized as powerful tools to overcome the difficulties in analyzing the NMR spectra of proteins (Jardetzky & Roberts, Reference Jardetzky and Roberts1981). However, even with the various labeling methods developed at the time, 1D NMR spectroscopy could not determine 3D structures of proteins. Rather, NMR was used to study local conformations, conformational changes, interactions, kinetics and dynamics of proteins. Although these experimental results obtained for proteins provided useful information about their functions and characteristics, corresponding 3D structures solved by X-ray crystallography were always needed for detailed discussions. In this sense, NMR was not an independent analytical tool in structural biology at that time. The two-dimensional (2D) NMR methods pioneered by Ernst's and Wüthrich's groups at ETH completely changed this situation (Ernst et al. Reference Ernst, Bodenhausen and Wokaun1987; Wüthrich, Reference Wüthrich1986). In the mid-1980s, a strategy to determine the 3D structures of proteins by 1H homonuclear 2D NMR was established (Wüthrich, Reference Wüthrich1986) that promoted NMR as an independent method for 3D structure determinations of biomolecules. Several years later, 1H-1H 2D NMR was extended to 3D and 4D multidimensional experiments for which new stable isotope labeling techniques were a prerequisite. The new method used triple-resonance NMR experiments with 13C- and 15N-uniformly labeled proteins. This progress meant that larger proteins could be analyzed by NMR.
In the past 15 years, numerous new experimental methods in the NMR field, including sample preparation, were proposed. A set of triple resonance experiments facilitates the chemical shift assignment of all 1H, 13C and 15N nuclei in proteins (Cavanagh et al. Reference Cavanagh, Fairbrother, Palmer, Skelton and Rance2006). Transverse relaxation optimized spectroscopy (TROSY) enables the NMR analysis of biomolecules larger than 100 kDa and their complexes (Pervushin et al. Reference Pervushin, Riek, Wider and Wüthrich1997). Heteronuclear (2H, 13C or 15N) relaxation studies provide information about the dynamics of biomolecules (Kay, Reference Kay2005). Pulse sequences to measure J-coupling constants provide torsion angle information. The direct observation of hydrogen bonds through the measurement of the values of small J-coupling constants yields new insights into protein structures and their interactions (Grzesiek et al. Reference Grzesiek, Cordier, Jaravine and Barfield2004). Molecules can be weakly aligned to provide structural information in the form of residual dipolar coupling constants, which are independent of NOEs (Prestegard et al. Reference Prestegard, Bougault and Kishore2004). Stable isotope labeling was indispensable for all these experiments. In parallel with such progress, NMR instrumentation has also greatly improved. Higher field magnets have been developed to provide better sensitivity and resolution. Today, 700–800 MHz instruments have become popular and are widely used, and 1 GHz instruments have become commercially available. Probe heads equipped with xyz-triple axis pulsed field gradient (PFG) coils achieve water suppression effectively and reduce the amount of phase cycling by choosing coherence transfer pathways in pulse sequences, resulting in shorter measurement times (Bax & Pochapsky, Reference Bax and Pochapsky1992). Cryogenic probes provide unprecedented sensitivity. These technological advances make it possible to study larger and more complex biological systems with NMR.
Several structural genomics and proteomics projects have been pursued around the world. As a result, NMR has become ever more important as a tool for studying protein structures, dynamics and interactions (Montelione et al. Reference Montelione, Zheng, Huang, Gunsalus and Szyperski2000; Staunton et al. Reference Staunton, Owen and Campbell2003; Yee et al. Reference Yee, Pardee, Christendat, Savchenko, Edwards and Arrowsmith2003; Yokoyama et al. Reference Yokoyama, Hirota, Kigawa, Yabuki, Shirouzu, Terada, Ito, Matsuo, Kuroda, Nishimura, Kyogoku, Miki, Masui and Kuramitsu2000). In these large-scale projects, high-throughput productivity is needed without compromising the structural quality. To satisfy these conflicting goals, stable isotope labeling methods and related technologies are continuously being developed further. In this section, we outline various stable isotope labeling techniques that have been developed before the introduction of the optimal isotope labeling by SAIL.
2.2 Early deuterium labeling
The resonance frequency of deuterium (2H) is distinct from that of 1H. Therefore, 2H does not disturb 1H NMR spectra. The replacement of 1H by 2H causes the 1H signal to disappear from the 1H NMR spectra. In this sense, deuterium labeling, or deuteration, is frequently called negative labeling. It is commonly used for labile protons that can in most cases be exchanged to 2H simply by dissolving the protein in 2H2O instead of 1H2O. Also the 2H labeling of non-labile protons was used early on as a powerful tool to simplify 1H 1D NMR spectra (Crespi et al. Reference Crespi, Rosenberg and Katz1968; Markley et al. Reference Markley, Putter and Jardetzky1968). In one of the first applications (Markley et al. Reference Markley, Putter and Jardetzky1968) with the protein Staphylococcal nuclease, only the amino acid types Trp, Met, Hδ1/Hδ2 of Tyr, Hδ2 of His, Hβ2/Hβ3 of Asn/Asp and Hγ2/Hγ3 of Gln/Glu were kept protonated, while all others were deuterated. Compared with the fully protonated protein, this 2H-labeled sample yielded strongly simplified 1D 1H-NMR spectra. By monitoring the simplified NMR spectra, the effects of calcium ions and the inhibitor 3′,5′-thymidine diphosphate on the protein structure could be analyzed. However, because of the difficult sample preparation, this stable isotope labeling method did not become popular at the time.
2.3 Random fractional 2H labeling
In addition to simplifying the spectra, 2H has another advantage in 1H 1D- and 1H-1H homonuclear 2D NMR experiments. Since 2H has a significantly lower gyromagnetic ratio than 1H, γ(2H)≈0·15 γ(1H), the presence of 2H reduces the number of 1H-1H dipolar spin relaxation pathways and of 1H-1H scalar couplings. As a result, deuterium labeling increases the spin-spin relaxation time and thus can lead to narrower and more intense NMR signals. A simple strategy, introduced in the 1980s, is random fractional 2H labeling by which the protons in protein samples are randomly replaced by deuterons. Thus, each protein molecule in the NMR sample tube has a different 2H labeling pattern. The summed signal from the protein molecules in the NMR sample yields spectra that are nearly identical to those of the fully protonated sample, except that the peaks are sharper. The clearer 1H 1D NMR spectrum of a randomly deuterated sample was reported for the 43-kDa Escherichia coli EF-Tu protein (Kalbitzer et al. Reference Kalbitzer, Leberman and Wittinghofer1985). In that case, about 90% of the 1H sites were replaced by 2H, dramatically enhancing the resolution in the 1H 1D NMR spectrum without 2H-decoupling. The utility of random 2H labeling in 1H-1H homonuclear 2D NMR was also examined (LeMaster & Richards, Reference LeMaster and Richards1988; Torchia et al. Reference Torchia, Sparks and Bax1988). Optimal results were observed with deuteration levels of 50%–75%. LeMaster and Richards achieved the chemical shift assignment for E. coli thioredoxin using about 75% random fractional deuteration (LeMaster & Richards, Reference LeMaster and Richards1988). This protein of 108 amino acid residues was then considered too large for analysis with 1H-1H homonuclear 2D NMR spectra. Their report clearly showed how 2H labeling could alleviate the molecular size limitation for NMR studies. A complication of random fractional deuteration is that the chemical shifts of the residual protons in random fractional deuterated proteins are slightly different due to the isotope shifts induced by deuteration, as described below.
2.4 Uniform 2H labeling
Uniform 2H labeling, or perdeuteration, was used for investigating protein-protein and protein-ligand complexes by 1H 1D and 2D NMR. In the case of a 1:1 complex, one of the subunits in the complex is completely labeled by 2H, and the other remains fully protonated. Thus, the 1H NMR signals from the protonated subunit can be observed selectively. Comparisons of the NMR data of the protein in the free and bound state provided information about the conformational changes upon complex formation and the structure of a subunit in the complex. For instance, the conformation change of the peptide melittin induced by complex formation with the Ca2+-binding protein calmodulin was monitored using perdeuterated calmodulin and unlabeled melittin (Seeholzer et al. Reference Seeholzer, Cohn, Putkey, Means and Crespi1986).
2.5 Uniform 15N labeling
In the late 1980s, the 2D NMR methods were extended to 3D NMR in order to separate unresolved signals in 1H-1H 2D NMR spectra. To reduce overlap in the 1H-1H plane, the 2D spectra were separated into multiple planes along another indirect dimension. Initially, the new, third axis was frequency labeled with 1H (Griesinger et al. Reference Griesinger, Sørensen and Ernst1987a, Reference Griesinger, Sørensen and Ernstb; Oschkinat et al. Reference Oschkinat, Cieslar, Holak, Clore and Gronenborn1989). Soon thereafter, Fesik and Zuiderweg realized the advantage of heteronuclear indirect detection for the third axis, using a 15N-labeled tripeptide (Fesik & Zuiderweg, Reference Fesik and Zuiderweg1988). 15N-edited (same as 15N-separated) COSY, NOESY and TOCSY experiments were introduced (Marion et al. Reference Marion, Kay, Sparks, Torchia and Bax1989) that provided much better peak separation than 1H-1H homonuclear 2D NMR. The concept for these 3D NMR pulse sequences was straightforward: a 1H-1H homonuclear 2D experiment was inserted into the detection period of a [1H,15N]-HMQC. Various modifications of the pulse sequences were introduced. HSQC was employed instead of HMQC. HSQC was followed by the 1H-1H 2D experiments. A sensitivity enhancement detection period was added for small and medium size proteins (Palmer et al. Reference Palmer, Cavanagh, Wright and Rance1991b). Pulsed field gradients were included to select coherence transfer pathways and to achieve water suppression (Akke et al. Reference Akke, Carr and Palmer1994; Cavanagh et al. Reference Cavanagh, Palmer, Wright and Rance1991; Kay et al. Reference Kay, Keifer and Saarinen1992a; Palmer et al. Reference Palmer, Cavanagh, Wright and Rance1991a, Reference Palmer, Cavanagh, Byrd and Rance1992). The advantages and disadvantages of these variations have been discussed (Cavanagh et al. Reference Cavanagh, Fairbrother, Palmer, Skelton and Rance2006).
Uniformly 15N-labeled protein samples are crucial for the NMR based discovery of high-affinity ligands for proteins by the technique of ‘SAR by NMR’ (Shuker et al. Reference Shuker, Hajduk, Meadows and Fesik1996) in which small organic molecules that bind to proximal subsites of a protein are identified by the observation of 15N- or 1H-amide chemical shift changes in 2D [1H,15N]-HSQC spectra of the uniformly 15N-labeled target protein, optimized and linked together to produce high-affinity ligands.
Today, uniformly 15N-labeled samples play an important role in structural genomics. A [1H,15N]-HSQC spectrum is measured as an initial screening step for high-throughput structure determination. Since the quality of the [1H,15N]-HSQC spectrum depends on the protein structure, an excellent [1H,15N]-HSQC spectrum promises a successful structure determination (Yee et al. Reference Yee, Chang, Pineda-Lucena, Wu, Semesi, Le, Ramelot, Lee, Bhattacharyya, Gutierrez, Denisov, Lee, Cort, Kozlov, Liao, Finak, Chen, Wishart, Lee, McIntosh, Gehring, Kennedy, Edwards and Arrowsmith2002). For proteins that show poor [1H,15N]-HSQC spectra the domain boundary selection may be revised, sample conditions may be optimized, or the structure determination may be deferred.
2.6 Amino acid type-selective 13C and 15N labeling
Amino acid type-selective 13C and 15N double labeling has been used as a powerful tool for NMR signal assignments, the confirmation of signal assignments and the monitoring of specific residues, especially in large or membrane-bound proteins. Sequential resonance assignments are difficult in the simplified spectra recorded for selectively labeled proteins because of the gaps that correspond to the unlabeled residues. However, a straightforward signal assignment strategy was developed using amino acid type-selective double labeling (Kainosho & Tsuji, Reference Kainosho and Tsuji1982). They assigned the 13C′ signals of the three Met residues that occurred in Met-Cys, Met-Val and Met-Asn dipeptides in the Streptomyces subtilisin inhibitor by preparing two samples with either [1-13C]-Met and [15N]-Cys, or [1-13C]-Met and [15N]-Val. This method can be applied for large proteins, is still used in current research and has found renewed interest for the study of membrane-bound proteins (Trbovic et al. Reference Trbovic, Klammt, Koglin, Löhr, Bernhard and Dötsch2005).
2.7 Uniform 13C and 15N double labeling
As an extension of 15N labeling, Bax and co-workers prepared a protein in which all carbon and nitrogen atoms were labeled with 13C and 15N, respectively (Ikura et al. Reference Ikura, Kay and Bax1990; Kay et al. Reference Kay, Ikura, Tschudin and Bax1990). This is called uniform 13C and 15N double labeling. The presence of the 1H, 13C and 15N spins means that almost all sites in the protein are NMR-visible. The heteronuclear one- or two-bond spin-spin couplings are relatively large in the proteins, which allows them to be used for efficient magnetization transfer (Cavanagh et al. Reference Cavanagh, Fairbrother, Palmer, Skelton and Rance2006). Thus, their through-bond correlations can be monitored by multidimensional triple-resonance NMR experiments. Initially, the triple-resonance 3D NMR experiments HNCO, HNCA, HCACO and HN(CO)CA were proposed (Ikura et al. Reference Ikura, Kay and Bax1990). Subsequently, many additional triple-resonance pulse sequences were developed. Today, a set of spectra consisting of HNCA, CBCA(CO)NH, HNCO and HNCACB (or CBCANH) is routinely obtained to establish the sequential connectivities in the protein backbone, including Cβ (Grzesiek & Bax, Reference Grzesiek and Bax1992a, Reference Grzesiek and Baxb; Wittekind & Mueller, Reference Wittekind and Mueller1993). For the side-chain assignments, 3D-HCCH-TOCSY is frequently used (Bax et al. Reference Bax, Clore and Gronenborn1990; Olejniczak et al. Reference Olejniczak, Xu and Fesik1992). In the HCCH-TOCSY pulse sequence, 13C-13C couplings are used for TOCSY magnetization transfer and the 13C chemical shift is used to separate the signals in the 1H-1H plane. The development of the uniform 13C and 15N double labeling method and the corresponding triple resonance experiments increased the molecular size limit for NMR structure analysis to about 25 kDa.
Uniform 13C and 15N double labeling has also been adapted to study protein complexes. Several labeling approaches have been proposed for protein-peptide, protein-protein and protein-DNA/RNA complexes, as well as symmetric oligomers. The most popular method uses mixing labeled and unlabeled components. For homodimeric proteins, this method generates three kinds of species in the sample solution: labeled-unlabeled (50%), labeled-labeled (25%) and unlabeled-unlabeled (25%) pairs. It is hard to separate these species by biochemical methods, because they have almost identical properties except for the molecular mass. However, these species can readily be differentiated by NMR experiments. The binding surface can be identified by intermolecular NOEs observed with isotope-filtered NMR experiments (Folmer et al. Reference Folmer, Hilbers, Konings and Hallenga1995; Ikura & Bax, Reference Ikura and Bax1992; Lee et al. Reference Lee, Revington, Arrowsmith and Kay1994; Melacini, Reference Melacini2000; Ogura et al. Reference Ogura, Terasawa and Inagaki1996; Otting & Wüthrich, Reference Otting and Wüthrich1990; Zangger et al. Reference Zangger, Oberer, Keller and Sterk2003; Zwahlen et al. Reference Zwahlen, Legault, Vincent, Greenblatt, Konrat and Kay1997), even for the otherwise identical 1H pairs. A similar strategy can be applied with larger, oligomeric protein complex systems. One subunit is uniformly labeled and the others are not. Then, the characteristics of the labeled component in the complex can be studied. For 3D structure determinations of such complexes, computer algorithms have been developed for assigning intermolecular NOEs with consideration of the symmetry (O'Donoghue & Nilges, Reference O'Donoghue, Nilges, Krishna and Berliner1999; Yoshida et al. Reference Yoshida, Furuya, Lin, Güntert, Komano and Kainosho2008).
2.8 12C-reverse labeling of aromatics in uniform 13C and 15N double labeling
The peaks of the Phe side-chain appear in a narrow chemical shift range in the 13C dimension, and thus, the signal assignments of 13Cδ, 13Cε and 13Cζ are frequently difficult. However, the resonance assignments of the 13C and 1H signals are essential to analyze their local environments in protein structures. For this purpose, unlabeled Phe can be incorporated into a uniformly 13C and 15N doubly labeled protein. The strategy is called 12C-reverse labeling. This labeling simplifies the aromatic region in 13C-edited NMR spectra. With regard to the analysis of unlabeled Phe residues, isotope-filtered experiments can be employed. In the isotope-filtered experiments, the longer T 2 value of 1H attached to 12C, as compared with 1H attached to 13C, helps to improve both the sensitivity and resolution. In the application reported for the DNA-binding domain of Drosophila heat shock factor, dHSF(33-155), all of the Phe side-chain peaks were completely assigned (Vuister et al. Reference Vuister, Kim, Wu and Bax1994). Furthermore, long-range NOEs could be observed, thus allowing a discussion of the local conformation around the reverse-labeled Phe residues. In that report, the 3J αβ coupling constants were also analyzed quantitatively to estimate the χ1 angles. Such structural restraints can be used as additional constraints together with the information obtained from the uniformly labeled samples. A modification of this method involving the use of Phe residues, in which the ε aromatic positions are 13C-labeled, has also been reported (Wang et al. Reference Wang, Janowick, Schkeryantz, Liu and Fesik1999). The same strategy can be applied to Tyr residues. The utility was demonstrated for the Dbl homology domain, with a molecular mass of 24 kDa (Aghazadeh et al. Reference Aghazadeh, Zhu, Kubiseski, Liu, Pawson, Zheng and Rosen1998), and a 25-kDa anti-apoptotic protein, Bcl-xL (Medek et al. Reference Medek, Olejniczak, Meadows and Fesik2000).
2.9 2H random fractional labeling in uniform 13C and 15N double labeling
Multidimensional NMR experiments for uniformly 13C- and 15N-double-labeled proteins with molecular weights larger than 25 kDa often yield poor NMR spectra. One of the problems is the widespread overlap of peaks. Since the number of atoms in proteins increases in parallel with the molecular weight, this is easily understood. The other problem is the severe line broadening caused by the shorter spin-spin relaxation time, T 2. The past decade has seen great progress in overcoming these problems. The breakthrough was the combination of 2H labeling with the development of TROSY pulse sequences that select the narrow line components of 1H-15N or 1H-13C correlation peaks.
The TROSY pulse sequence, developed by Wüthrich's group, yields HSQC-like spectra, but the line width of each peak strongly depends on the external magnetic field strength. Theoretical considerations indicate that the [1H,15N]-TROSY peaks become sharpest at a 1H frequency of about 1 GHz and that a better TROSY effect is seen for larger molecules (Pervushin et al. Reference Pervushin, Riek, Wider and Wüthrich1997, Reference Pervushin, Riek, Wider and Wüthrich1998; Wüthrich, Reference Wüthrich1998). Today, many triple resonance experiments performed on 800- to 950-MHz NMR spectrometers for larger proteins have been revised based on the TROSY technique (Salzmann et al. Reference Salzmann, Pervushin, Wider, Senn and Wüthrich1998).
On the other hand, the utility of 2H had been recognized, as described in Section 2.2. The first application to examine the ability of 2H labeling combined with triple resonance multidimensional NMR experiments was reported in the development of a pulse sequence, 4D-HN(COCA)NH, in 1993 (Grzesiek et al. Reference Grzesiek, Anglister, Ren and Bax1993). Random fractional 2H labeling at the level of 85%, together with uniform 13C and 15N labeling, was introduced into a protein sample, calcineurin B, with a molecular mass of 19·4 kDa. The 2H labeling and decoupling successfully yielded sharp 13Cα signals. Deuteration narrowed the line width from about 25 to about 10 Hz. Thus, almost all of the sequential scalar coupling connectivities for the 19·4-kDa protein could be observed in the 4D-HN(COCA)NH spectra. Following the initial report, many modifications of triple resonance experiments were proposed, and various applications using this stable isotope labeling strategy have been reported (Garrett et al. Reference Garrett, Seok, Liao, Peterkofsky, Gronenborn and Clore1997; Shan et al. Reference Shan, Gardner, Muhandiram, Rao, Arrowsmith and Kay1996; Yamazaki et al. Reference Yamazaki, Lee, Arrowsmith, Muhandiram and Kay1994). Together with this progress, the molecular weights of proteins for which chemical shift assignments can be carried out have increased considerably. A study by Wüthrich's group revealed that the 2H, 13C and 15N-triple labeling method, combined with TROSY-based NMR analysis, can be feasible even for a 900-kDa protein complex (Fiaux et al. Reference Fiaux, Bertelsen, Horwich and Wuthrich2002).
In earlier applications of triple-resonance multidimensional NMR experiments with 2H-decoupling, uniformly random fractional incorporation of 2H into the non-exchangeable 1H sites in proteins was employed. In general, the degree of the 2H labeling affects the quality of the NMR spectra, and thus, higher levels of random uniform 2H labeling give sharper signals. Therefore, highly deuterated proteins are believed to be better for main chain assignments. However, the lack of 1H at non-exchangeable sites is a disadvantage for side-chain analysis, especially for observations of 1H-1H NOE for structure determination. Therefore, 50%–90% uniformly random fractional 2H labeling is often employed for analysis, but this introduces considerable problems related to isotopomers. For example, the methyl groups of Ala, Leu, Ile, Val and Met contain isotopomers, i.e., CH3, CH2D, CHD2 and CD3. Three of the four isotopomers give NMR signals, and they appear at slightly different chemical shifts, due to the isotope shift. As a consequence, the methyl region shows crowded signals, thus preventing an extensive analysis. However, the methyl group is an interesting probe to monitor protein dynamics. An example is described in Section 2.13. In some cases, the single D in a CH2D methyl group can also be an attractive target (Kay, Reference Kay2005). Although an optimized sample preparation method and specific pulse sequences to observe one isotopomer in the sample solution have been reported (Ishima et al. Reference Ishima, Louis and Torchia2001), the signal intensity is relatively low, because the actual number of detectable molecules is much less than the total sample concentration.
Recent improvements in sensitivity, using cryogenic probes, have enabled 13C-detection in multidimensional protein NMR spectroscopy (Bermel et al. Reference Bermel, Bertini, Duma, Felli, Emsley, Pierattelli and Vasos2005; Bertini et al. Reference Bertini, Duma, Felli, Fey, Luchinat, Pierattelli and Vasos2004; Pervushin & Eletsky, Reference Pervushin and Eletsky2003). Several experiments based on protonless 13C direct detection have been proposed for heteronuclear assignment, in order to study large proteins, paramagnetic proteins, and natively unfolded proteins (Arnesano et al. Reference Arnesano, Banci, Bertini, Felli, Luchinat and Thompsett2003; Machonkin et al. Reference Machonkin, Westler and Markley2002). In contrast to the analogous 1H-detection experiments, the signal dispersion in the 13C chemical shift is an advantage for the analysis of such protein samples. Further development of the pulse sequences with non-proton detection might allow the establishment of a new strategy of NMR structure determination without 1H-1H NOEs, using fully deuterated and [13C,15N]-labeled proteins.
2.10 Combination of full 2H labeling and uniform 13C and/or 15N labeling
As described in Section 2.2, a fully deuterated protein can be used to study protein-ligand, protein-protein and protein-membrane complexes. As an extension, 15N was employed to identify the binding interface. Shimada and co-workers developed a new method, named transferred cross-saturation (Takahashi et al. Reference Takahashi, Nakanishi, Kami, Arata and Shimada2000). In this method, one molecule of a heterodimeric complex is unlabeled and the other is labeled with 2H and 15N. An RF-pulse excites the aliphatic 1H of the unlabeled molecule, and the magnetization is transferred to the neighboring amide 15N in the labeled molecule. Amide 1H-15N correlation signals can then be detected for part of the molecule, suggesting that these amides are close to aliphatic 1H, i.e., located in the interaction site. This technique is a good example of the benefit of combining 2H labeling and a TROSY-based experiment.
2.11 Selective backbone protonation in uniform 2H, 13C and 15N labeling
Protocols for site-specifically protonated proteins with uniform stable isotope labeling by 2H, 13C and 15N have been proposed for backbone resonance assignments (Yamazaki et al. Reference Yamazaki, Tochio, Furui, Aimoto and Kyogoku1997). Yamazaki et al. developed a biosynthetic approach to prepare proteins with high levels of 2H labeling at all but the 13Cα positions. They used a commercially available 2H, 13C and 15N labeled amino acid mixture, and the 1Hα labeling was achieved using a chemical reaction. The amino acid mixture was then added to the H2O-based culture medium to express the target protein, the C-terminal domain of the α subunit of E. coli RNA polymerase, in an E. coli system. Furthermore, new pulse sequences were designed for this sample by using 13Cα magnetization to obtain the correlation through scalar couplings, such as 13Cα-15N and 13Cα-13C′. This approach is especially helpful to obtain high quality triple resonance NMR spectra, when the protein sample shows fast amide-proton exchange rates. Yamazaki et al. carried out the analysis on NMR data recorded at 10°C. As judged from the T 2 values of 13Cα, the overall tumbling rate of their sample at 10°C was estimated to be similar to that of a 30- to 40-kDa protein at 30–40°C. Thus, this method also has the potential to facilitate the analysis of large proteins.
Another backbone-labeling strategy was tested for the Phe, Val and Leu residues in a 26-kDa glycoprotein, the β subunit of human chorionic gonadotropin (Coughlin et al. Reference Coughlin, Anderson, Oliver, Brown, Homans, Pollak and Lustbader1999). In this case, chemically synthesized Phe, Val and Leu were used. Their backbone atoms were uniformly labeled with 13C and 15N. In addition, all of the proton sites of the amino acids were randomly replaced by 2H, at a 50% level. These labeled Phe, Val and Leu amino acids and the other unlabeled amino acids were added to the growth medium for the sample preparation. The protein expression was achieved in mammalian cells. The use of such a protein, in which only the backbone atoms are isotope-labeled with 13C and 15N, results in the elimination of the undesirable one bond 13Cα-13Cβ scalar coupling and improves both the sensitivity and resolution of the triple-resonance NMR experiments. This stable isotope labeling strategy has the benefits of generating optimal resolution and increasing the sensitivity for all residue types. Moreover, the absence of 13Cβ provides an opportunity to measure the residual dipolar coupling constants between 13C′-13Cα and 13Cα-1H (Ding & Gronenborn, Reference Ding and Gronenborn2004), which can be included in the restraints for structure calculation.
Alternative approaches using uniformly 13C- and 15N-labeled proteins have been proposed to remove the splitting due to the one bond 13Cα-13Cβ coupling, such as constant-time experiments (Santoro & King, Reference Santoro and King1992; Shan et al. Reference Shan, Gardner, Muhandiram, Rao, Arrowsmith and Kay1996) and band-selective 13Cα and 13Cβ decoupling experiments (Matsuo et al. Reference Matsuo, Kupce, Li and Wagner1996a, Reference Matsuo, Kupce and Wagnerb). However, the former causes a significant loss in sensitivity. The latter does not achieve complete 13Cβ decoupling, because the 13Cβ signals of Ser and Thr are shifted downfield, as compared with others.
2.12 Amino acid type selective protonation in uniform 2H, 13C and 15N labeling
To reduce the spectral complexity, alternative labeling methods were proposed, using 2H, 13C and 15N. For example, a 2H, 13C and 15N-triple labeled protein, in which only the sites to be monitored are protonated, was prepared. Amino acid type selective protonation is one of the methods in this category. In one such labeling strategy, the protein sample was expressed in minimal medium containing 95% D2O, 2H-labeled glucose, (15NH4)2SO4 and 1H/13C/15N-labeled Ile, Leu, Val amino acids (Metzler et al. Reference Metzler, Wittekind, Goldfarb, Mueller and Farmer1996). Using the sample prepared with this method, high-quality [1H,13C]-HSQC and NOESY spectra were observed for the hydrophobic residues. The aliphatic-aliphatic NOEs can also be observed in 13C-edited NOESY spectra. These NOEs, combined with the 1HN-1HN NOEs obtained by 15N-edited NOESY, can be used as input for a structure calculation. In a similar approach for the ras p21 protein, with a molecular mass of 19 kDa, protonated Ile, Leu, Val, Phe and Tyr were used (Smith et al. Reference Smith, Ito, Raine, Teichmann, BenTovim, Nietlispach, Broadhurst, Terada, Kelly, Oschkinat, Shibata, Yokoyama and Laue1996). The advantages of these methods were discussed, but the limited distance information yielded only global fold information for the sample proteins. It is difficult to separate all the methyl peaks in large proteins. Aromatic peaks are also prone to spectral overlapping because the Tyr and Phe side-chains appear in a narrow chemical shift range in the 13C dimension, as described in Section 2.8.
Recently, Ito et al. reported a new sample preparation method for the E. coli biosynthesis of deuterated proteins with selective protonation of the aromatic rings of Phe, Tyr and Trp (Rajesh et al. Reference Rajesh, Nietlispach, Nakayama, Takio, Laue, Shibata and Ito2003). Specific protonation of the aromatic rings was achieved with complete deuteration at the 13Cα/β positions. The labeling was accomplished by using shikimate-supplemented D2O medium. Co-expression of a shikimate transporter in prototrophic bacteria resulted in protonation levels of 62%–79%. The NMR spectra for yeast ubiquitin hydrolase 1, composed of 236 residues, were observed to demonstrate the method. The purpose of this labeling is to obtain the NOE distance restraints for the aromatic rings.
2.13 Methyl group selective protonation in uniform 2H, 13C and 15N labeling
Kay and co-workers developed a method for selective methyl group protonation (Gardner & Kay, Reference Gardner and Kay1997; Goto et al. Reference Goto, Gardner, Mueller, Willis and Kay1999; Rosen et al. Reference Rosen, Gardner, Willis, Parris, Pawson and Kay1996). A stable isotope labeled supplement added to the E. coli growth medium facilitates the selective labeling. The labeled chemical compound acts as a precursor of Ala, Val, Leu and Ile. The proteins prepared by this method are uniformly 2H-, 13C- and 15N-labeled, except for the methyl groups of Ala, Val and Leu and the γ2 methyl site of Ile that remain highly protonated. Protonation levels of about 80% for Leu, 60% for Ile (γ2) and Val, and 40% for Ala were reported. The NMR spectra revealed some protonation at the Cβ positions of Asp/Asn and the Cγ positions of Gln/Glu, Arg and Pro. An improved protocol by Kay et al. labels only the Leu δ, Val γ and Ile δ1 methyl groups. In contrast to the previous method, a high labeling level of about 90% was achieved, and isotopomers, i.e., 13CH2D and 13CHD2, did not appear.
The high level of deuteration in uniformly 13C and 15N-labeled proteins makes it easy to assign the backbone 1H, 15N, 13C′ and 13Cα signals and the side-chain 13Cβ signals of the 370-residue protein MBP (41 kDa) (Gardner et al. Reference Gardner, Zhang, Gehring and Kay1998). Kay's group also demonstrated that assignments can be obtained for a 723-residue (82 kDa) single polypeptide multidomain protein, malate synthase G (Tugarinov et al. Reference Tugarinov, Choy, Orekhov and Kay2005). Furthermore, they obtained 1HN-1HN, 1HN-methyl and methyl-methyl NOEs, backbone dihedral angle restraints based on 15N, 13Cα and 13C′ chemical shift values, 1H-15N residual dipolar coupling constants and chemical shift anisotropy (CSA) values. On the basis of these data, they calculated the 3D structure of malate synthase G. The same labeling strategy enabled the structure determination of the integral membrane protein OmpX from E. coli reconstituted in 60-kDa DHPC micelles (Fernández et al. Reference Fernández, Hilty, Wider, Güntert and Wüthrich2004).
The precision and the accuracy of protein structures solved by this method depend on the number of protonated methyl groups and their spatial distribution in the protein structure. The 3D structures generated by this method may be less precise than X-ray crystal structures, and NMR can at present not compete with X-ray crystallography for structure determinations of large proteins. However, the potential of NMR for the structure analysis of large proteins in solution was clearly indicated.
Three labeling strategies for side-chain methyl groups in high molecular weight proteins using 13CH3, 13CH2D and 13CHD2 methyl isotopomers were compared (Ollerenshaw et al. Reference Ollerenshaw, Tugarinov, Skrynnikov and Kay2005). For each labeling scheme, 1H-13C correlation pulse sequences that give optimal resolution and sensitivity were identified and tested experimentally on three highly deuterated samples of malate synthase G with 13CH3, 13CH2D and 13CHD2 labeling in the Ile δ1 positions. Although excellent resolution can be obtained with any of the isotopomers, the 13CH3 labeling strategy benefitted from a more than twice higher sensitivity than either 13CH2D or 13CHD2 labeling.
Recently, this methyl labeling method was applied to the 20S proteasome, with a molecular mass of 670 kDa. Kay's group observed clear NMR spectra and analyzed the dynamics of the 20S proteasome (Sprangers & Kay, Reference Sprangers and Kay2007).
2.14 Stereoselective labeling of prochiral methyl groups in Val and Leu residues
The stereospecific assignment of prochiral methyl groups in Val and Leu residues is important to determine protein structures with high accuracy. Normally, the NMR signals of the two isopropyl methyl groups have different chemical shifts, as a consequence of their different magnetic environments. For a detailed discussion of their local conformation, stereospecific assignments are essential. Furthermore, when stereospecific assignments are unknown pseudoatom corrections should be applied to the NOE upper distance bounds from these groups during the structure calculation. This tends to result in less well-defined structures. Stereospecific assignments of the prochiral methyl groups avoid this loss of the structural quality.
The first approach used to assign the diastereotopic methyl groups in Val and Leu was carried out by biosynthetic fractional 13C labeling (Neri et al. Reference Neri, Szyperski, Otting, Senn and Wüthrich1989). This method was based on the known stereoselective biosynthetic pathways for these amino acids from glucose. The isopropyl group is composed of a two-carbon fragment from one pyruvate unit, while the second methyl group is transferred from another pyruvate unit. This reaction occurs stereoselectively, and the migrating methyl group becomes pro-S in both Val and Leu; i.e., they are γ2CH3 and δ2CH3, respectively. Fractional 13C labeling of the methyl groups occurs when a mixture of 13C-glucose and 12C-glucose is used as the carbon source. In the 1H-13C correlation spectra, the 13C-attached proton shows a 1J CH splitting, thus clearly indicating the stereospecific assignment.
In a similar way, the simultaneous unlabeling of selected amino acid residues and the fractional 13C labeling of the remaining amino acids was achieved by growing the host microorganism in minimal medium containing a mixture of 10% [13C6]-glucose and 90% [12C6]-glucose, along with the unlabeled forms of the amino acids that were to remain unlabeled (Atreya & Chary, Reference Atreya and Chary2001). Since the methyl region in 1H-13C 2D spectra is crowded, this method can simplify the NMR spectra and enable the stereospecific assignment of Val and Leu methyl side-chains.
Block labeling is an alternative to the stereospecific assignment of the prochiral methyl groups in Val and Leu residues. First, Val and Leu amino acids, in which one of the methyl carbons is stereoselectively labeled with 13C and the other is not, are either synthesized chemically or obtained by microbial fermentation. Next, these amino acids are incorporated into proteins. The stereochemistry of the amino acids is retained in these labeled residues, and constant-time [1H,13C]-HSQC spectra clearly indicate the chirality. The utility of this simple strategy was shown by the analysis of cystatin A (Tate et al. Reference Tate, Ushioda, Utsunomiya-Tate, Shibuya, Ohyama, Nakano, Kaji, Inagaki, Samejima and Kainosho1995), and the signal assignment of a 10-kDa functional domain of phosphoprotein CPI-17, which has 13 Leu and 6 Val residues, was accomplished by this method (Ohki et al. Reference Ohki, Eto, Kariya, Hayano, Hayashi, Yazawa, Brautigan and Kainosho2001).
2.15 Stereospecific 2H labeling
In a similar manner as the block labeling described above, a method for the stereospecific assignment of the methyl groups in Val and Leu residues was achieved with 2H labeling (Ostler et al. Reference Ostler, Soteriou, Moody, Khan, Birdsall, Carr, Young and Feeney1993). In this method, the stereoselectively 2H-labeled compound was supplied in the medium to obtain the protein by bacterial synthesis. In the first application (2S,4R)[5,5,5-2H3] leucine was added to the medium to express a protein by Lactobacillus casei. The absence of the signals in the 1H-1H homonuclear 2D NMR spectra clearly showed the stereospecific assignments.
For the stereospecific assignment of the two Hα protons in Gly, LeMaster et al. developed a stereospecific 2H-labeling method (LeMaster et al. Reference LeMaster, LaIuppa and Kushlan1994). They prepared a protein, Staphylococcal nuclease H124L, in which the Gly residues were labeled by [2HR,2-13C]Gly and [2HS,2-13C]Gly. Isotope shifts made the chemical shift of each Gly 13Cα different for the two labeling patterns, and two peaks were observed in [1H,13C]-HSQC spectra. Furthermore, each peak splits into two peaks in the 1H dimension when 13C was not decoupled, and the 1J scalar coupling constants are slightly different. Based on these values, the conformation of Gly was discussed. In general, HNHA or HMQC-J-type experiments using uniformly 15N-labeled samples cannot determine the dihedral angles for Gly residues, and thus, this labeling provides some advantage for studying the local conformation around these residues.
2.16 Segmental labeling
Segmental labeling is an attractive method for preparing NMR samples. The uniqueness of this method is that one or several parts of the sample protein can be labeled. Large proteins often consist of multiple domains. This stable isotope labeling method is useful for studying the structure, dynamics and interactions of a domain of interest in a large, intact protein. Segmental labeling is based on peptide splicing reactions (Duan et al. Reference Duan, Gimble and Quiocho1997; Klabunde et al. Reference Klabunde, Sharma, Telenti, Jacobs and Sacchettini1998) carried out by inteins. This is a post-translational chemical modification (Hirata et al. Reference Hirata, Nakano, Kawasaki, Suzuki and Anraku1990; Kane et al. Reference Kane, Yamashiro, Wolczyk, Neff, Goebl and Stevens1990).
For the first demonstration of segmental labeling, Yamazaki et al. employed an intein, PI-PfuI, from Pyrococcus furiosus (Otomo et al. Reference Otomo, Teruya, Uegaki, Yamazaki and Kyogoku1999b; Yamazaki et al. Reference Yamazaki, Otomo, Oda, Kyogoku, Uegaki, Ito, Ishino and Nakamura1998). The key idea of their labeling strategy was that PI-PfuI can be split into two fragments such that their mixture still maintains the function of the intact intein. Exploiting this interesting property, they prepared two kinds of protein-precursor constructs separately. One was the N-terminal half of the sample protein conjugated to the N-terminal half of the intein. The other was the C-terminal half of the intein with the C-terminal half of the sample protein. One of them was expressed in E. coli grown in uniformly 15N-labeled medium, and the other was prepared in unlabeled culture medium. Both fragments were expressed as inclusion bodies. The samples were mixed in denaturing reagents and refolded to generate the active intein, which could accomplish the splicing reaction to ligate the target polypeptides. The sample was subjected to heat shock at 70°C to initiate the protein splicing reaction. After the splicing reaction, they obtained the segmentally labeled RNA polymerase subunit α. They recorded the [1H,15N]-HSQC spectra of three kinds of samples, i.e., N-terminal half labeled, C-terminal half labeled and fully labeled. The sum of the [1H,15N]-HSQC spectra for the segmental labeled samples was identical to that of the intact protein, except for the inserted residues. Since the splicing reaction inserted five extra amino acid residues into the ligation site, the junction site should be selected carefully to retain the entire protein structure and the full biological activity. Suitable ligation sites are usually found in flexible loop regions on the protein surface or in interdomain linkers, where they can be identified by enzymatic digestion experiments. In an extension of the original method two kinds of inteins were employed to demonstrate the stable isotope labeling of a central region of a protein (Otomo et al. Reference Otomo, Ito, Kyogoku and Yamazaki1999a). Maltose-binding protein (MBP) with an isotope-labeled, central segment flanked by two unlabeled elements was successfully prepared with about 90% yield for the intein-mediated ligation. Segmental labeling was also applied to the 52-kDa F1-ATPase β subunit motor protein (Kobayashi et al. Reference Kobayashi, Yagi, Yamazaki, Yoshida and Akutsu2008; Yagi et al. Reference Yagi, Tsujimoto, Yamazaki, Yoshida and Akutsu2004). Four kinds of segmentally labeled samples were prepared and analyzed by NMR, yielding about 90% of the backbone NH, 13Cα, 13C′ and 13Cβ signals of this 473 residue protein. This segmental labeling strategy is a powerful tool for analyzing domains in a large protein, although the heating step for splicing and the insertion of extra amino acids may limit its application.
Using a similar concept, a versatile segmental labeling method was proposed that has the advantages that the splicing reaction occurs under gentle conditions in vitro and does not introduce extra residues at the ligation site (Iwai & Plückthun, Reference Iwai and Plückthun1999; Xu et al. Reference Xu, Ayers, Cowburn and Muir1999). The N-terminal fragment of the sample protein is expressed with an intein plus chitin-binding domain at its C-terminal end. The C-terminal fragment, in which the N-terminus is a Cys residue, was also prepared. One of them was isotopically labeled and the other was not. The N-terminal fusion protein was trappped in an affinity column via the chitin-binding domain, and all the splicing reactions were carried out in the column. Finally, the segmentally labeled product was eluted from the column. This method was tested to connect two independently folded domains, SH2 and SH3, from Abelson protein tyrosine kinase. A yield of 70% was reported for the reaction.
Recently, Züger and Iwai developed an elegant technique for the intein-based biosynthetic incorporation of unlabeled polypeptide segments into isotopically labeled proteins (Iwai et al. Reference Iwai, Züger, Jin and Tam2006; Züger & Iwai, Reference Züger and Iwai2005). In their method, protein splicing is automatically performed in vivo. The preparation of the precursor fragments and the ligation experiments in vitro are not necessary, and the purified protein can be subjected to NMR experiments without removal of the tag. This is a great advantage for sample preparation. A dual expression system allows the sequential expression of two precursor products. The key idea of this strategy is that the two fragments are expressed in a single cell by independent plasmids with different promoters: one is controlled by IPTG and the other is controlled by l-arabinose. Thus, the time when a given fragment was overexpressed in the cell could be controlled. First, IPTG (or l-arabinose) is used to start the expression of one of the precursors in the labeled (or unlabeled) medium. Then, the cells were collected and transferred to the unlabeled (or labeled) medium, where the expression of the other fragment was initiated by the addition of l-arabinose (or IPTG). When the two kinds of fragments were expressed in cells, the protein splicing reaction occurred automatically. Using this technique, isotope-labeled proteins fused with an unlabeled chitin-binding domain at the C-terminal end were prepared (Züger & Iwai, Reference Züger and Iwai2005). The chitin-binding domain is frequently employed to simplify protein purification steps, but it also has the function to stabilize the fused proteins. Thus, their method provides an opportunity for the successful preparation and NMR study of unstable proteins, such as natively unfolded samples.
Recently, the segmental isotopic labeling of a central domain in a multidomain protein was achieved by protein trans-splicing using only the well characterized NpuDnaE intein for three-fragment ligation without any refolding steps (Busche et al. Reference Busche, Aranko, Talebzadeh-Farooji, Bernhard, Dötsch and Iwai2009). This simple and robust scheme for labeling a central fragment of a protein could become a valuable tool for elucidating structure-function relationships of a domain or a region in an intact protein by NMR spectroscopy.
Presently, more than 100 inteins have been discovered. Only few of them have yet been employed for NMR sample preparation. The use of inteins is an active field of research and an increasingly important technique for N- and/or C-terminal modification, protein stabilization, purification and ligation (Brenzel et al. Reference Brenzel, Kurpiers and Mootz2006; Burz et al. Reference Burz, Dutta, Cowburn and Shekhtman2006; Cowburn et al. Reference Cowburn, Shekhtman, Xu, Ottesen and Muir2004; Iwai & Plückthun, Reference Iwai and Plückthun1999; Iwai et al. Reference Iwai, Züger, Jin and Tam2006; Muona et al. Reference Muona, Aranko and Iwai2008; Romanelli et al. Reference Romanelli, Shekhtman, Cowburn and Muir2004; Skrisovska & Allain, Reference Skrisovska and Allain2008; Vitali et al. Reference Vitali, Henning, Oberstrass, Hargous, Auweter, Erat and Allain2006; Williams et al. Reference Williams, Liepinsh, Watt, Prosselkov, Matthews, Attard, Beck, Dixon and Otting2005; Williams et al. Reference Williams, Prosselkov, Liepinsh, Line, Sharipo, Littler, Curmi, Otting and Dixon2002; Zhao et al. Reference Zhao, Zhang, Cui, Li and Wang2008; Züger & Iwai, Reference Züger and Iwai2005).
3. SAIL principles
3.1 SAIL design principles
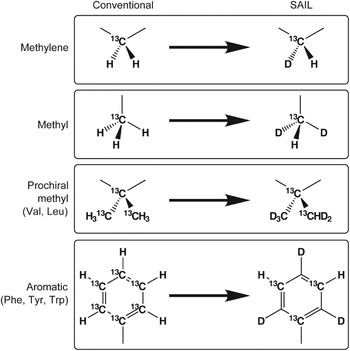
The basic strategy of SAIL is to incorporate deuterium into the amino acids constituting a protein such that each carbon or nitrogen nucleus in the final protein will have at most one 1H nucleus bonded to it, the remaining hydrogen atoms having been replaced by 2H. In addition, 13C and 15N are used only where a 1H is bound to it or where it is needed for uninterrupted through-bond assignment pathways. This is achieved by preparing amino acids with the following features (Fig. 2):
Design concepts embodied in the SAIL amino acids (Kainosho et al. Reference Kainosho, Torizawa, Iwashita, Terauchi, Ono and Güntert2006).

(1) Stereoselective replacement of one 1H in methylene groups by 2H.
(2) Replacement of two 1H in each methyl group by 2H.
(3) Stereoselective modification of the prochiral methyl groups of Leu and Val such that one methyl is -12C(2H)3 and the other is -13C1H(2H)2.
(4) Labeling of six-membered aromatic rings by alternating 12C-2H and 13C-1H moieties.
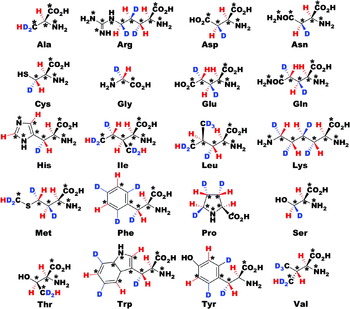
SAIL versions of the 20 common amino acids (Fig. 3) were synthesized based on these design concepts by chemical and enzymatic syntheses as described in Section 4.1 below.
Chemical structures of the SAIL amino acids (Kainosho et al. Reference Kainosho, Torizawa, Iwashita, Terauchi, Ono and Güntert2006).

The patterns of replacement are designed to provide the most information consistent with spectral simplification and isotopic dilution and constitute a general approach to overcoming the limitations of deuteration. This labeling pattern preserves through-bond connectivity information needed for backbone and side-chain assignments, eliminates the need for stereospecific assignments, simplifies measurements of couplings and removes the most serious sources of spin diffusion so as to improve the accuracy of inter-proton distance measurements. Lines are sharpened both by decreasing long-range couplings and by eliminating dipolar relaxation pathways. The methyl and methylene labeling patterns simplify the analysis of the motional properties of the side-chains from relaxation measurements (Kay et al. Reference Kay, Nicholson, Delaglio, Bax and Torchia1992b). The aromatic ring labeling strategy removes one-bond aromatic 13C–13C couplings, which often complicate spectra.
3.2 Expected numbers of identifiable NOESY peaks
The SAIL technology improves NMR spectra because it decreases the number of signals without losing sensitivity for the resonances of interest. The number of non-exchangeable side-chain protons, which are prone to overlap but essential for defining the side-chain conformations, is reduced to less than half, and the number of expected NOESY cross-peaks is decreased by 40%–45%. Most of the additional NOEs from uniformly labeled proteins either involve fixed (geminal) distances or become redundant in the absence of stereospecific assignments and thus contribute to spectral overlap without furnishing independent information. In principle, stereospecific assignments could allow for slightly more precise structures in the case of uniform labeling (Güntert et al. Reference Güntert, Braun, Billeter and Wüthrich1989). However, only a limited number of stereospecific assignments can be made in practice. The BioMagResBank reports stereospecific assignments only for well below 10% of the methylene protons and Val/Leu methyl groups. Therefore, in general the expected number of non-redundant, structurally relevant NOE restraints is retained with SAIL, even if the effect of the better signal-to-noise ratio with SAIL is neglected. These numbers are corroborated by the experimental findings (see below).
More detailed theoretical considerations (Kainosho et al. Reference Kainosho, Torizawa, Iwashita, Terauchi, Ono and Güntert2006), which take into account the enhanced signal strength and sharper lines in SAIL spectra and the fact that overlap can render peaks unidentifiable, show that in practice with larger molecules SAIL is expected to increase rather than decrease the number of identifiable NOE cross-peaks. The expected increase is moderate in regions without overlap but significant in regions with strong overlap, and thus for larger proteins, for which SAIL is expected to yield twice or more times the number of relevant conformational restraints than uniform labeling.
3.3 Overlap and relaxation optimized SAIL patterns
Ideally, the SAIL technique could be applied to the NMR structure determinations of proteins larger than 50 kDa and membrane proteins. For this, it will presumably be necessary to optimize the isotope labeling patterns further, in order to cope with the extensive crowding and line-broadening that is characteristic of the spectra of such proteins. In an overlap and relaxation optimized version of the SAIL approach, the number of 1H nuclei is reduced further to enable the observation of well-shaped and separated signals, even for proteins beyond 50 kDa.
SAIL patterns can be characterized by the percentage of 1H atoms relative to the uniformly labeled protein in an H2O solution. The original SAIL method retains 64% of all protons, and 44% of all side-chain protons (Kainosho et al. Reference Kainosho, Torizawa, Iwashita, Terauchi, Ono and Güntert2006). An overlap and relaxation optimized SAIL pattern (Ikeya et al. Reference Ikeya, Terauchi, Güntert and Kainosho2006) comprised 53% of all protons, and only 28% of all side-chain protons. The modified SAIL 1H labeling pattern is essentially a subset of standard SAIL. For instance, a uniformly 13C-labeled Leu side-chain contains four 13C and nine 1H nuclei. The original SAIL pattern reduces the NMR-active nuclei to three 13C and three 1H (Fig. 3). In the case of overlap and relaxation optimized SAIL, the Hγ methine proton, which tends to be overlapped and to provide only largely redundant NOEs, is additionally replaced by 2H. Cγ can be replaced by 12C for a further reduction of the relaxation or be kept as 13C to enable the assignment of the 13C1H(2H)2 methyl group by through-bond experiments. The only instance in which modified SAIL is not a subset of SAIL occurs with the aromatic ring of Phe, which has 1H exclusively in the two ε-positions in SAIL, but only at the Hζ-position in modified SAIL.
Simulations suggested that the combined use of optimized SAIL patterns and automated structure calculation algorithms with CYANA has high potential for the automated structure determinations of higher molecular weight proteins as well as membrane proteins (Ikeya et al. Reference Ikeya, Terauchi, Güntert and Kainosho2006). The precision of the structure using the new, overlap and relaxation optimized modified SAIL pattern was slightly lower than that obtained by uniform labeling and the original SAIL method because modified SAIL reduces the number of peaks expected under ideal conditions. However, with the actual experimental data, better results can be expected for overlap and relaxation optimized SAIL because it facilitates the analysis of many otherwise broadened or overlapped signals. Overlap and relaxation optimized SAIL patterns may thus contribute to the determination of high-quality solution structures of proteins in the 30- to 100-kDa size range and membrane proteins.
4. SAIL techniques
4.1 SAIL amino acid synthesis
The efficient synthesis of versions of all 20 common amino acids that embody the aforementioned SAIL design principles is the cornerstone of the SAIL technology. This has been achieved by chemical and enzymatic reactions using starting materials uniformly labeled with 13C and 15N that are commercially available (Oba et al. Reference Oba, Terauchi, Miyakawa, Kamo and Nishiyama1998, Reference Oba, Terauchi, Miyakawa and Nishiyama1999, Reference Ohki, Eto, Kariya, Hayano, Hayashi, Yazawa, Brautigan and Kainosho2001; Terauchi et al. Reference Terauchi, Kobayashi, Okuma, Oba, Nishiyama and Kainosho2008; Torizawa et al. Reference Torizawa, Ono, Terauchi and Kainosho2005). The approach proved amenable to scale-up, enabling the preparation of significant quantities of these amino acids. Here, the syntheses of the SAIL amino acids Phe, Tyr, Ser, Cys and Ala are described as examples.
4.1.1 Phenylalanine and tyrosine
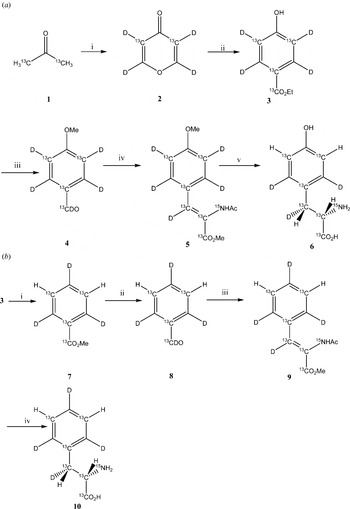
Stereoselective syntheses of phenylalanine labeled with deuterium on the Hδ, Hε and Hζ positions had been reported previously (Nishiyama et al. Reference Nishiyama, Oba, Ueno, Morita, Nakamura and Kainosho1994). However, these synthetic routes were not suitable for the synthesis of these amino acids because of the difficulty in the regioselective incorporation of 13C in the aromatic ring. Instead, SAIL phenylalanine and tyrosine can be synthesized efficiently using a hydroxyl benzoic acid derivative as key intermediate, starting from various types of 13C-labeled acetone and ethyl malonate (Torizawa et al. Reference Torizawa, Ono, Terauchi and Kainosho2005). The synthesis pathways are shown in Fig. 4.
Synthesis of aromatic SAIL amino acids (Torizawa et al. Reference Torizawa, Ono, Terauchi and Kainosho2005). (a) SAIL tyrosine. Reagents and conditions: (i) 1, (EtOCO)2, NaOEt; 2, conc. DCl; 3, Cu; (ii) 1, [13C3]-ethyl malonate, t-BuOK/BuOD; (iii) 1, MeI, acetone; 2, LiAlD4; 3, PDC; (iv) 1, [13C2;15N]-NAc-glycine, Ac2O, AcONa; 2, MeOH, Et3N; (v) 1, (S,S)-Et-DuPhos-Rh, H2; 2, 1 N-HCl; 3, HBr-AcOH. (b) SAIL phenylalanine. Reagents and conditions: (i) 1, HCl, Δ; 2, Tet-Cl, K2CO3; 3, H2, Pd/C; (ii) 1, LiAlD4; 2, PDC; (iii) 1, [13C2;15N]-NAc-Glycine, Ac2O, AcONa; 2, MeOH, Et3N; (iv) 1, (S,S)-Et-DuPhos-Rh, H2; 2, N-HCl.

To synthesize SAIL Tyr, 4H-pyran-4-one 4 was obtained from 3 by a modification of a reported procedure (Murray III & Williams, Reference Murray and Williams1958; Riegel & Zwilgmeyer, Reference Riegel and Zwilgmeyer1943). Then, 4H-pyran-4-one 4 was subjected to a condensation/aromatization reaction to give the key intermediate 5 (Lang et al. Reference Lang, Lang-Fugmann and Steglich2002). For the synthesis of Tyr 1a (Scheme 1), the hydroxyl group of 5 was methylated and the ester was reduced by LiAlD4. The following oxidation by PDC yielded 6 (Beyer et al. Reference Beyer, Lang-Fugmann, Mühlbauer and Steglich1998). Then, 6 was converted into the dehydrotyrosine derivative 7 by a condensation with labeled Gly derivatives (Erlenmeyer, Reference Erlenmeyer1893; Ojima et al. Reference Ojima, Kato, Nakahashi, Fuchikami and Fujita1989). Compound 7 was subjected to hydrogenation in the presence of (S,S)-Et-DuPhos-Rh as a catalyst in MeOH (Burk et al. Reference Burk, Feaster, Nugent and Harlow1993) and was then deprotected to yield Tyr 1a (Li et al. Reference Li, Patel and Hruby1993).
Phe 1b can be synthesized by the deoxygenation of the hydroxyl group of the key intermediate 5. Thus, a reductive deuteration of the hydroxyl group of 5 was carried out, using recently reported methods to place a deuterium at the Hζ position (Nishiyama et al. Reference Nishiyama, Oba, Ueno, Morita, Nakamura and Kainosho1994; Viswanatha & Hruby, Reference Viswanatha and Hruby1980). Then, as in the method for the synthesis of Tyr, 9 was converted into Phe 1b.
4.1.2 Serine
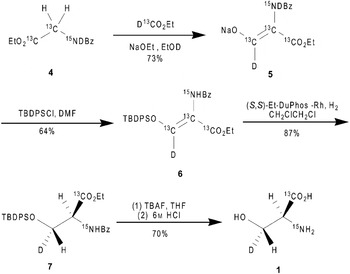
There are many other examples of methods used for the synthesis of isotope-labeled serine, cysteine and alanine. The synthesis of a racemic mixture of serine labeled with deuterium at the β-position, via the reduction of the dehydroserine derivative, was reported more than 20 years ago (Aberhart & Russell, Reference Aberhart and Russell1984; Kainosho & Ajisaka, Reference Kainosho and Ajisaka1975). Gani and co-workers used the Baeyer-Villiger oxidation as a key reaction for the enantioselective synthesis of deuterium-labeled serine (Gani & Young, Reference Gani and Young1983). However, the enantiopurity of the deuterated serine was insufficient for the SAIL method. Therefore, the synthesis of SAIL serine (Terauchi et al. Reference Terauchi, Kobayashi, Okuma, Oba, Nishiyama and Kainosho2008) uses catalytic asymmetric hydrogenation for the chiral introduction of a deuterium atom at the β-position, using the more easily accessible [1,2-13C2;15N;2,2-2H2]glycine and ethyl [13C,2H]formate as starting materials.
Before starting the synthesis of SAIL serine, the hydrogenation of the dehydroserine derivatives was optimized using various non-labeled dehydroserine derivatives in the presence of (+)-1,2-bis((2S,5S)-2,5-diethylphospholano)benzene(cyclooctadiene)rhodium (I) tetrafluoroborate ((S,S)-Et-DuPHOS-Rh) (Burk, Reference Burk1991; Burk et al. Reference Burk, Kalberg and Pizzano1998) as the catalyst. The optical yield of the α-position during the hydrogenation was determined from serine. When the acyl group was used to protect the enol group, the deoxygenation occurred at the β-position, and the optical yields at the α-position were not sufficient. In order to inhibit the deoxygenation, silyl enol ether was applied to the substrate. The t-butyldiphenylsilyl (TBDPS) and thexyldimethylsilyl (TDS) derivatives of the protective group did not exhibit deoxygenation; however, TBDMS gave rise to a complex mixture, due to its instability. The optical purities based on the positions of the TBDPS and TDS derivatives were 99% ee and 92% ee, respectively. In order to check the enantiopurity of the β-position by deuteration, the catalytic deuteration of the TBDPS derivatives was examined using deuterium gas instead of hydrogen gas, followed by deprotection, to give α,β-dideuterium-labeled serine. In the 300-MHz 1H NMR spectrum of α,β-dideuterium-labeled serine the signals for the α-proton and the 3S proton had disappeared due to cis addition to the re face, indicating that the stereochemistry at the β-position is an R configuration (Terauchi et al. Reference Terauchi, Kobayashi, Okuma, Oba, Nishiyama and Kainosho2008).
The synthesis (Fig. 5) begins with the condensation of ethyl [1,2,3-13C;15N;3-2H]hippurate (4) with ethyl [13C;2H]formate, followed by the silylation of the enolate 5, to give exclusively the Z isomer of the dehydroserine derivative 6 in 64% yield. The obtained derivative 6 was examined using asymmetric catalytic hydrogenation, followed by deprotection to give SAIL serine 1. The enantiopurity based on the α-position was determined to be 95% ee by a high performance liquid chromatography (HPLC) analysis using a chiral stationary column (SUMICHIRAL OA-6100).
Synthesis of SAIL serine (Terauchi et al. Reference Terauchi, Kobayashi, Okuma, Oba, Nishiyama and Kainosho2008).

4.1.3 Cysteine
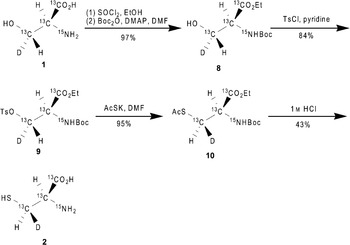
A technique of stereoselective labeling with deuterium at the β-position of cysteine was developed starting with the enzymatic reaction of fumaric acid to produce malic acid, which would form (2S,3S)-[3-2H]cystine (Axelsson et al. Reference Axelsson, Otoole, Spencer and Young1991). Also the preparation of (2S,3R)-[3-2H]serine and (2R,2′R,3S, ′S)-[3,3′-2H2]cystine starting from (2R)-serine were described (Oba et al. Reference Oba, Iwasaki, Hitokawa, Ikegame, Banba, Ura, Takamura and Nishiyama2006). Although these methods would be sufficiently affordable for application to both SAIL serine and SAIL cysteine with minor variations, they could not be applied to the SAIL method because of difficulties in the procurement of materials and low yield. As an alternative, the synthesis of SAIL cysteine using SAIL serine 2,6,7-trioxabicyclo[2,2,2]octyl ester was considered (Oba et al. Reference Oba, Iwasaki, Hitokawa, Ikegame, Banba, Ura, Takamura and Nishiyama2006). However, this method suffers from poor reproducibility, and similar to SAIL serine starting from [1,2,3-13C;15N]serine, it is difficult to increase the scale of the production capacity.
Instead, SAIL cysteine can be obtained from the abovementioned SAIL serine by converting the hydroxyl group of serine into a thiol group, by an SN2-type displacement (Terauchi et al. Reference Terauchi, Kobayashi, Okuma, Oba, Nishiyama and Kainosho2008). Following a scheme developed by Arnold et al. (Arnold et al. Reference Arnold, Kalantar and Vederas1985, Reference Arnold, May and Vederas1988; Ramer et al. Reference Ramer, Moore and Vederas1986; Williams, Reference Williams and Baldwin1989), the synthesis of SAIL cystine ((2R,2′R,3S,3S)-[1,1′,2,2′,3,3′-13C6,2,2′-15N2;3,3′-2H2]cystine) could be accomplished with a 35% overall yield, although potentially risky chemicals, such as dimethyl azodicarboxylate, were used. To avoid potentially hazardous reaction materials, a more easily accessible means to synthesize the stereoisomer at the β-position of SAIL cysteine was also examined (Fig. 6). The (2S,3R)-N-benzoyl serine ethyl ester 7 was converted to tosylate and then treated with potassium thioacetate to give the (2R,3S)-cysteine derivative. Although the displacement at the β-position by the thioacetate anion proceeded with inversion, unfortunately, the yield was low, due to by-product formation. However, changing the protection to use the t-butoxycarbonyl group prevented the by-product formation. Thus, derivative 8, derived from SAIL serine 1, was subjected to tosylation followed by thioacetylation by potassium thioacetate, to yield the deuterium-labeled cysteine derivative 10 (Fig. 6). The deprotection of compound 10 was accomplished by refluxing with 1 m HCl, and the resulting SAIL cysteine hydrochloride 2 ((2R,3R)-[1,2,3-13C3;2-15N;3′-2H] cysteine) was purified by ion-exchange column chromatography on a DOWEX 50WX8 column with 43% yield. The enantiopurity of the α-position of amino acid 2 was determined to be 95% ee, by an HPLC analysis using a chiral stationary column (DAICEL CROWNPAK CR+).
Synthesis of SAIL cysteine (Terauchi et al. Reference Terauchi, Kobayashi, Okuma, Oba, Nishiyama and Kainosho2008).

4.1.4 Alanine
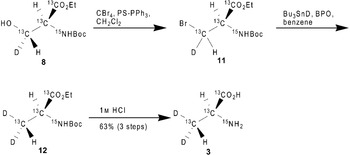
SAIL alanine 3 is dideuterated at the β-position, in order to increase the signal intensity (Fig. 3). This labeling pattern is optimized for larger proteins. The synthesis of SAIL alanine (Terauchi et al. Reference Terauchi, Kobayashi, Okuma, Oba, Nishiyama and Kainosho2008) employs deoxygenation of the hydroxyl group of the SAIL serine derivative 8 (Fig. 7). Derivative 8 was treated with polymer-supported triphenylphosphine and carbon tetrabromide for conversion to the bromoalanine derivative 11, after which derivative 11 was reduced with tributyltin deuteride, to give derivative 12. The deprotection of compound 12 was carried out by refluxing with 1 m HCl, and the resulting alanine hydrochloride was subjected to ion-exchange column chromatography, using a DOWEX 50WX8 column, to give SAIL alanine 3 ((2S)-[1,2,3-13C3;2-15N;3,3-2H2]alanine) in 63% yield from derivative 8. The enantiopurity at the α-position was determined to be 93% ee by an HPLC analysis using a chiral stationary column (SUMICHIRAL OA-6100).
Synthesis of SAIL alanine (Terauchi et al. Reference Terauchi, Kobayashi, Okuma, Oba, Nishiyama and Kainosho2008).

4.1.5 Glutamic acid
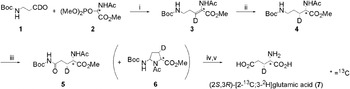
Although several groups had reported the stereoselective synthesis of glutamic acid derivatives with stereospecific deuterium labeling, these synthetic routes were not suitable for regioselective 13C labeling coupled with deuterium labeling because the starting 13C-labeled materials were unavailable. However, (2S,3S)- and (2S,3R)-[2-13C;3-2H]glutamic acid can be obtained from commercially available materials by a straightforward synthesis via the asymmetric hydrogenation of a 2,3-didehydroamino acid derivative using an α-oxoglutarate or a dehydroserine derivative as the starting material (Okuma et al. Reference Okuma, Ono, Tsuchiya, Oba, Nishiyama, Kainosho and Terauchi2009). This report describes a simple method for the synthesis of [2-13C;3-2H] glutamic acid, routed through ornithine as the key intermediate. Asymmetric hydrogenation of the [2-13C;3-2H] 2,3-didehydroornithine derivative, which is derived from readily available [2-13C] glycine and β-alanine, is carried out to yield an ornithine derivative labeled with deuterium at the β-position. This is stereoselectively followed by conversion of the derivative into the target [2-13C;3-2H] glutamic acids by oxidation of the δ-position.
As shown in Fig. 8, the synthesis of (2S,3R)-[2-13C;3-2H] glutamic acid (7) started with the preparation of the stable isotope-labeled dehydroornithine derivative (3) using the Horner-Wadsworth-Emmons reaction. The starting N-Boc-3-amino[1-2H]propionaldehyde (1) was prepared by the reduction of the Weinreb amide of N-Boc-β-alanine with lithium aluminum deuteride (LiAlD4) and was then condensed with phosphoryl[2-13C]glycine ester (2) in the presence of 1,8-diazabicyclo[5·4·0]undec-7-ene (DBU) to give 2,3-didehydro[2-13C;3-2H]-ornithine (3) in 71% yield. Highly Z-selective olefination was observed when the reaction was conducted at −25°C. Asymmetric hydrogenation of the obtained dehydroornithine (3) was carried out under medium pressure (0·4 MPa) of hydrogen in the presence of (+)-1,2-bis[(2S,5S)-2,5-diethylphospholano]benzene(cyclooctadiene)rhodium(I) trifluoromethanesulfonate [(S,S)-Et-DuPHOS-Rh], because the DuPHOS family of catalysts is highly efficient for the hydrogenation of β-monosubstituted acetamidoacrylates, yielding a variety of amino acids with high enantioselectivities. A DuPHOS-Rh catalyst was also employed for the asymmetric hydrogenation of dehydroserine derivatives (Terauchi et al. Reference Terauchi, Kobayashi, Okuma, Oba, Nishiyama and Kainosho2008). The stereochemistry at the α and β positions of [2-13C;3-2H]ornithine (4) was determined after the final glutamic acid was obtained.
Synthesis of SAIL glutamic acid (Okuma et al. Reference Okuma, Ono, Tsuchiya, Oba, Nishiyama, Kainosho and Terauchi2009). Reagents and conditions: (i) DBU, CH2Cl2, −25°C, 71%; (ii) (S,S)-Et-DuPHOS-Rh, benzene, H2 (0·4 MPa), 84%; (iii) RuO2, NaIO4, ethyl acetate-H2O, 38%; (iv) 2 m HCl reflux; (v) DOWEX 50WX8, 70% (2 steps).

The conversion of ornithine (4) to glutamine (5) was performed using a catalytic amount of ruthenium dioxide and an excess of sodium periodate in a two-phase system of ethyl acetate and water. However, [2-13C;3-2H]glutamine (5) was obtained in only 38% yield because of the considerable side reaction yielding the cyclic compound 6. Hydrolysis of 5 was performed by refluxing it in 2 m HCl, and subsequent ion exchange treatment of the obtained glutamic acid hydrochloride with DOWEX 50WX8 afforded (2S,3R)-[2-13C;3-2H]glutamic acid (7) in 70% yield. The enantiopurity based on the α-position was determined to be 99% ee by HPLC analysis using a chiral column (MCIGEL CRS10W). This stereochemical outcome can be attributed to the exclusive cis-addition of hydrogen to the α-re-face of deuterated (Z)-2,3-didehydroornithine (3), promoted by the (S,S)-Et-DuPHOS-Rh catalyst.
4.2 Cell-free protein synthesis
Cell-free protein expression methods (Kigawa et al. Reference Kigawa, Muto and Yokoyama1995; Zubay, Reference Zubay1973) are crucial to make efficient use of the SAIL amino acids and to prevent scrambling of the label, which would occur through metabolic pathways present in cell-based protein expression systems (Arata et al. Reference Arata, Kato, Takahashi and Shimada1994; McIntosh & Dahlquist, Reference McIntosh and Dahlquist1990).
Cell extracts from several organisms have been used for the purpose of cell-free protein synthesis (Clemens & Prujin, Reference Clemens and Prujin1999; Kramer et al. Reference Kramer, Kudlicki and Hardesty1999). Proteins that cannot be produced from cells because they are toxic to the host cells can be made from cell-free systems (Chrunyk et al. Reference Chrunyk, Evans, Lillquist, Young and Wetzel1993; Henrich et al. Reference Henrich, Lubitz and Plapp1982). In addition, proteins that tend to be digested by intracellular proteases (Goff & Goldberg, Reference Goff and Goldberg1987; Maurizi, Reference Maurizi1987) or to aggregate in inclusion bodies (Chrunyk et al. Reference Chrunyk, Evans, Lillquist, Young and Wetzel1993) in cells can sometimes be produced from cell-free extracts. With cell-free systems, proteins can be made from PCR-amplified DNA in as high yields as from plasmid DNA (Wu et al. Reference Wu, Ozawa, Lim, Vasudevan, Dixon and Otting2007). Labeled amino acids can be incorporated efficiently and with minimal scrambling of the label, because the amino acid metabolic activity of cell-free extracts is low (Kigawa et al. Reference Kigawa, Muto and Yokoyama1995). Cell-free systems are now considered as alternatives to conventional in vivo expression. Commercial products provide convenience and improved protein yields (Betton, Reference Betton2003). Protein synthesis can also be carried out by the ‘PURE’ system, which was reconstituted from purified components of the translation machinery (Shimizu et al. Reference Shimizu, Inoue, Tomari, Suzuki, Yokogawa, Nishikawa and Ueda2001).
Cell-free systems offer particular advantages for preparing samples for NMR spectroscopy. One can take advantage of the inactive amino acid metabolism for stable isotope labeling, particularly for selective labeling (Guignard et al. Reference Guignard, Ozawa, Pursglove, Otting and Dixon2002; Kigawa et al. Reference Kigawa, Muto and Yokoyama1995, Reference Kigawa, Yabuki, Yoshida, Tsutsui, Ito, Shibata and Yokoyama1999; Klammt et al. Reference Klammt, Löhr, Schäfer, Haase, Dötsch, Rüterjans, Glaubitz and Bernhard2004; Shi et al. Reference Shi, Pelton, Cho and Wemmer2004). A good cell-free system for NMR spectroscopy is capable of producing milligram-scale samples of labeled protein in a robust, reproducible fashion at reasonable cost. Commercial cell-free systems, including the PURE system, however, are relatively expensive.
Efficient incorporation of the SAIL amino acids into the protein of interest without metabolic scrambling can be achieved by an E. coli cell-free protein synthesis system (Fig. 9) that was optimized for the preparation of labeled NMR samples (Takeda et al. Reference Takeda, Ikeya, Güntert and Kainosho2007; Torizawa et al. Reference Torizawa, Shimizu, Taoka, Miyano and Kainosho2004) and overcomes two major problems with conventional E. coli cell-free systems: the production of protein mixtures with heterogeneous N-termini and the dilution of added labeled amino acids by endogenous amino acids of natural abundance from the extract.
Flow chart of the cell-free protein synthesis strategy used for preparing SAIL protein samples for NMR analysis (Torizawa et al. Reference Torizawa, Shimizu, Taoka, Miyano and Kainosho2004).

4.2.1 Validation of E. coli expression
One of the advantages of cell-free systems is that they can sometimes produce proteins that cannot be expressed by in vivo methods (Chrunyk et al. Reference Chrunyk, Evans, Lillquist, Young and Wetzel1993; Goff & Goldberg, Reference Goff and Goldberg1987; Henrich et al. Reference Henrich, Lubitz and Plapp1982; Maurizi, Reference Maurizi1987). With the exception of such cases, it is recommendable to carry out both E. coli cellular expression and cell-free production of the target protein with uniform 15N labeling, for the following reasons: (i) This allows for a comparison between the NMR spectra obtained from in vivo and in vitro expression. [1H,15N]-HSQC spectra from both approaches should be compared carefully to detect any possible difference between in vivo and in vitro expression. (ii) It is less costly and requires less effort to produce proteins from E. coli cells than by the cell-free method. Thus, protein prepared by the former method can be used to work out the purification protocols and to search for optimal solution conditions before preparing the protein by cell-free methods. (iii) Most proteins that express well in E. coli cells can be produced successfully by the cell-free method. Of 44 proteins that could be expressed in E. coli, 35 (80%) were found to work well also in the cell-free synthesis system (Fig. 10). Thus, a protein that has been shown to express well in E. coli cells has a good chance of being produced well in the cell-free system. It is recommendable to carry out both E. coli cellular expression and cell-free production of the target protein with uniform 15N labeling. This allows for a comparison between the NMR spectra obtained from in vivo and in vitro expression. [1H,15N]-HSQC spectra from both approaches should be compared carefully to detect any possible differences between in vivo and in vitro expression.
SDS-PAGE analyses of proteins synthesized by the small scale cell-free system for preparing labeled proteins (Torizawa et al. Reference Torizawa, Shimizu, Taoka, Miyano and Kainosho2004): 1, EPPIa; 2, EPPIb; 3, E. coli parvulin; 4, human parvulin; 5, human parvulin without WW domain; 6, DSBa; 7, DSBc; 8, DSBg; 9, DSBe; 10, drk SH3 domain; 11, CAT1; 12, Calcineurin B; 13, α-spectrin SH3 domain; 14, alkaline phosphatise; 15, SSI; 16, CPI17(35–120); 17, FKBP12.6; 18, GroES; 19, SecB; 20, SecE; 21, leader peptidase; 22, OmpA1; 23, IP3 receptor; 24, RuvC; 25, T. martina RuvC; 26, At5g45600; 27, At5g24650; 28, At4g20010; 29, At2g02570; 30, At1g18800; 31, calmodulin; 32, At3g16450; 33, MBP; 34. β-subunit; 35, GFPuv. ‘M’ denotes molecular weight markers. The synthesized proteins are indicated by arrows. Both soluble and insoluble fractions were loaded onto the gel.

4.2.2 Construction of cell-free protein synthesis system
The preparation of S30 extract is critical to the success of the system. As most investigators and commercial vendors of cell-free systems have emphasized, the most important issue is the level of activity of the extract (Kigawa et al. Reference Kigawa, Yabuki, Yoshida, Tsutsui, Ito, Shibata and Yokoyama1999; Kim et al. Reference Kim, Kigawa, Choi and Yokoyama1996; Kim & Swartz, Reference Kim and Swartz2000; Madin et al. Reference Madin, Sawasaki, Ogasawara and Endo2000; Spirin et al. Reference Spirin, Baranov, Ryabova, Ovodov and Alakhov1988). E. coli strain A19 yielded a reliable extract because of its lack of RNase I (Kim & Swartz, Reference Kim and Swartz2000). The strain BL21 Star (DE3) lacking the activity of RNase E was shown to have a 1·2–1·4 times higher activity than A19 and was therefore chosen for the extract. The activity is strongly dependent on how the extract is prepared and on its concentration.
The concentration of the extract should be optimized to maximize the amount of protein (Kigawa et al. Reference Kigawa, Yabuki, Yoshida, Tsutsui, Ito, Shibata and Yokoyama1999). For labeled NMR samples, a higher concentration of extract not only leads to higher yields of protein, but also to a dilution of the label by endogenous amino acids in the extract. This problem of label dilution has been analyzed (Torizawa et al. Reference Torizawa, Shimizu, Taoka, Miyano and Kainosho2004). The labeling efficiency for [2H,13C,15N]-calmodulin produced from a conventional cell-free extract prepared without gel filtration was only about 90%. By introducing a gel filtration step, the incorporation level increased to 96% without loss of the activity of the extract.
The extract described in Section 4.2.3 produced up to 2 mg (EPPIb) protein per milliliter of the reaction solution under optimal concentrations of added amino acids (1 mm each). The yield of protein decreases as the levels of added amino acids are increased, although the labeling efficiency increases. In the case of calmodulin, the optimal concentration for the amino acid mixture was determined to be 1·7 mg/ml by analyzing protein yields as a function of concentration and by choosing a value slightly below the maximum. Because the labeled amino acids represent the most important cost factor, the mole ratios of the individual amino acids were adjusted to match the amino acid composition of calmodulin, with the exception that the mole ratio of Gly was increased by a factor of 4. A sample of [13C,15N]-calmodulin prepared using the dialyzed extract with the optimal level of amino acids was hydrolyzed into amino acids and analyzed by LC-MS/MS and CE-MS in order to investigate the percentage of unlabeled amino acids incorporated into the protein. These were: Gly, 2·2%; Ala, 2·9%; Ser, 3·2%; Pro, 3·2%; Val, 3·7%; Thr, 2·3%; Leu, 3·6%; Asx, 7·5%; Lys, 4·5%; Glx, 0·8%; Met, 1·9%; His, 2·2%; Phe, 1·8%; Arg, 5·7%; and Tyr, 3·0%. When the amount of Gly added was not increased by a factor of 4, the level of incorporation of unlabeled Gly increased to 12·7%. This is the reason why a higher concentration of Gly was used. If necessary, the levels of other unlabeled amino acids can be decreased by increasing the amounts of the labeled species.
Cell-free protein synthesis systems usually use a large amount of a plasmid containing sequences coding for the target protein, a promoter and a terminator for T7 RNA polymerase. High-copy-number plasmids can reduce the cost and time required to produce the template DNA. The pIVEX vector provided by Roche has the advantage over other high-copy plasmids that it enables the prediction of silent mutants that can improve cell-free synthesis yields as discussed in Section 4.2.6.
4.2.3 Preparation of S30 extract
The preparation of a S30 extract is based on earlier work (Davanloo et al. Reference Davanloo, Rosenberg, Dunn and Studier1984; Kigawa et al. Reference Kigawa, Yabuki, Yoshida, Tsutsui, Ito, Shibata and Yokoyama1999; Pratt, Reference Pratt1984; Zubay, Reference Zubay1973) and optimized for the in vitro synthesis of SAIL proteins (Takeda et al. Reference Takeda, Ikeya, Güntert and Kainosho2007), since commercially available S30 extracts often contain non-labeled amino acids, which results in the incorporation of non-labeled amino acids into the protein (Torizawa et al. Reference Torizawa, Shimizu, Taoka, Miyano and Kainosho2004). It comprises the following steps:
(1) Inoculate stock of E. coli (A19, BL21 Star etc.) into 10 ml of LB medium in a 50-ml tube and grow the cells overnight at 37°C with shaking.
(2) Inoculate 10 ml of the culture medium into 1 l of incomplete rich medium in a 2-l flask.
(3) Grow the cells at 37°C with shaking to an OD650 of 0·7. The growth rate of the cells in the culture correlates with the activity of the resulting extract.
(4) Centrifuge the cells (5000 g, 4°C, 10 min) and wash them with 200 ml of ice-cold S30 buffer containing 0·05% 2-mercaptoethanol by suspending moderately three times. Foaming of the suspension must be avoided. Can be left overnight in the centrifuge tube at – 80°C.
(5) Gently resuspend the cell pellet with 200 ml of ice-cold S30 buffer containing 0·05% (v/v) 2-mercaptoethanol by slurrying. Centrifuge them (5000 g, 4°C, 10 min) and weigh the E. coli pellets. Resuspend the pellet in 1·27 ml of S30 buffer per gram of E. coli.
(6) Disrupt the cells with the French press at 20 000 psi (1400 kg cm−2). Add 30 μl of 1 m dithiothreitol (DTT) to the lysate. Centrifuge (30 000 g, 4°C, 30 min) using DEPC-treated/autoclaved centrifuge tubes. Carefully remove approximately 1·4 ml of the supernatant per gram of E. coli without mixing with the precipitate.
(7) Transfer the supernatant to the unused DEPC-treated/autoclaved tubes. Centrifuge them (30 000 g, 4°C, 30 min) and remove approximately 1·0 ml of the supernatant per gram of E. coli into a 50-ml tube.
(8) Shake the tube at 37°C for 80 min.
(9) Dialyze the solution at 4°C for 45 min against 2 l of S30 buffer using a dialysis tube with molecular weight cutoff (MWCO) of 6000–8000. Allow a little air into the tube to float. Repeat the dialysis twice. Centrifuge (15 000 g, 10 min, 4°C). The dialysis tube should be treated with DEPC-containing water and then rinsed with RNase-free water before use.
(10) Fill an open column (Econo-column chromatography column 2·5×20 cm) with Sephadex G25 resin uniformly and set the column vertically in cold space. Attach an Econo-column funnel to the top end of the column. Pour the 500 ml of S30 buffer from the funnel into the column. Note, that the uniformity of the filled resin affects resolution of gel filtration.
(11) Apply the supernatant from step 9 to a column that was pre-equilibrated at step 10 at 4°C. After loading the supernatant, continue to supply the funnel with the S30 buffer to maintain the flow in the column. When the first fraction reached to the bottom, start to collect 1·4 times the volume of the applied extract. Determine the first fraction judging from its colour and turbidity. The fraction to be collected looks yellow.
(12) Dialyse the eluate at 4°C for 70 to 80 min against 700 ml of an equal weight mixture of PEG-8000 and S30 buffer. Before use, the PEG-S30 buffer at 4°C should always be stirred to avoid PEG deposition. Adjust the dialysis time so as to concentrate the extract up to 0·86 times the volume. Dialyze it at 4°C for 60 min against 2 l of S30 buffer.
(13) Transfer the extract to 1·5-ml tubes. Freeze the tubes with liquid nitrogen. Store them at −80°C.
Instruments and glassware used in preparing S30 extracts and in cell-free synthesis reactions were washed with autoclaved water containing 0·5% (v/v) DEPC (denoted as DEPC-treated water) and subsequently autoclaved if possible.
4.2.4 Preparation of SAIL proteins by the E. coli cell-free method
The preparation of a SAIL protein NMR sample by the E. coli cell-free method comprises the following steps (Takeda et al. Reference Takeda, Ikeya, Güntert and Kainosho2007):
(1) Prepare the reaction solution and the dialysis solution by mixing the components as shown in Table 1. Dissolve SAIL amino acid mixture in water and then add it to the cell-free reaction solution. If SAIL amino acids appear insoluble in water, warm it up to 60°C. Use sanitary gloves to prevent contamination with RNases. Thaw the frozen S30 extract on ice. Prepare creatine phosphate in RNase-free water just before use. An excess of heating to SAIL amino acid may cause a racemization especially at high pH.
Table 1.Composition of reaction and dialysis solutions in cell-free reactions for SAIL protein synthesis (Takeda et al. Reference Takeda, Ikeya, Güntert and Kainosho2007)

* Low molecular weight mixture. For 200 ml, combine 22 ml 2 m HEPES-KOH pH 7·5, 33·4 ml 6 m K(OAc), 210 mg DTT, 530 mg ATP, 338 mg CTP, 335 mg GTP, 310 mg UTP, 172 mg cAMP, 28 mg folinic acid, 140 mg tRNA, 64 ml 50% (w/v) PEG-8000, and RNase-free water (Takeda et al. Reference Takeda, Ikeya, Güntert and Kainosho2007).
(2) Cut outer tube of the Float-A-Lyzer at an appropriate height such that inner solution in tube is completely soaked to the dialysis solution when an inner membrane apparatus is set to the outer tube. Pour the dialysis solution into the outer tube. Place the inner membrane apparatus of the Float-A-Lyzer into the outer tube and pour the reaction solution into the inner membrane. Cover the tube with Parafilm.
(3) Shake the tube to allow for production of target proteins. The optimal temperature and incubation times should be determined in small-scale cell-free reactions with volumes of the reaction and dialysis solutions of 0·5 and 2·0 ml, respectively, before the large-scale reaction.
(4) Retrieve the reaction solution and the dialysis solution. If the produced protein has a molecular weight smaller than MWCO of the membrane, check the outer solution for presence of the protein.
(5) Purify the produced protein according to purification procedures of the target protein. The N-terminus of the protein produced by cell-free expression may be heterogeneous due to incomplete deformylation by peptide deformylase. This can be overcome by using a cleavable N-terminal tag (Torizawa et al. Reference Torizawa, Shimizu, Taoka, Miyano and Kainosho2004).

The approach has been used successfully for the cell-free production of a large number of proteins (Torizawa et al. Reference Torizawa, Shimizu, Taoka, Miyano and Kainosho2004). SDS-PAGE analyses of many of the proteins synthesized by the cell-free system are shown in Fig. 10.
4.2.5 Validation of cell-free synthesis of the protein
Small-scale reactions are useful for determining whether a target protein is synthesized or not. The recommended composition of reagents in the small scale reaction is the same as in the large-scale reaction used for preparation of the NMR sample, with the important difference of PEG-8000. PEG plays an important role as a stabilizer of the system (Kim & Swartz, Reference Kim and Swartz2000). In the case of calmodulin, the ratio of protein yields with and without PEG-8000 was 1·6 (Torizawa et al. Reference Torizawa, Shimizu, Taoka, Miyano and Kainosho2004). Even a small amount of PEG can disturb the SDS-PAGE quantitation of the level of production of a target protein, despite attempts to remove PEG by acetone or TCA precipitation of protein. For example, after cell-free synthesis and before purification, the SDS-PAGE band from acetone- or TCA-precipitated calmodulin was not observed, although it could be observed following purification. For this reason, PEG should be omitted from small-scale screening reactions.
4.2.6 Improvement of the yield of synthesized protein
It has been reported that the yield of proteins from E. coli cell-free synthesis is dependent on the concentrations of magnesium ions and template DNA (Kramer et al. Reference Kramer, Kudlicki and Hardesty1999). Table 1 shows the composition of the reaction and dialysis solutions that was nearly optimal for the cell-free synthesis of many proteins (Takeda et al. Reference Takeda, Ikeya, Güntert and Kainosho2007). This can be improved to increase the yield of a particular protein. A better yield can also be achieved by optimizing the sequence of the template DNA. The ProteoExpert software (Roche Applied Science; Biomax) was used to predict potentially yield-increasing silent mutants that do not alter the amino acid sequence of the resulting protein. This empirical prediction is based, in part, on calculations of the secondary structure of the mRNA including the pIVEX vector and the target gene, although full details on the algorithm are unavailable. One round of calculations provides 10 suggested candidates for silent mutations in the region close to the N-terminus of the protein. Roche recommends to introduce these mutations by PCR into linear templates and to use small-scale syntheses to check the relative yields. The mutated sequence that gives the highest yield is then transferred to a circular template and used for large-scale reactions.
Designing oligonucleotides with the best silent mutations and introducing them into the circular plasmid by restriction enzymes and ligase avoids possible difficulties and errors of the PCR reaction. For calmodulin, the protein yields with 2 of the 10 plasmids incorporating silent mutations were much higher than with the original plasmid. In the large-scale reaction carried out with the best sequence and 51·1 mg of amino acid mixture (1·7 mg/ml), the amount of calmodulin synthesized was 5·2 mg (10 wt%). This was twice the yield from the construct before the silent mutagenesis.
The silent mutations in the DNA sequences of a cleavable N-terminal tag are often identical for different proteins. Therefore, it is in general unnecessary to prepare all of the predicted tag DNAs for each protein carrying the tag. This reduces the cost and time to prepare all of the 10 (20 including the complimentary strands) DNAs each time. Two kinds of tags with a variety of the silent mutations were prepared (Torizawa et al. Reference Torizawa, Shimizu, Taoka, Miyano and Kainosho2004). One tag has the same amino acid sequence as that of pET15b, namely, a (His)6-tag followed by a thrombin cleavage site; the other is identical except for the absence of the (His)6-tag. The former is used for easy purification of proteins by immobilized metal affinity chromatography, and the latter is used in cases where the protein of interest can be purified easily by other means. Both of the tags can be cleaved with thrombin. The cleavage can generate another important advantage as described in the next section. Constructs with a cleavable tag are preferred, provided that protein production is adequate, because they will ensure a homogeneous N-terminus of the protein as described in the next section.
4.2.7 N-terminal heterogeneity in cell-free protein synthesis
The [1H,15N]-HSQC spectrum of calmodulin synthesized by the cell-free system using the native sequence showed more peaks than predicted from the sequence, although the purified protein was observed as a single band by SDS-PAGE (Torizawa et al. Reference Torizawa, Shimizu, Taoka, Miyano and Kainosho2004). Doubled peaks were found to arise from the six N-terminal residues and, with smaller chemical shift differences, for eight residues in other regions. Intensities of the superfluous peaks were not always completely reproducible. N-terminal sequencing and mass spectrometry showed that the sample consisted of three molecular species: one with N-terminal formyl Met (f-Met0) (60%–90%), one with N-terminal Met 0 (~10%) and one with N-terminal Ala 1 (10%–40%). Also for the protein EPPIb with 164 amino acid residues, 33 additional peaks were observed in the [1H,15N]-HSQC spectrum of the protein prepared by the cell-free system compared with the spectrum of the protein produced in E. coli cells (Torizawa et al. Reference Torizawa, Shimizu, Taoka, Miyano and Kainosho2004).
This problem could be overcome by producing the protein with a cleavable N-terminal tag, which can simultaneously be engineered to improve protein yields. The [1H,15N]-HSQC spectrum of calmodulin produced in this way showed no detectable extra peaks (Torizawa et al. Reference Torizawa, Shimizu, Taoka, Miyano and Kainosho2004). It is noteworthy that NMR signals from calmodulin, which has a flexible N-terminus, are affected by the heterogeneity and that the region affected is quite extensive. Larger spectral complications may arise from heterogeneity of the peptide chain for proteins with a structured N-terminus.
4.2.8 Large-scale protein production for NMR samples
In large-scale protein preparations, it is critical to minimize losses of the product. The MWCO of the membrane used for the cell-free reaction should be 50 kDa, because membranes with a smaller MWCO reduce the yield of protein (Kigawa et al. Reference Kigawa, Yabuki, Yoshida, Tsutsui, Ito, Shibata and Yokoyama1999). Because this cutoff is larger than most of the proteins that are prepared for NMR spectroscopy, much of the synthesized protein goes into the outer dialysis solution during the reaction. For calmodulin (17 kDa) after the 7 h reaction, the amount of protein product in the inner reaction solution equalled that in the outer solution, although the protein in the outer chamber sometimes could not be detected well by SDS-PAGE owing to the dilution factor (Torizawa et al. Reference Torizawa, Shimizu, Taoka, Miyano and Kainosho2004). Hence, the synthesized protein was retrieved from both solutions. The purification protocol must also be optimized for large-scale production. It is frequently advantageous to dialyze the protein before the first chromatography step, either to remove salts before binding to an ion-exchange column or to remove nucleic acids or other contaminants that may interfere with chromatography.
It may be better to dialyze the solutions against the buffer used for the first purification step. Although a protein with a (His)6-tag can be purified easily by Ni affinity chromatography, DTT in the system sometimes disturbs the purification if chromatography is adopted as the first step. The presence of DTT in the S30 extract is necessary for preserving its activity over time. S30 extracts prepared with and without DTT have equivalent activity initially, but the activity of the extract without DTT is reduced to 80%–90% after only 3 months of storage at −80°C (Torizawa et al. Reference Torizawa, Shimizu, Taoka, Miyano and Kainosho2004).
The cell-free protein expression protocol presented in this section can efficiently produce proteins in the quantities required for multidimensional NMR measurements. For instance, 55 mg of SAIL amino acid mixture, composed following this protocol, yielded 5·5 mg of purified, soluble 17 kDa calmodulin, or 5·3 mg of purified, soluble 41 kDa maltodextrin-binding protein (MBP) (Kainosho et al. Reference Kainosho, Torizawa, Iwashita, Terauchi, Ono and Güntert2006).
4.3 SAIL NMR spectroscopy
4.3.1 General considerations
Virtually all types of biomolecular NMR experiments benefit from SAIL and can be used with minimal changes. When collecting and analyzing data for a SAIL protein, deuterium decoupling should be applied during 13C evolution times to avoid splitting by the 13C-2H coupling, and what are methyl and methylene groups in uniformly labeled proteins should be treated as methine groups. Constant-time [1H-13C]-HSQC NMR data sets collected from SAIL and uniformly labeled proteins clearly demonstrate the superiority of the SAIL method (Figs 11 and 12). Each 1H-13C pair in the protein is associated with a peak in the spectrum. Severe signal overlap in the case of uniform labeling is alleviated in the spectrum from the SAIL proteins. The improvements, which are particularly apparent for larger proteins (Fig. 12), result from the reduction in the number of 1H signals as well as from sharpening of the remaining signals.
Constant-time [13C,1H]-HSQC spectra of CaM (Kainosho et al. Reference Kainosho, Torizawa, Iwashita, Terauchi, Ono and Güntert2006). (a) SAIL-CaM, aliphatic region. (b) SAIL-CaM, methyl region. (c) SAIL-CaM, methylene region. (d) UL-CaM, aliphatic region. (e) UL-CaM, methyl region. (f) UL-CaM, methylene region. (g) SAIL-CaM, Arg δ region. (h) UL-CaM, Arg δ region. (i) Cross-sections from g and h. The spectra for SAIL-CaM and UL-CaM were recorded under identical conditions and scaled for equal noise levels. Assignments are indicated by one-letter amino acid code, residue number and atom identifier. Assignments of UL-CaM are as reported previously (Ikura et al. Reference Ikura, Spera, Barbato, Kay, Krinks and Bax1991).

Constant-time [13C,1H]-HSQC spectra of MBP (Kainosho et al. Reference Kainosho, Torizawa, Iwashita, Terauchi, Ono and Güntert2006). (a) Aliphatic region of CDH groups in SAIL-MBP. (b) Enlargement of the rectangular region marked in a. Assignments are indicated with one-letter amino acid code, residue number and atom identifiers. (c) and (d) Corresponding regions for UL-MBP. (e) Cross-sections taken at the positions indicated in b and d. The spectra for SAIL-MBP and UL-MBP were recorded under identical conditions and scaled for equal noise levels.

The SAIL method also improved sensitivity. Part of the gain arises from longer 1H and 13C transverse relaxation times resulting from substitutions of 1H by 2H. Reduced relaxation during magnetization transfer steps in experiments such as constant-time [1H-13C]-HSQC leads to increased signal-to-noise ratio. Reduced long-range couplings result in a further sharpening of signals. The signal intensities for methylene groups are three to seven times higher with SAIL than with uniform labeling under the same conditions. Improvements are more pronounced for the 41-kDa maltodextrin-binding protein MBP protein (Fig. 12e) than for the 17-kDa calmodulin (Fig. 11i). Although each observed SAIL methyl group contained only one 1H as compared with three equivalent 1H with uniform labeling, comparable signal intensities were observed for methyl groups as a result of the longer 1H and 13C transverse relaxation times. All peaks benefited from improved sensitivity and resolution and allowed the signals of SAIL-calmodulin and SAIL-MBP to be assigned readily by established methods. Side-chain assignments were determined from the analysis of two data sets: HCCH-TOCSY spectra provided connectivities among all side-chain signals and HCCH-COSY spectra were used to identify the spin systems.
4.3.2 Assignment of aromatic ring signals
Since aromatic amino acid residues are often located in the hydrophobic core regions of proteins, the extensive collection of NOE restraint data involving aromatic ring signals is essential for accurate protein structure determination. However, it is often difficult to analyze these spectral regions in uniformly 13C/15N-labeled proteins, especially for Phe and Tyr residues. In addition to the inherently low sensitivity, the resonances of the δ, ε, and ζ ring carbons of Phe residues and the δ carbons of Tyr residues are prone to overlap with each other in NMR spectra. Such limited chemical shift dispersion and strong 13C-13C spin couplings hamper the spectral analyses, especially for Phe residues. Slow ring flipping motions, which have occasionally been reported in the literature (Campbell et al. Reference Campbell, Dobson, Moore, Perkins and Williams1976; Wagner et al. Reference Wagner, DeMarco and Wüthrich1976), make the NMR signals for the δ and ε atoms of some Phe and Tyr residues even more difficult, or sometimes impossible, to observe (Takeda et al. Reference Takeda, Chang, Ikeya, Güntert, Chang, Hsu, Huang and Kainosho2008a).
In the SAIL aromatic amino acids, new 2H, 13C labeling patterns were introduced to make the NMR spectra for aromatic resonances simple and sensitive and to facilitate their spectral assignment using exclusively through-bond correlations (Torizawa et al. Reference Torizawa, Ono, Terauchi and Kainosho2005). Fig. 13 illustrates the repertoire of the currently available SAIL Phe and SAIL Tyr amino acids. In the [13Cγ,13Cε,1Hε]-Tyr/Phe pattern (ε-SAIL Tyr/Phe), all non-exchangeable hydrogens in the aromatic rings, except for the ε position, were replaced with 2H, and only the carbons at the γ and ε positions were labeled with 13C. In the other pattern, denoted as [13Cγ,13Cζ,1Hζ]-Phe (δ-SAIL Phe), the hydrogens at the δ and ε positions of Phe were replaced with 2H, and the carbons at the γ and ζ positions were labeled with 13C. In all cases, the aliphatic moieties were uniformly labeled with 13C and 15N, and the pro-R hydrogen of the β-methylene group was stereospecifically labeled with 2H, thus enabling the unambiguous stereospecific assignment of the prochiral methylene signals. All of the SAIL Phe and Tyr residues lack directly bonded aromatic 13C-13C pairs in order to avoid strong one-bond 13C-13C scalar couplings, and the alternate 2H labeling eliminates large scalar and dipolar interactions among the ring protons.
Stable isotope labeling patterns for Phe and Tyr and magnetization transfer pathways for HBCBCGHE and HBCBCGCZHZ measurements. (a) 13Cγ-13Cε-1Hε pattern for [Hβ-13Cβ-13Cγ-13Cε-1Hε]-Tyr/Phe. (b) 13Cγ-13Cζ-1Hζ pattern for [Hβ-13Cβ-13Cγ-13Cζ-1Hζ]-Phe. 12C atoms are not shown in the figures. Arrows indicate the magnetization transfer pathways. In both cases, the transfer started from 1Hβ.

Fig. 14 compares the aromatic regions of [1H,13C]-HSQC spectra of calmodulin containing either uniformly [13C,15N]-labeled Tyr/Phe, ε-SAIL Tyr/Phe or δ-SAIL Phe. It is obvious that severe signal overlap observed for uniformly [13C,15N]-labeled Tyr/Phe is resolved by using SAIL Tyr/Phe because of the absence of resonances and the sharpening of the remaining resonances. Sensitivity improvements were also observed. Employing SAIL Tyr/Phe increased the aromatic signal intensities on average 13-fold for Phe ε, 26-fold for Phe ζ and 4-fold for Tyr over those of the uniformly 13C-labeled rings. One of the reasons for the improvement is the attenuation of dipolar interactions that was achieved by replacing the hydrogens adjacent to the detected nuclei with 2H. In the case of the uniformly 13C-labeled aromatic residues, a long (17- or 34-ms) constant-time evolution period, which causes a reduction of the magnetization, must be used in the [1H,13C]-HSQC measurement to refocus the 13C-13C couplings. The SAIL Tyr/Phe labeling patterns do not require constant time evolution in the [1H,13C]-HSQC measurement. TROSY with constant-time evolution has been developed for the sensitive detection of aromatic resonances in uniformly 13C-labeled proteins (Pervushin et al. Reference Pervushin, Riek, Wider and Wüthrich1998). By altering the evolution period to remove the constant time, this measurement technique would allow more sensitive detection of the aromatic resonances of the novel labeling patterns in larger proteins.
1H-13C correlation spectra of calmodulin (Torizawa et al. Reference Torizawa, Ono, Terauchi and Kainosho2005). (a) Constant time HSQC spectrum of [uniformly 13C,15N]-Phe and Tyr selectively labeled calmodulin. (b) HSQC spectrum of [13Cγ-13Cε-1Hε]-Tyr and Phe selectively labeled calmodulin. (c) HSQC spectrum of [13Cγ-13Cζ-1Hζ]-Phe selectively labeled calmodulin. In (a), the 13C region between 130 and 135 ppm contains the δ, ε and ζ resonances of Phe, and the δ resonances of Tyr. The corresponding regions in (b) and (c) contain only the ε or ζ resonances of Phe. Near 118 ppm in (a) and (b), the ε resonances of Tyr are detected. The small chemical shift differences between (a) and (b) or (a) and (c) are caused by isotope shifts.

Unambiguous assignments of the aromatic ring resonances of SAIL Tyr/Phe can readily be achieved by the NOE connectivity between Hδ and Hβ, or, preferably, by through-bond 13C-13C scalar coupling connectivities (Torizawa et al. Reference Torizawa, Ono, Terauchi and Kainosho2005), even for proteins containing many aromatic amino acids. Two pulse sequences for the assignment of aromatic resonances were developed, the HBCB(CG)HE experiment with the magnetization transfer pathway Hβ (t 1)→Cβ (t 2)→Cγ→Hε (t 3) and the HBCB(CGCZ)HZ experiment with Hβ (t 1)→Cβ (t 2)→Cγ→Cζ→Hζ (t 3). The 3D HBCB(CG)HE experiment can also performed in a 2D version, (HB)CB(CG)HE. These pulse sequences are composed of previously employed building blocks (Edison et al. Reference Edison, Abildgaard, Westler, Mooberry and Markley1994). The most similar previously reported pulse sequences are either (Hβ)Cβ(CγCδ)Hδ or (Hβ)Cβ(CγCδCε)Hε (Yamazaki et al. Reference Yamazaki, Forman-Kay and Kay1993). A major difference between the previously published sequences and the sequences for SAIL proteins is the incorporation of Hβ evolution. This was made possible because the stereoselective deuteration in the β methylene group alleviated the overlap of the Hβ resonances and prolonged the Hβ relaxation time. In addition, the slower relaxation of 13Cβ, due to the deuteration, also enhanced the measurement sensitivity. 2H decoupling must be applied during the 13C evolution time to avoid splitting by the 13C-2H coupling. In the case of HBCB(CG)HE, the magnetization is transferred from Cγ to detect Hε directly via 3J CγHε (7·9 Hz for Phe, 7·1 Hz for Tyr) after the transfer to Cγ. In the HBCB(CGCZ)HZ experiment, the magnetization is transferred from Cγ to Cζ via 3J CγCζ (9·3 Hz), before the final Cζ-Hζ one-bond INEPT transfer. The site-specific 2H and 13C labeling patterns made it possible to transfer the magnetization through long-range scalar couplings. Using these experiments, the correlations between the Hβ and the ring protons could be detected for all eight Phe and two Tyr residues in calmodulin (Torizawa et al. Reference Torizawa, Ono, Terauchi and Kainosho2005).
The 13C-1H pairs of aromatic ring moieties are considered to be amenable for strong TROSY effects, but the results reported so far were not quite satisfactory for uniformly 13C-labeled, fully protonated proteins (Pervushin et al. Reference Pervushin, Riek, Wider and Wüthrich1998). In each type of SAIL Phe/Tyr, however, all of the 13C-1H moieties are separated from each other by at least one 12C-2H group, and thus the TROSY effect works perfectly. The line widths of the TROSY peaks observed for the F1-coupled HSQC spectra are narrower than those of the anti-TROSY peaks already for the 18-kDa protein EPPIb (Takeda et al. Reference Takeda, Ono, Terauchi and Kainosho2009), and it was recently found that the TROSY components of SAIL Phe remain reasonably sharp even for protein particles as large as 80 kDa. Thus, the use of SAIL aromatic amino acids opens up new possibilities to study very large proteins.
5. Automated structure analysis of SAIL proteins
5.1 Automated NOESY assignment and structure calculation with CYANA
The superior quality of SAIL protein NMR spectra and the reduced number of 1H resonances render NOESY spectra of SAIL proteins particularly amenable to automated analysis. To this end, the NMR structure calculation program CYANA was supplemented with a specific SAIL amino acid residue library that reflects the 1H/2H labeling patterns of the SAIL amino acids and their complete stereospecific assignments. The automated NOE assignment algorithm of the program CYANA assigns automatically NOESY cross-peaks (Herrmann et al. Reference Herrmann, Güntert and Wüthrich2002) on the basis of the chemical shift assignments and lists of NOESY cross-peak positions and intensities. The overall probability for the correctness of possible NOE assignments is calculated as the product of three probabilities that reflect the agreement between the chemical shift values and the peak position, the consistency with a preliminary 3D structure (Güntert et al. Reference Güntert, Berndt and Wüthrich1993) and network anchoring (Herrmann et al. Reference Herrmann, Güntert and Wüthrich2002), i.e., the extent of embedding in the network formed by other NOEs. Restraints with multiple possible assignments are represented by ambiguous distance restraints (Nilges, Reference Nilges1995). Seven cycles of combined automated NOE assignment and structure calculation by simulated annealing in torsion angle space (Güntert et al. Reference Güntert, Braun and Wüthrich1991a, b, Reference Güntert, Mumenthaler and Wüthrich1997; Güntert & Wüthrich, Reference Güntert and Wüthrich1991) and a final structure calculation using only unambiguously assigned distance restraints are performed. Constraint combination (Herrmann et al. Reference Herrmann, Güntert and Wüthrich2002) is applied in the first two cycles to all NOE distance restraints spanning at least three residues in order to minimize distortions of the structures by erroneous distance restraints that may result from spurious entries in the peak lists and/or incorrect chemical shift assignments.
5.2 Fully automated structure analysis with SAIL-FLYA
The SAIL technology supports high-throughput protein structure determination without loss of structural quality. Until recently it was not possible to determine an NMR protein structure without manual analysis of the data and chemical shift assignments, although many computational approaches have been introduced either to support the interactive analysis by visualization and book-keeping or to provide automation for specific parts of an NMR structure determination. Automated procedures are now widely used for the assignment of NOE distance restraints and the structure calculations. Fully automated NMR structure determination (Güntert, Reference Güntert2009) is more demanding than automating individual parts of NMR structure analysis because the cumulative effect of imperfections at successive steps can easily render the overall process unsuccessful. For example, it has been demonstrated that reliable automated NOE assignment and structure calculation requires around 90% completeness of the chemical shift assignment (Herrmann et al. Reference Herrmann, Güntert and Wüthrich2002; Jee & Güntert, Reference Güntert2003), which is not straightforward to achieve by unattended automated peak picking and automated resonance assignments. Present systems designed to handle the whole process therefore generally require certain human interventions (Gronwald & Kalbitzer, Reference Gronwald and Kalbitzer2004; Huang et al. Reference Huang, Moseley, Baran, Arrowsmith, Powers, Tejero, Szyperski and Montelione2005). The interactive validation of peaks and assignments, however, still constitutes a time-consuming obstacle for efficient NMR protein structure determination.
The fully automated NMR structure analysis algorithm (FLYA) (López-Méndez & Güntert, Reference López-Méndez and Güntert2006) can solve NMR protein structures by purely computational means using only the primary structure and NMR spectra as input. As in the classical manual approach, structures are determined by a set of experimental NOE distance restraints without reference to already existing structures or empirical molecular modeling information. In addition to the 3D structure of the protein, FLYA yields backbone and side-chain chemical shift assignments and cross-peak assignments for all spectra. Uniting optimal labeling with full automation, SAIL-based fully automated protein structure analysis (SAIL-FLYA) is designed to solve protein structures rapidly and with enhanced accuracy and size range of applicability. The key objectives of the SAIL-FLYA system are:
(1) High speed: A complete 3D structure of a protein within hours after the completion of the NMR experiments.
(2) Large proteins: High-quality NMR structures of proteins with molecular masses above 25 kDa, which are largely outside the reach of conventional NMR structure determination, can be solved due to the reduced line width, smaller number of signals, and improved signal-to-noise ratio with SAIL.
(3) High structure quality: The higher signal-to-noise ratio of SAIL spectra, the smaller numbers of 1H shifts and the absence of ambiguities for diastereotopic pairs enable structures of higher quality than by conventional, manual or semi-automated methods applied to uniformly labeled proteins.
(4) Objectivity: NMR structures are determined by a purely computational procedure without subjective, manual interventions and will thus be fully reproducible.
(5) Usable by non-NMR researchers: Due to its fully automated nature the method can be applied by people without highly specialized training in NMR spectroscopy.
The FLYA algorithm (Fig. 15) uses as input data only the protein sequence and multidimensional NMR spectra. Any combination of commonly used heteronuclear and homonuclear 2D, 3D, and 4D NMR spectra can be used as input for the FLYA algorithm, provided that it affords sufficient information for the assignment of the backbone and side-chain chemical shifts and for the collection of conformational restraints. Seven, purely computational steps are applied:
(1) Peak picking
(2) Peak filtering
(3) Initial chemical shift assignment, yielding an ensemble of chemical shift values for every spin
(4) Chemical shift consolidation, resulting in a consensus chemical shift value for every spin
(5) NOESY assignment
(6) Structure calculation
(7) Energy refinement in explicit solvent
The complete procedure runs without human intervention, driven by the NMR structure calculation program CYANA.
Flowchart of the fully automated structure determination algorithm FLYA (López-Méndez & Güntert, Reference López-Méndez and Güntert2006).

Peaks are identified in the multidimensional NMR spectra using the automated peak picking algorithm of NMRView (Johnson, Reference Johnson2004) or AUTOPSY (Koradi et al. Reference Koradi, Billeter, Engeli, Güntert and Wüthrich1998). Peak integrals for NOESY cross-peaks are determined simultaneously. Since no manual corrections are applied, the resulting raw peak lists may contain, in addition to the entries representing true signals, a significant number of artifacts (see Figs 2 and 4 of López-Méndez & Güntert, Reference López-Méndez and Güntert2006). The following steps of the fully automated structure determination algorithm can tolerate the presence of such artifacts, as long as the majority of the true peaks have been identified.
Based on the peak positions, and in the case of NOESY spectra, peak volumes, peak lists are prepared by CYANA (Güntert, Reference Güntert2003; Güntert et al. Reference Güntert, Mumenthaler and Wüthrich1997). Depending on the spectra, the preparation may include unfolding aliased signals, systematic correction of chemical shift referencing and removal of peaks near the diagonal or water lines. The peak lists resulting from this step remain invariable throughout the rest of the procedure. An ensemble of initial chemical shift assignments is obtained by multiple runs of a modified version of the GARANT algorithm (Bartels et al. Reference Bartels, Billeter, Güntert and Wüthrich1996; Bartels et al. Reference Bartels, Güntert, Billeter and Wüthrich1997) with different seed values for the random number generator (Malmodin et al. Reference Malmodin, Papavoine and Billeter2003). The original GARANT algorithm was modified for new spectrum types and for the treatment of NOESY spectra when 3D structures are available. In analogy to NMR structure calculation in which not a single structure but an ensemble of conformers is calculated using identical input data but different randomized start conformers, the initial chemical shift assignment produces an ensemble rather than a single chemical shift value for each 1H, 13C and 15N nucleus. The peak position tolerance is typically set to 0·03 ppm for the 1H dimensions and to 0·4 ppm for the 13C and 15N dimensions. These initial chemical shift assignments are consolidated by CYANA into a single consensus chemical shift list. The most highly populated chemical shift value in the ensemble is computed for each 1H, 13C and 15N spin and selected as the consensus chemical shift value that will be used for the subsequent automated assignment of NOESY peaks. The consensus chemical shift for a given nucleus is the value ω that maximizes the function  , where the sum runs over all chemical shift values ωj for the given nucleus in the ensemble of initial chemical shift assignments and Δω denotes the aforementioned chemical shift tolerance. NOESY cross-peaks are assigned automatically on the basis of the consensus chemical shift assignments and the same peak lists and chemical shift tolerance values used already for the chemical shift assignment, as described above.
A complete FLYA calculation comprises three stages. In the first stage, the chemical shifts and protein structures are generated de novo (stage I). In the next stages (stages II and III), the structures generated by the preceding stage are used as additional input for the determination of chemical shift assignments. Stages II and III are particularly important for aromatic residues and other resonances whose assignment rely on through-space NOESY information. At the end of the third stage, the 20 final CYANA conformers with the lowest target function values are subjected to restrained energy minimization in explicit solvent against the AMBER force field (Cornell et al. Reference Cornell, Cieplak, Bayly, Gould, Merz, Ferguson, Spellmeyer, Fox, Caldwell and Kollman1995) using the program OPALp (Koradi et al. Reference Koradi, Billeter and Güntert2000; Luginbühl et al. Reference Luginbühl, Güntert, Billeter and Wüthrich1996). The complete procedure is driven by the NMR structure calculation program CYANA, which is also used for parallelization of all time-consuming steps. The performance of the FLYA algorithm can be monitored at different steps of the procedure by quality measures that can be computed without referring to external reference assignments or structures (López-Méndez & Güntert, Reference López-Méndez and Güntert2006).
Automated signal identification can be achieved with higher reliability for the fewer, sharper and more intense peaks of SAIL proteins. The danger of making erroneous assignments decreases with the number of nuclei and peaks to assign, and less spin diffusion allows NOEs to be interpreted more quantitatively. As a result of the superior quality of the SAIL NMR spectra, reliable fully automated analysis of the NMR spectra and structure calculation are possible using fewer input spectra than with conventional uniformly 13C/15N-labeled proteins. The purely computational SAIL-FLYA method is thus suitable to substitute all manual spectra analysis and overcomes a major efficiency limitation of the NMR method for protein structure determination.
6. SAIL applications
6.1 Ubiquitin
With SAIL-FLYA, fully automated analyses of the NMR spectra and structure calculations of the 7-kDa protein ubiquitin were possible from far fewer input spectra than with conventional uniformly 13C/15N-labeled proteins (Ikeya et al. Reference Ikeya, Takeda, Yoshida, Terauchi, Jee, Kainosho and Güntert2009). FLYA calculations with SAIL ubiquitin, using a single 3D ‘through-bond’ spectrum (and 2D HSQC spectra) in addition to the 13C- and 15N-edited NOESY spectra for conformational restraints, yielded structures with an accuracy of 0·83–1·15 Å for the backbone RMSD to the conventionally determined solution structure of SAIL ubiquitin.
6.2 Calmodulin
Structures of the calcium-bound form of the 17-kDa protein calmodulin were determined previously by crystallography (Chattopadhyaya et al. Reference Chattopadhyaya, Meador, Means and Quiocho1992) and NMR. The NMR structure (Chou et al. Reference Chou, Li, Klee and Bax2001) was based on residual dipolar couplings (RDCs), measured mainly for the polypeptide backbone, and on the crystal structure. The SAIL-calmodulin NMR structure, the first one for calcium-bound calmodulin based exclusively on NOEs, provided detailed information on the side-chain conformations. It is in close agreement with the crystal structure and the RDC-based backbone structure (Fig. 16).
SAIL-calmodulin solution structure (Kainosho et al. Reference Kainosho, Torizawa, Iwashita, Terauchi, Ono and Güntert2006) (backbone in cyan, Ca2+ in white), calmodulin X-ray structure (Chattopadhyaya et al. Reference Chattopadhyaya, Meador, Means and Quiocho1992) (red), and three solution conformers of uniformly labeled calmodulin determined from residual dipolar coupling data (Chou et al. Reference Chou, Li, Klee and Bax2001) (blue). Superpositions of the calmodulin solution conformers onto the X-ray structures were performed separately for the two flexibly connected domains.

6.3 E. coli peptidyl-prolyl cis-trans isomerase b
E. coli peptidyl-prolyl cis-trans isomerase b (EPPIb) is an 18·2-kDa protein, for which the backbone assignment was achieved using a uniformly 13C- and 15N-double-labeled sample prepared by the cell-free method (Kariya et al. Reference Kariya, Ohki, Hayano and Kainosho2000). The structure in solution was determined by the SAIL method, and the NOEs related to the 12 Phe and 1 Tyr aromatic rings were carefully analyzed using various types of SAIL Phe/Tyr residues shown in Fig. 13 (Takeda et al. Reference Takeda, Ono, Terauchi and Kainosho2009). Since the δ, ε, and ζ proton signals of Phe/Tyr residues give rise to complementary NOE restraints, the concomitant use of various types of SAIL-Phe and SAIL-Tyr can result in more accurate protein structures than those obtained with conventional uniformly 13C, 15N-labeled proteins.
The use of various SAIL Phe and Tyr residues simplified the aromatic ring signals of EPPIb. The aromatic ring signals of its 12 Phe residues were well resolved for all SAIL Phe types and could be assigned readily by correlating them to the previously assigned backbone signals (Kariya et al. Reference Kariya, Ohki, Hayano and Kainosho2000). For the δ- and ε-SAIL Phe-labeled EPPIb proteins, the signals of Phe 27, Phe 110 and Phe 123 were broadened beyond detection due to intermediate ring flipping rates of these residues at 30°C, except for a single, very weak peak assigned to the δ-13C/1H signal of Phe 110. At 40°C, this weak δ-13C/1H cross-peak became sharper due to the increased ring flipping rate of Phe 110. On the contrary, all 12 peaks were clearly observed for the ζ signals in ζ-SAIL Phe-labeled EPPIb. The ζ signals are not affected by ring flipping because the direction of the ζ 13C-1H bond coincides with the Cβ-Cγ axis.
NOE data were collected for three SAIL EPPIb samples that were labeled with three different combinations of SAIL Phe/Tyr, namely, δ-SAIL Phe/Tyr, ε-SAIL Phe/Tyr and ζ-SAIL Phe/ε-SAIL Tyr, while standard SAIL amino acids were used for the other residues (Takeda et al. Reference Takeda, Ono, Terauchi and Kainosho2009). The number of observed NOESY cross-peaks differed significantly between the three SAIL Phe/Tyr combinations. More than 100 NOESY cross-peaks involving the aromatic rings of Phe and Tyr were observed for the δ-SAIL Phe/Tyr combination, whereas the corresponding number of NOEs for the ζ-SAIL Phe/ε-SAIL Tyr combination was about 50. However, about half of the NOEs acquired for the δ-SAIL Phe/Tyr combination were intra-residual or sequential and thus contain limited information for the structure calculation. On the contrary, similar numbers of NOEs between sequentially distant residues were observed for all three combinations. EPPIb structures calculated with CYANA converged well for all three different combinations of SAIL Phe/Tyr. The precision of the structure was slightly lower for the δ-SAIL Phe/Tyr combination as compared with other structures, especially for two loop regions on the protein surface. This local structural difference is due to a complete lack of NOE restraints between the rings of Phe 55 and His 147, which were clearly observed for ε- and ζ-SAIL Phe, but not for δ-SAIL Phe. The lack of NOEs for the δ and ε protons of Phe 27, Phe 110 and Phe 123, which is due to intermediate ring flipping rates, is clearly reflected in the ill-defined ring positions of these three Phe residues, although their backbone conformation was defined by other NOEs. The structure that was determined by the simultaneous use of all NOEs observed with the aforementioned three combinations of SAIL Phe/Tyr yielded a well-defined structure (Fig. 17) with an RMSD to the crystal structure of EPPIb (Edwards et al. Reference Takeda, Ono, Terauchi and Kainosho1997) of 1·43 Å for the backbone atoms excluding unstructured loop regions. Since the structural quality obtained by the ζ-SAIL Phe/ε-SAIL Tyr combination is very similar to that generated by the combined NOE data using all three combinations, the ζ-SAIL Phe/ε-SAIL Tyr combination may be a good choice for structure determinations.
Structure of E. coli peptidyl-prolyl cis-trans isomerase b (EPPIb) determined by the combined use of all NOEs from SAIL EPPIb labeled with δ-SAIL Phe/Tyr, ε-SAIL Phe/Tyr, and ζ-SAIL Phe and ε-SAIL Tyr. Standard SAIL amino acids were used for the other residues. Phenylalanine and tyrosine residues are colored red and His-147 is colored blue (Takeda et al. Reference Takeda, Ono, Terauchi and Kainosho2009).

6.4 C-terminal dimerization domain of SARS coronavirus nucleocapsid protein
The C-terminal domain (CTD) of the SARS coronavirus (SARS-CoV) nucleocapsid protein (NP) contains a potential RNA-binding region in its N-terminal portion and also serves as a dimerization domain by forming a homodimer with a molecular weight of 28 kDa. When using uniformly labeled material, the structure determination of the SARS-CoV NP CTD in solution had been impeded by the poor quality of NMR spectra, especially for aromatic resonances. The SAIL protein yielded less crowded and better resolved spectra than uniform 13C and 15N labeling and enabled the homodimeric solution structure of this protein to be determined (Takeda et al. Reference Takeda, Chang, Ikeya, Güntert, Chang, Hsu, Huang and Kainosho2008a). The NMR structure is almost identical to the previously solved crystal structure, except for a disordered putative RNA-binding domain at the N-terminus.
6.5 Putative 32-kDa myrosinase-binding protein from Arabidopsis (At3g16450.1)
The product of gene At3g16450.1 from Arabidopsis thaliana is a 32-kDa, 299-residue protein classified as resembling a myrosinase-binding protein. These proteins are found in plants as part of a complex with the glucosinolate-degrading enzyme, myrosinase, and are suspected to play a role in myrosinase-dependent defense against pathogens. Many myrosinase-binding proteins and myrosinase-binding protein-related proteins are composed of repeated homologous sequences with unknown structure. The size of the protein is larger than that amenable to high-throughput analysis by uniform 13C/15N labeling methods. Nevertheless, the 3D structure of the At3g16450.1 protein from Arabidopsis, which consists of two tandem repeats, could be solved with SAIL (Takeda et al. Reference Takeda, Sugimori, Torizawa, Terauchi, Ono, Yagi, Yamaguchi, Kato, Ikeya, Jee, Güntert, Aceti, Markley and Kainosho2008b). NMR data sets collected with the SAIL protein enabled the assignment of the 1H, 13C and 15N chemical shifts to 95·5% of all atoms, even at low concentration (0·2 mm) of the protein product. Using NOESY data, the 3D structure was calculated with the CYANA software package. The structure, the first for a myrosinase-binding protein family member, revealed that the At3g16450.1 protein consists of two independent, but similar, lectin-fold domains composed of three β-sheets.
6.6 Maltodextrin-binding protein
The solution structure of the 41-kDa maltodextrin-binding protein (MBP) was determined to prove that SAIL can solve the structures of proteins that are much larger than those accessible by NMR based on uniformly labeled samples (Kainosho et al. Reference Kainosho, Torizawa, Iwashita, Terauchi, Ono and Güntert2006). All peaks benefited from improved sensitivity and resolution and allowed the signals of SAIL-calmodulin and SAIL-MBP to be assigned readily by established methods (Cavanagh et al. Reference Cavanagh, Fairbrother, Palmer, Skelton and Rance2006). Side-chain assignments were determined completely from the analysis of two data sets: HCCH-TOCSY data provided connectivities among all side-chain signals and HCCH-COSY data were used to identify the spin systems. The expected 1H, 13C and 15N chemical shifts could be assigned to the extent of 94% for SAIL-MBP, including more than 90% of the aliphatic and aromatic side-chain protons. Many of the shifts that could not be assigned are in the region of residues 229–241 that has been shown to interact with the bound cyclodextrin (Sharff et al. Reference Sharff, Rodseth and Quiocho1993). Because of conformational heterogeneity, most of the expected resonances of residues 229–241 could not be assigned in earlier studies either (Mueller et al. Reference Mueller, Choy, Yang, Forman-Kay, Venters and Kay2000).
Distance restraints for the structure calculation were obtained from 3D 15N- and 13C-edited NOESY spectra (Marion et al. Reference Marion, Kay, Sparks, Torchia and Bax1989) and from a 2D NOESY spectrum for the aromatic region. These spectra were simplified by a decreased number of signals as expected. Because of reduced spin-diffusion, maximum NOE intensities for SAIL proteins were typically reached at 1·5–3 times longer mixing times than with uniform labeling. A dense network of NOEs including 949 non-redundant, long-range distance restraints was established for SAIL-MBP. Of the 3818 non-redundant NOE distance restraints, 1879 involve side-chain atoms beyond Hβ. On the basis of the simplified and more quantitative NOESY spectra, detailed structures of SAIL-MBP were obtained by means of the combined automated NOE assignment and structure calculation protocol in the program CYANA (Güntert, Reference Güntert2003; Herrmann et al. Reference Herrmann, Güntert and Wüthrich2002). The SAIL-MBP solution structures show good quality in terms of the agreement with the experimental data and other validation parameters.
The solution structure of the 41-kDa SAIL-MBP coincides closely with the crystal structure (Sharff et al. Reference Sharff, Rodseth and Quiocho1993) that was determined previously under slightly different conditions (Fig. 18). The 41-kDa SAIL-MBP solution structure is of similar precision and accuracy as those of smaller proteins, and the structural statistics are comparable to those commonly found in NMR structure determinations of smaller proteins. Previously (Mueller et al. Reference Mueller, Choy, Yang, Forman-Kay, Venters and Kay2000), a global fold of MBP was determined by NMR on the basis of NOEs between amide and methyl protons, residual dipolar couplings for the polypeptide backbone and hydrogen bond restraints. That NMR study could determine well the global fold of the polypeptide backbone and the conformations of the methyl-containing side-chains of valine, leucine and isoleucine, but the approach used could not provide direct structural information on the other side-chains.
Solution structure (Kainosho et al. Reference Kainosho, Torizawa, Iwashita, Terauchi, Ono and Güntert2006) and crystal structure (Sharff et al. Reference Sharff, Rodseth and Quiocho1993) of the maltose-binding protein (MBP). (a) Backbone of the N-terminal domain (SAIL-MBP in green, X-ray in red) and the C-terminal domain (SAIL-MBP in blue, X-ray in red). (b) Aromatic side-chains (SAIL-MBP in green and blue, X-ray in red), and backbone ribbon representation of the X-ray structure (gold). Superpositions of the MBP solution conformers onto the X-ray structures were performed separately for the two flexibly connected domains.

7. Conclusions and Outlook
With SAIL, the size limitation for high-quality NMR solution structures has been cleared up to at least 40 kDa, investigations of hitherto experimentally inaccessible aspects of protein structure, dynamics and interactions have become possible, and fully automated spectra analysis and structure determination of proteins has been greatly facilitated. A three to seven times better signal-to-noise ratio, reduced spectral crowding, and the simplification of coupling patterns are unique improvements that are achieved by using SAIL instead of uniform 13C and 15N labeling. The application of SAIL has hardly any drawbacks for NMR experiments and spectra analysis and would thus be the method of choice for stable isotope labeling in biomolecular NMR. The two factors that are currently limiting its ubiquitous application are the cost for supplying SAIL amino acids and the requirement to establish the efficient cell-free production of the proteins of interest. Both issues can be overcome, the first one by economies of scale in the commercial synthesis of the SAIL amino acids and the second by the more and more widespread proficiency of NMR research groups in cell-free protein expression techniques. On the other hand, studies that require only a small number of SAIL-labeled amino acid types can conveniently be carried out using cell-based expression by auxotrophic bacterial strains.
The development of the SAIL technology shows that sophisticated stable isotope labeling patterns that are designed for optimal results rather than synthetic convenience can be realized and used in practice. The capabilities in chemical and enzymatic synthesis that have been acquired for SAIL can now be turned to more ambitious goals, including, for instance, tailor-made optimal isotope labeling patterns for membrane proteins and solid-state NMR.
Acknowledgments
Financial support for the development of the SAIL technology by the Core Research for Evolutional Science and Technology (CREST) program of the Japan Science and Technology Corporation (JST), the Targeted Protein Research Program of the Ministry of Education, Culture, Sports, Science and Technology of Japan (MEXT), Grants-in-Aid for Scientific Research of the Japan Society for the Promotion of Science (JSPS) and by the Volkswagen Foundation is gratefully acknowledged.