

Introduction
This paper investigates the impact on birth intervals of three distinct birth control strategies: stopping childbearing, spacing births and postponement of further childbearing. It uses a macro-simulation model of the family-building process to investigate how these three birth control strategies affect birth intervals in the presence of heterogeneous fecundity. It aims to establish whether one can infer the nature of the motivation for practising birth control from the way in which birth intervals are changing. In this context, the term ‘strategy’ is not used to refer to the accounts that informants might provide about their fertility intentions or the rationale underlying their family-building history. Such information is interesting and important but it is impossible to intuit what these accounts might be from aggregated data on fertility outcomes. Rather, the strategies discussed here are theoretical concepts, that is systematically and precisely defined abstractions, developed to underpin explanations of patterns of birth control that are both meaningful and fit the empirical evidence.
Demography, and in particular historical demography, has a long tradition of attempting to infer the existence of birth control from aggregate fertility data. While this article can be regarded as continuing that line of investigation, previous work of this kind has not always served the discipline well (Timæus & Moultrie, Reference Timæus and Moultrie2008). Researchers' desire to distinguish populations that were controlling their fertility from those with ‘natural fertility’ (Henry, Reference Henry1961) has led some of them to conflate the notion of birth control with that of the parity-specific limitation of family size. Even when they do not do this, demographers studying the onset and course of fertility transition typically classify contraceptive use into that aimed at stopping childbearing and that aimed at spacing births. Used in this way, stopping and spacing are ideal types: a binary classification used to group together all more particularistic accounts that women and their partners might offer of their reasons for not wishing to get pregnant.
Unfortunately, while its operationalization as parity-dependent family size limitation gives the notion of stopping a precise meaning, the concept of spacing has remained less clearly defined. It is now known that marital fertility was controlled in a number of pre-transitional populations in the sense that couples deliberately prolonged the duration of their birth intervals (e.g. Anderton & Bean, Reference Anderton and Bean1985; Van Bavel, Reference Van Bavel2004; Van Bavel & Kok, Reference Van Bavel and Kok2004; Bengtsson & Dribe, Reference Bengtsson and Dribe2006; Dribe & Scalonen, Reference Dribe and Scalone2010). For many authors, however, spacing remains either implicitly or explicitly defined as any birth control other than stopping. For example, Okun (Reference Okun1995) states that ‘spacing behavior refers to deliberate fertility control that is independent of parity’. Defining spacing as a residual category of birth control (i.e. as any birth control that is not aimed at parity-dependent family size limitation) is problematic. It has led students of fertility to group together diverse motives for birth control that may have very different implications for aggregate fertility (Timæus & Moultrie, Reference Timæus and Moultrie2008). Women can only be described as spacing without doing violence to the everyday meaning of the word if they are practising birth control for reasons concerned with the length of the interval between one birth and the next. For example, they may not wish to become pregnant while their youngest child is still being breast-fed or is unable to walk.
While spacing of this type is undoubtedly common, some populations have developed a pattern of birth intervals that are far too long to be explicable by women's wish to space their births (Moultrie & Timæus, Reference Moultrie and Timæus2003). Instead, they are postponing becoming pregnant again for reasons that are neither related to the age of their youngest child nor a reflection of their actual or desired family size (Timæus & Moultrie, Reference Timæus and Moultrie2008). Such reasons might include, for example, their economic circumstances, their health, or the state of their marriage (Ware, Reference Ware1976; Santow, Reference Santow1995; Bledsoe et al., Reference Bledsoe, Banja and Hill1998; Van Bavel, Reference Van Bavel2004). Defining postponement in this way does more than create a new residual category of motivations for birth control. Instead, distinguishing postponement of further childbearing from spacing of births draws attention to the fact that women may practise birth control for reasons unrelated to their fertility histories to date – a possibility that has been largely ignored by demographic theory.
Conceptually expanding the classification of couples' birth control strategies in this way is important if one is to interpret patterns of fertility change correctly, particularly in sub-Saharan Africa. Yet, although the concept of postponement of the next birth is commonplace in the literature on developed countries (for example, Friedlander et al., Reference Friedlander, Eisenbach and Goldscheider1980; de Cooman et al., Reference De Cooman, Ermisch and Joshi1987; Berrington, Reference Berrington2004; Breton et al., Reference Breton, Prioux and Dutreuilh2005) and has been proposed as important in the literature on the developing world (Lightbourne, Reference Lightbourne, Cleland and Hobcraft1985), it has failed to catch on in the latter context. This has distorted understanding of fertility transition in the contemporary world. For example, all Demographic and Health Surveys contain a short series of questions designed to classify respondents into those who want to get pregnant now, those who want to get pregnant later, and those who do not want to become pregnant at all. This makes it impossible to distinguish postponement from spacing and most analysts simply assume that all the second group of women are spacers (e.g. Westoff & Bankole, Reference Westoff and Bankole2000): it is hard to document what one does not try to measure (Timæus & Moultrie, Reference Timæus and Moultrie2008). Moreover, the distinction between birth spacing and the postponement of further childbearing is not just conceptually important but of practical significance. The impact that birth spacing can have on aggregate fertility is inherently limited, but there is no reason that widespread and prolonged postponement of births could not result in very low fertility.
The position adopted here is that a major theoretical distinction among motivations for fertility control should be placed between the postponement of further childbearing for reasons that are unrelated to women's history of childbearing, on the one hand, and birth control for demographic reasons, on the other hand, that is birth control that is conditional on either women's parity or the age of their youngest child. As defined here, stopping, spacing and postponement each have an unambiguous operational definition. In populations in which fertility is declining, therefore, it is potentially possible to infer which strategy of birth control is driving fertility change from the detailed pattern of change in parity progression and duration-specific fertility within birth intervals.
Unfortunately, arguing backwards from outcomes to their explanation in this way faces a major obstacle: the inherently selective nature of the family-building process arising from between-couple heterogeneity in human fecundity. In particular, even in populations in which sexually active women do not practise birth control, one would expect birth rates to decline with interval duration as more-fecund couples conceive and progress to another birth, leaving behind at longer durations women who have been selected for sub-fecundity or sterility. Equally, to the extent that they have been selected for high fecundity, higher-parity women will tend to have shorter birth intervals than lower-parity women. These selection effects interact with the decline in fecundity with age, as increasing numbers of women become unable to conceive or to carry a pregnancy to term. Moreover, they will interact in different and complex ways with increases in the use of contraception to limit family sizes, space births or postpone further childbearing pro tem. Thus, it is far from obvious exactly how each birth control strategy will affect parity progression and birth interval distributions and whether their effects can always be distinguished from each other.
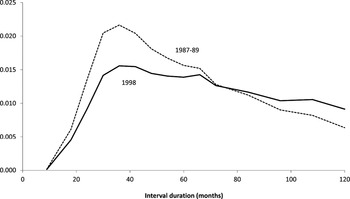
Figure 1 illustrates this conundrum with estimates of duration-specific fertility taken from an earlier analysis of the fertility transition in South Africa based on the 1987–8 and 1998 Demographic and Health Surveys (Timæus & Moultrie, Reference Timæus and Moultrie2008). Total fertility fell from about 5 children per woman in the early 1980s to about 3.5 a decade later (Moultrie & Timæus, Reference Moultrie and Timæus2003). Over the same period, the median length of birth intervals increased from about 44 months to about 54 months (Timæus & Moultrie, Reference Timæus and Moultrie2008). Figure 1 shows that these changes are underlain by large decreases in birth rates at short interval durations, but by rising fertility at long durations.
Duration-specific birth rates in South Africa, adjusted for age group and parity, according to the 1987–89 and 1998 Demographic and Health Surveys.

It is unlikely that the pattern of change in duration-specific fertility shown in Fig. 1 results from family size limitation because, if an increasing proportion of women were removing themselves from the population exposed to risk, one would expect fertility to fall at all durations. Equally, it is unlikely that this pattern of change in fertility reflects longer birth spacing related to the age of the youngest child because, while spacing might push up fertility at about 24, 36 or even 60 months, it cannot explain the increase in the risk of giving birth at intervals of more than 60 months observed in South Africa. Thus, it seems likely that fertility has fallen due to extended postponement of further childbearing for reasons unrelated either to women's family sizes or the age of their youngest children. However, decreases in fertility at short interval durations both decrease selection for low fecundity of women at long interval durations and increase selection of higher-parity women for high fecundity. Duration-specific fertility is influenced by these compositional changes in the population at risk that are set off by fertility change itself. This paper investigates the possible size of these selection effects and whether patterns of fertility change such as those in South Africa represent robust evidence as to the strategy of birth control being adopted in the country.
The paper complements articles that argue the theoretical importance of the concept of postponement (Timæus & Moultrie, Reference Timæus and Moultrie2008) and demonstrate that an emerging pattern of very long birth intervals is playing an important role in the fertility transition of a number of African countries (Moultrie & Timæus, Reference Moultrie and Timæus2003; Moultrie et al., Reference Moultrie, Sayi and Timæus2012). It describes a macro-simulation model of the family-building process and uses it to resolve the uncertainty about the effects of different birth control strategies on birth intervals. The model is not particularly innovative. In structure, it somewhat resembles the REPMOD model developed by Bongaarts (Reference Bongaarts1977) more than 30 years ago. It does not explicitly model either relationship dynamics or pregnancy loss, however, as these factors are essentially irrelevant to the issue at hand. These simplifications make it possible to adopt a partially recursive structure for the calculations. This obviates the need for large amounts of storage or multidimensional arrays, making it feasible to implement the model in a spreadsheet.
A simplified model of birth intervals
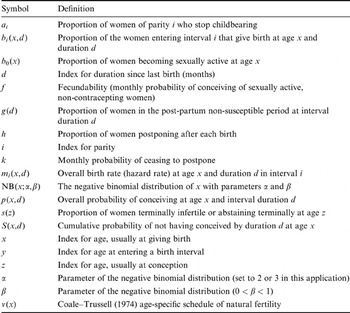
The outcome modelled is the age-, order-, interval- and duration-specific fertility of cohorts of women. For ease of reference, the notation used to describe the model is defined in Table 1 as well as in the text when it is first met. As with any macro-simulation model, this model of birth intervals is implemented by ignoring a number of potential higher-order interactions between the determinants of the age-, order- and duration-specific probabilities of giving birth. First, the model assumes that the fecundability (the monthly probability of conception among sexually active women who are not taking contraceptive measures), f, of those women who are not sterile is the same at every age (z), duration (d) and parity (i). The model assumes that the proportion of women terminally infertile or terminally abstaining for non-contraceptive reasons, s(z), depends only on age and that the proportion of women in the post-partum non-susceptible period (with amenorrhoea or abstaining after a birth), g(d), depends only on interval duration, not on the women's age or parity. The model also makes the Markovian assumption that the intervals by which women aim to space their births are serially uncorrelated across those births. This assumption is undoubtedly unrealistic and probably means that the model somewhat underestimates the variability of women's final family sizes. However, this limitation of the model is not crucial for the questions that it is designed to investigate. Finally, to avoid the need to model union formation and dissolution across the life course explicitly, it is assumed that the proportion of ever-sexually active women not in unions can be split into a constant component, whose only effect is to reduce f, and an age-related component that is allowed for in s(z).
Index to the notation used to define the model of birth intervals

On the basis of these assumptions, the probability of conceiving at age z and interval duration d is:
 $$p(z,d)=(1-g(d))(1-s(z)).f$$
.
The cumulative probability that a woman entering an interval at age y has not conceived by age x is:
 $$S(x,x-y)=e^{-\sum^x_{z=y}p(z,z-y)}$$
.
Note that x−y=d. Summation over age and duration is done in monthly steps, reflecting (approximately) the biology of human fertility. Rather than modelling miscarriages explicitly, their impact on overall fertility is allowed for in f and s(z). (This amounts to ignoring the additional variability in family sizes that they produce.) On this basis, redefining x as women's age at giving birth and assuming exactly 9 months' gestation, the proportion of the women entering an interval at age y who have their next birth at age x is:
 $$b(x,x-y)=p(x-0.75, x-0.75-y).S(x-0.75, x-0.75-y) {\rm for} x-y\ge 0.75 and b(x,x-y)=0 for x-y<0.75$$
.
Summing over all interval durations up to age x:
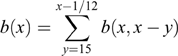 $$b(x)=\sum^{x-1/12}_{y=15}b(x,x-y)$$
and summing over all ages at previous birth:
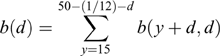 $$b(d)=\sum^{50-(1/12)-d}_{y=15}b(y+d,d)$$
.
The model can be implemented by setting up the distribution of proportions giving birth by ages x and y in months as a 420×420 square matrix and women entering interval i by age as a vector:
 $${\bd B}(x,y)=\left [\matrix {0&0&\cdots&0&\cdots &0\cr \vdots &\vdots&\vdots&\vdots&\rot45\vdots&\vdots\cr b(15.75,15)&0&\ldots&0&\ldots&0\cr b(15.83,15)&b(15.83,15.08)&\ldots&0&\ldots&0\cr \vdots&\vdots&\rot45\vdots&\vdots&\rot45\vdots&\vdots\cr b(49.92,15)&b(49.92,15.08)&\ldots&b(49.92,49.17)&\ldots&0}\right ]$$
and
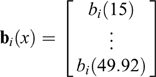 $${\bd b}_i(x)=\left [\matrix {b_i(15)\cr \vdots \cr b_i(49.92)}\right ]$$
then, for all birth orders:
 $${\bd b}_i(x)={\bd B}(x,y){\bd b}_{i-1}(x)\quad i>0$$
where b0(x) is the distribution of ages at which women first become sexually active.
Having obtained ages for the entrants to each interval, i, durations at leaving each interval can be computed by re-indexing the birth distribution matrix:
 $${\bd B}(x-y,y)=\left [\matrix {0&0&\ldots&0\cr \vdots&\vdots&\vdots&\vdots\cr b(15.75,15)&b(15.83,15.08)&\ldots &b(49.92,49.17)\cr b(15.83,15)&b(15.92,15.08)&\ldots &0\cr \vdots&\vdots&\rot45\vdots&\vdots\cr b(49.92,15)&0&\ldots&0}$$
Then:
 $${\bd b}_i(d)={\bd B}(x-y,y).\hskip1 {\bd b}_{i-1}(x) i>0$$
.
The proportion of all women experiencing an ith birth, bi, can be obtained as the sum of either bi(x) or bi(d). To model the effects of heterogeneous fecundity, the population is divided into two equally sized groups with differing but fixed levels of fecundity f + and f −. The above calculations can then be applied in their entirety to each group separately and the overall proportion of women giving birth to their ith children at duration d becomes:
 $${\bd b}_i(d)={\bd b}^+_i(d)+{\bd b}^-_i(d)$$
and similarly for bi(x). The overall birth rate (i.e. the hazard rate) at age x in interval i can be calculated by dividing these births by the women who have become exposed to risk by age x by bearing their i−1th child but who have not yet had an ith birth:
 $$m_i(x)={b_i(x)\over \sum ^x_{z={15}}b_{i-1}(z)-0.5b_{i-1}(x)-\sum^x_{z=15}b_i(z)+0.5b_i(x)}$$
except for first births where:
 $${m_1(x)={b_1(x)\over 1-\sum^x_{z=15}b_0(z)+0.5b_0(x)}}$$
.
To reproduce the duration-specific birth rates estimated from fertility survey data, allowance must be made for the fact that the denominators for the duration-specific rates are depleted not just by progression to the next parity but also by censoring: individuals who enter an interval at age y and do not progress to have another birth reach age 50 at duration 50−y and are no longer at risk of childbearing. Such women are not interviewed in most fertility surveys and are no longer tracked in this model. The proportion censored at duration d is:
 $$S(50,d)=e^{-\sum^{49.92}_{x=50-d}\,p(x,x-50+d)}$$
and the birth rate at duration d in interval i is:
 $${m_i(d)={b_i(d)\over b_{i-1}-\sum^d_{z=0.75}(b_i(z)+S(50,z))+0.5S(50,d)}}$$
.
If the model is parameterized initially to represent a population with high and natural fertility, birth spacing can be simulated by increasing the length of the post-partum period, g(d). Similarly, parity-specific stopping is simulated by assuming that parity-specific proportions, ai, of women reaching each parity do not progress so that:
 $$m_i(x,d)=(1-a _{i-1})(1-g(d-0.75))(1-s(z)).f$$
.
In the presence of stopping at parity i, the proportion of women reaching age 50 at duration d, rises to:
 $$S^\prime_i(50,d)=a_i+(1-a_i)S(50,d)$$
.
Third, according to the definition of the concept adopted here, postponers, like spacers, avoid becoming pregnant immediately after the birth of their previous child. However, in contrast to spacers, they re-enter the at-risk group for reasons that are independent of interval duration, d (and also of their parity and age). Thus, if the proportion postponing after each birth is h and the monthly probability of ceasing to postpone is k, the proportion of women of each parity who are still postponing at duration d is  $he^{-k(d+{1\over 24})}$. Therefore, the monthly probability of giving birth in a population in which stopping, spacing and postponement are all being practised by different groups of women is:
 $$m_i(x,d)=(1-a _{i-1})(1-g(d-0.75))(1-he^{-k(d+{1\over 24})})(1-s(z)).f$$
.
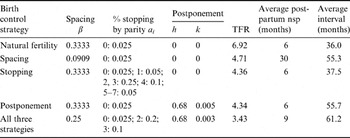
The model has been implemented by generating plausible s(z), g(d) and b 0(x) functions using the negative binomial distribution. Thus, it is assumed that women's ages at first birth and at becoming infertile and time to the return of fecundity after bearing a child are Poisson processes at the individual level but that the expectation of experiencing these events (i.e. frailty) varies between women (Brass, Reference Brass1958). The parameters of the s(z) distribution are selected to generate a fall in fecundity with age that approximates to the age pattern of natural fertility, ν(x) (Coale & Trussell, Reference Coale and Trussell1974). In particular, to ensure that all women become infecund by age 50, s(z) is modelled as 1−NB(600−12z; 3,0.024), where α=3 and β=0.024 are the parameters of the negative binomial distribution. To model g(d), α is also held constant at 3 while β takes the values shown in the second column of Table 2. To model b 0(x), α is set to 2 which, combined with the central value for β of 0.035, produces a mean age at first intercourse of 19.6 years with 90% of women becoming sexually active by their 24th birthday. The high and low fecundity groups of the population are assigned monthly probabilities of conception of f +=0.08 and f −=0.02. Then, by choosing appropriate values for the ai, and for h and k (columns 3–5 of Table 2), one can use this model to examine the impact of the three different birth control strategies on duration-specific hazards of progressing to a further birth.
Model parameters (β, ai, h and k) and fertility outcomes used to characterize populations with natural fertility and adopting four different birth control strategies
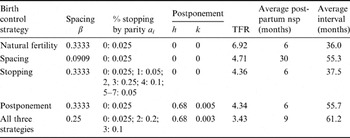
TFR=total fertility rate; nsp=non-susceptible period.
Results from the model
The inherent dynamics of the family-building process mean that the women's fecundability varies markedly with both parity and interval duration: women who remain in an interval for long durations are selected for low fecundity and only high-fecundity women reach very high parities. The relative differences in mean fecundability by duration and parity that result have a proportional impact on duration- and parity-specific fertility. Thus, variations in fertility by duration and parity do not always result from stopping, spacing or postponement, but may result from selection on fecundity.
In this section of the paper, therefore, the model just described is used to examine the impact of birth control on birth intervals in populations with heterogeneous fecundity. In other words, how does fertility by parity and interval duration evolve as stopping, spacing or postponement increase and how do these patterns compare with the pattern of underlying preferences that would be revealed if the population had homogenous fecundity? The natural fertility regime against which these three birth control strategies are evaluated was parameterized to have a total fertility rate of 6.9, a post-partum non-susceptible period of 6 months and mean and median birth intervals of 36 and 27 months respectively. Model parameters were chosen to ensure that the reductions in fertility that result from the adoption of family-size limitation and of postponement (37%, corresponding to a total fertility rate of 4.35) are approximately equal. Equally, parameters were adopted that produce birth intervals as a result of both spacing and postponement that are more-or-less the same at about 55.5 months.
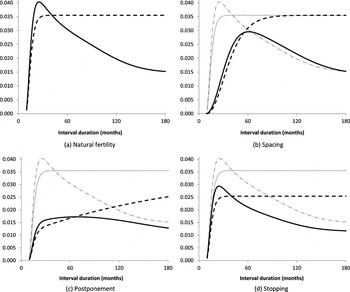
In Fig. 2, the dashed lines indicate women's underlying fertility preferences as they would manifest themselves in the birth rates of a homogenous natural fertility population with no fecundity-related selection of women out of a birth interval. The solid lines indicate women's realized fertility outcomes in the same population, allowing for the fact that fecundability varies around the mean. Figure 2a illustrates the dramatic impact that selection on fecundity has on birth interval distributions. By definition in this model, the sole reason why fertility rates fall with interval duration after controlling for age is the selection out of successive intervals of relatively fecund women when they bear another child. Figure 2b demonstrates that, as one might expect, the adoption of spacing delays the return of peak fertility. The effect of a change in preferences is mirrored clearly in the observed distribution of duration-specific fertility rates, but these again decline with interval duration as a result of selection into the next parity of more fecund women. In the absence of selection on fecundity, postponement would produce a fertility schedule that rises with duration as more and more women stop practising birth control (Fig. 2c). However, selection of the more fecund of the women who are not practising birth control out of each interval offsets this pattern, producing a fairly flat series of duration-specific fertility rates quite different from those that result from stopping and spacing. Lastly, because women's decisions to stop childbearing can be assumed to be unrelated to their ability to have more children (a characteristic that is unknown to women themselves until they do conceive), the impact of stopping is to reduce fertility proportionately at all interval durations (Fig. 2d) leaving the shape of the duration-specific fertility schedule unchanged.
Duration-specific birth rates realized in populations with heterogeneous fecundity (solid lines) in relation to underlying preferences as they would be manifested in populations with homogenous fecundability (dashed lines) for three distinct birth control strategies, as compared with natural fertility.

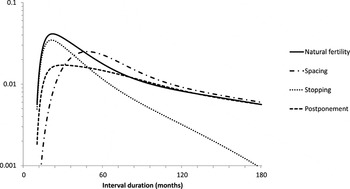
Figure 3 superimposes the fertility distributions that result from these different birth control strategies on a single plot. The changes in duration-specific fertility patterns produced by the three groups of motives for practising birth control are quite distinct. They are almost identical to patterns described by Timæus & Moultrie (Reference Timæus and Moultrie2008, Figs 1 and 2) on the basis of general reasoning and some much simpler modelling: stopping reduces the duration-specific rates proportionately, spacing shifts the fertility schedule to the right, and postponement rotates it anti-clockwise, reducing fertility at short durations and increasing it at longer ones. Although stopping and postponement to the extent shown in Fig. 3 have about the same impact on total fertility, postponement results in lower fertility at interval durations of less than about 4 years and higher fertility at longer durations. Similarly, although it has about the same impact on the length of the average interval as spacing, postponement produces higher fertility than spacing at interval durations of less than about 2.5 years and lower fertility at longer durations. Thus, even in the presence of heterogeneity in fecundity, each birth control strategy has a distinct and unambiguous impact on the schedule of duration-specific rates.
Simulated duration-specific birth rates resulting from different birth control strategies, all birth orders combined.

To further assess the sizes of these selection-related biases in estimates of the extent of birth control relative to the likely size of real variations in the propensity to bear children by parity and interval duration, a population is modelled in which spacing, stopping and postponement all occur (approximating to South Africa in the 1990s). In this simulation, sufficient spacing occurs to raise the post-partum period of non-susceptibility to 9 months, yielding a median birth interval for those not postponing of 30 months. Sufficient postponement is then introduced to raise the overall median closed birth interval to 48 months and the mean closed birth interval to 61 months. Finally, sufficient stopping is introduced after the second and third births to bring total fertility down by another 0.54 children to 3.43 (see Table 1).
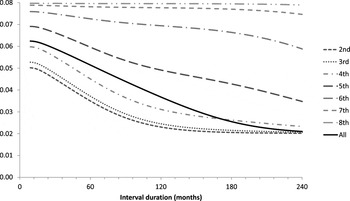
As anticipated, in this simulated population, the fecundity of exposed women varies by interval duration in a complex way that depends on parity (see Fig. 4). The results are somewhat artificial in that the model contains only two discrete groups of women, which imposes a floor of 0.02 and ceiling of 0.08 on aggregate fecundability. Nevertheless, the implications of heterogeneous fecundity are clear. Fecundability increases with parity, as the argument advanced earlier predicted. At low parities, fecundability falls steadily with increasing interval duration, as more fecund women get selected out of the interval by progressing. However, it falls more slowly with interval duration among women with large families as they comprise a more homogenous group of highly fecund women. Although a build-up of relatively fecund women occurs at parities at which women choose to stop childbearing, Fig. 4 excludes these women as they are deemed to be no longer at risk of conception. The figure shows that the fecundability of those women who remain exposed to the risk of conception declines with interval duration even at these middle-order parities. Thus, in the model, stopping at any particular parity has no effect on the fertility of higher-parity women and any effect in actual populations is likely to be small.
Mean fecundability of women according to interval duration by birth order.

The large differences in women's fecundity between parities shown in Fig. 4 can have as much impact as (or even more impact than) parity-specific stopping on the relative levels of fertility at different parities. To identify stopping, it is necessary to look at changes in overall proportions that have progressed to another birth at lengthy interval durations. Moreover, changes in spacing and postponement affect the intensity of the selection on fecundity at every parity and duration.
Figure 5 examines the effect of selection on estimates of duration-specific fertility obtained from data on a population with fertility resulting from heterogeneous fecundity, as compared with fertility calculated as:
 $$(1-he^{-k(d+{1\over 24})})(1-g(d-0.75)).\overline {f}$$
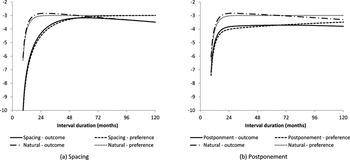
where f is average fecundity. The estimates differ from those in Figs 2 and 3 in that they hold constant the age and parity effects, s(z) and 1−a i−1. Thus, these estimates are equivalent to the duration effects that would be estimated in a regression model of the log fertility rates as a function of age, parity and interval duration. Figure 5a shows that, at least at shorter intervals, the distortions in the estimates of fertility by duration that result from selection on fecundity are small relative to the difference in duration-specific fertility between a population that is only spacing to a moderate degree (with a median birth interval of 36 months) and one spacing to a large extent (with a median interval of 55.3 months). Similarly, the selection effects are small compared with observed differences in fertility by duration between a population in which no postponement of births occurs and one in which extended postponement of the next birth is widespread and the median birth interval has risen to 55.7 months (Fig. 5b).
Observed impact on the log duration-specific birth rates of spacing and postponement compared with the underlying differences in women's preferences.

Like many analyses of the proximate determinants of fertility, the model adopted here has so far treated fecundability as invariant between populations. In reality, factors such as differences between populations in the frequency of intercourse by age may introduce some variability into fecundability. Could such variability combined with selection on fecundity distort estimates of the effects on birth intervals of different birth control strategies?
As far as age is concerned, if all women were to survive from 15 to 50, they would each contribute exposure at all ages when they were not actually pregnant. Thus, the mean fecundability of women of each age would be more-or-less equal to  $(1-s(z)).\bar f$, where f again indicates the mean fecundability of the population as a whole. However, fecundability can vary with age not only because of the ageing process but also due to selective mortality. For example, frailty may be associated with sub-fecundity and pregnancy and childbirth can result in maternal mortality but also protect against certain other causes of death (Menken et al., Reference Menken, Duffy and Kuhn2003; Hurt et al., Reference Hurt, Ronsmans and Thorne2006; Larsen, Reference Larsen and Gourbin2009). Thus, both differential selective mortality and differences in the incidence of age-related sterility cause s(z) to vary somewhat between populations. However, these differences are unlikely to be sufficiently large to materially confound the interpretation of either fertility differentials or short- to medium-term fertility trends in a particular population.
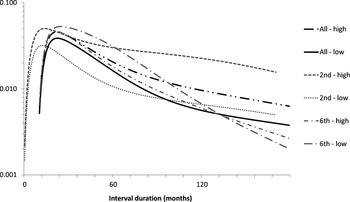
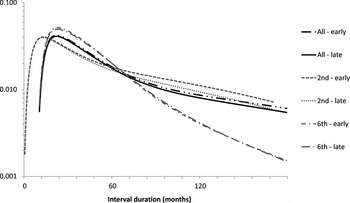
Considering all birth orders, Fig. 6 demonstrates that the effects on duration-specific fertility of large differences in fecundability between populations or changes in it over time could be mistaken for the effects of differences in stopping. Looked at by order though, stopping only reduces the fertility rates at those parities at which it is prevalent (usually 3rd to 6th births) and has no effect on the duration-specific rates for orders where it does not occur. In contrast, differences in fecundity affect all parities but have least, or even a reverse, impact on the high- but not highest-order births, whereby the lower fecundity population actually has higher fertility at short and medium durations because the lower fecundity half of the population is more intensively selected out before progressing this far. This merely emphasizes the uncontroversial fact that the best diagnostic of family size limitation is a fall in progression at the middle-order parities (Brass & Juarez, Reference Brass and Juarez1983).
Duration-specific birth rates in two natural fertility populations with a mean monthly probability of conception among fertile, sexually active women of 6% (high) and 4% (low), respectively, 2nd, 6th and all births.

A final change in family-building patterns that might affect the intensity of the selection into high parities of more fecund women and be mistaken for stopping, spacing or postponement is an alteration in women's ages at first intercourse. As the mean age at first intercourse rises, women's reproductive histories are compressed into a shorter period. As Fig. 7 shows that, although the effect on duration-specific fertility of a rise in the mean age at first intercourse is apparent for the early birth orders, its overall impact on duration-specific fertility across all birth intervals is small. Thus, little risk exists of wrongly inferring that a population is increasingly adopting any of the three strategies of birth control when all that has happened in reality is that ages at first intercourse have either risen or fallen.
Duration-specific birth rates in two natural fertility populations with a mean age at first intercourse among women of 18.2 years (early) and 20.4 years (late), respectively, 2nd, 6th and all births.

Analysis of the effects of birth control on duration-specific fertility
The modelling exercise in the previous section demonstrates that stopping, spacing and postponement each affect fertility differently. To determine from birth histories collected in surveys or other empirical data whether differences in the prevalence of each birth control strategy have had a statistically significant impact on fertility trends or differentials in a population, one needs to be able to distinguish between them in a regression analysis of the fertility rates by interval duration.
Stopping, spacing and postponing as defined here have independent effects on the birth hazards. Taking the logs of both sides of Eqn (1):
 $$ln(m_i(x,d))=ln(1-a _{i-1})+ln(1-he^{-k(d+{1\over 24})})+ln(1-g(d-0.75))+ln(1-s(z))+ln(f) \cr \approx ln(1-a _{i-1})-he^{-k(d+{1\over 24})}+ln(1-g(d-0.75))+ln(1-s(z))+ln(f)$$
.
If all social determinants are defined as affecting fertility through differential patterns of spacing, stopping or postponement and all biological heterogeneity is assumed to be a function of age or to affect fertility through f, then the only unmeasured regressor in a regression framework is ln(f), which becomes the error term. Retaining the assumption that f is uncorrelated with i, x or d, one can obtain unbiased estimates of the intensity of childbearing by parity, age and duration by fitting a Poisson regression model to the hazards of giving birth after introducing an offset term for exposure.
The probability density function of the negative binomial distribution is:
 $${\rm NB}(x;\alpha,\beta )=\left (\matrix {\alpha+x-1\atop x}\right )\beta\hskip1^\alpha(1-\beta)^x$$
where, for example, values of the parameters of the distribution of α=3 and β=1/3 have been used here to model post-partum non-susceptibility, g(d). However, if one fixes α=2 or α=3, one can then estimate β using a log-linear regression model fitted to empirical data:
 $$ln(g(d))\approx ln(\beta).\alpha +ln(1-\beta)d+ln \left ({\alpha+d-1\atop d}\right )$$
.
The log of the combination is approximately linear in d and ln(d) and their interaction:
 $$ln\left ({\alpha-1+d\over d}\right )\approx ln\left ({(\alpha-1+d)!\over d!(\alpha-1)!}\right )=ln((\alpha-1+d)!)-ln(d!)-ln((\alpha-1)!$$
and, since  $ln(x!)\approx x(ln(x)-1)+c$
 $$ln\left ({\alpha-1+d\over d}\right )\approx (\alpha -1+d)(ln(\alpha -1+d)-1)-d(ln(d)-1)-c$$
.
This demonstrates that the effect of spacing on fertility by interval duration is also approximately linear in d, ln(d) and d.ln(d). Moreover, by the same argument, s(z) is approximately linear in age, logged age and their interaction. In contrast, the effect of postponement on duration-specific fertility is approximately linear in ekd (see Eqn (2)) and thus in duration and duration squared:
 $$e^{kd}=1+kd+{(kd)^2\over 2!}+{(kd)^2\over 3!}+\cdots \approx 1+kd+(0.5k^2)d^2$$
.
Thus, if a regression model fitted to birth history data, such as those collected in Demographic and Health Surveys, that includes all these terms in duration, d, and also parity dummies has significant coefficients on d and d 2 for some sub-groups or later dates, this represents empirical evidence of differential or increasing postponement. Inconveniently, d.ln(d) is also approximately quadratic with respect to d, which suggests that a risk exists of confusing spacing and postponement. However, for α=3 and plausible values of β, the simulation model suggests that the effect of spacing is fairly well captured by the ln(d) term alone. Thus, if the coefficient of this term is significant, it represents empirical evidence of differential or changing spacing. Similarly, significant differences in the coefficients of the parity dummies are evidence of differential stopping at that family size.
Discussion
Parity-specific family size limitation, spacing of births related to the age of the youngest child, and postponement of further childbearing are concepts that can be assigned unambiguous and intuitive definitions that lead directly to their operationalization. All birth control can be assigned to one of the three categories and each of these three birth control strategies has a different impact on birth interval distributions. A simulation model of the family-building process that allows for heterogeneity in women's fecundity reveals that, while such heterogeneity has a major impact on the shape of duration-specific fertility schedules, it does not prevent one from identifying the distinctive changes in the shape of these schedules that result from changes and differences in the extent to which birth control is being practised in a population. In essence, stopping childbearing reduces the duration-specific rates proportionately, spacing births shifts the fertility schedule to the right and postponement of further childbearing pro tem rotates it anti-clockwise, reducing fertility at short durations and increasing it at longer ones (see Fig. 3).
Assuming that the analysis is restricted to sexually active women and that whether a woman is sexually active is unrelated to her fecundity, selection does not bias the age pattern of fertility, m(x), estimated in a regression model. The age effect will differ between populations only insofar as patterns of age-related sub-fecundity and sterility and of fertility-related mortality vary between those populations. In contrast, modelling of the size of the decreases in fertility and parity progression that occur as parity rises by birth order (the decrease in ai as i increases) and the rate at which fertility declines with interval duration (the decrease in g(d) as d increases) reveals that these characteristics of the distribution of birth intervals depend almost entirely on the mean and variance of the distribution of fecundability. These processes of selection on fecundity are responsible for the apparent convergence of the fertility rates of postponers with those of spacers and natural fertility populations at high durations. These findings imply that one can make no inferences about the degree or type of fertility control occurring in a population from a single set of duration- and order-specific fertility rates.
In contrast, differences between sub-populations and changes over time in the duration-specific fertility rates can be used to infer differences and changes in stopping, spacing and postponement. Parity-dependent stopping by some women does not affect the mean fecundability of those women who do not stop. Similarly, stopping at lower parities does not alter the intensity of selection bias in the duration-specific rates for higher-order births. The simulation analysis presented here further demonstrates that the knock-on selection effects produced by changes in spacing and postponement are unimportant relative to the direct effects of those changes. Moreover, changes in the intensity of selection resulting from rises and differences in the mean age at first sex are trivial compared with the changes in duration-specific fertility that result from a change in the extent of birth control.
The simulation analysis therefore demonstrates that, while heterogeneity in fecundity has a major impact on the shape of birth interval distributions, in general, the impact of changes in the intensity of selection of fecund women out of each birth interval that results from increased birth control is trivial compared with the direct effects of birth control. Thus, one can infer what birth control strategies women are adopting from changes in fertility outcomes. If temporal changes or inter-group differences in fertility are large, the birth control strategy that predominantly accounts for them can be inferred simply from visual inspection of the two sets of duration-specific fertility rates. Thus, the simulation results validate Timæus and Moultrie's (Reference Timæus and Moultrie2008) conclusion that the pattern of fertility change in South Africa illustrated in Fig. 1 provides evidence of widespread postponement of births. In less clear-cut cases, the adoption of one or other strategy of birth control can be detected by testing statistically in a regression analysis for diagnostic differences between two such sets of rates. In particular, in an appropriately specified regression model, the coefficients on parity are unbiased measures of parity progression relative to progression in the baseline population. Moreover, if the decline of fertility with interval duration is modelled as a function of interval duration, its square and its log, significant coefficients on duration and log(duration) relative to the baseline population are indicative of differential spacing and significant coefficients on duration and duration-squared are indicative of differential postponement of further childbearing by women.
The major exception to the finding that different birth control strategies are linked to unique patterns of fertility change is that large differences in fecundability produce differences in duration-specific fertility schedules that appear similar to those that result from differential stopping if averaged across all births. However, as lower fecundability implies less intense selection of highly fecund women into the highest parities and vice versa, the effects of differential fecundability are smallest or reversed at the middle- to high-order parities. In contrast, if family-size limitation is becoming more common, it is at the lower–middle-order parities that one would expect to see the largest drops in fertility. Thus, differential stopping can be distinguished from differences in fecundability by examining at which parities fertility differs most.
Finally, to return to the theme of the opening paragraphs of this paper, it is important to emphasize that what this kind of analysis of aggregate outcomes can say about fertility intentions is limited. The statistical analysis of population-level data on outcomes and in-depth survey or qualitative research into fertility decision-making should be viewed as complementary, rather than antagonistic, approaches to understanding fertility change. As Johnson-Hanks (Reference Johnson-Hanks2007) argues, the meaning of patterns of behaviour should never be taken for granted. Moreover, intentions are often ambivalent. Both points are central to our understanding of fertility intentions. Thus, the demonstration that one can infer from patterns of fertility change whether women are limiting, spacing or postponing births must be set against the fact that one cannot infer from data on fertility outcomes why women in a society have adopted one or more of these birth control strategies. Given the facts of human biology, birth control by sexually active women is almost certain to be intentional. However, it is not always intended to limit family size or space births. Postponement is birth control that is unrelated to women's family-building histories. The values, wishes and concerns of postponers are undoubtedly diverse and specific to an institutional and cultural context. What they are not is demographic in nature.
This paper demonstrates that is possible to identify the impact of postponement of the next birth on women's birth intervals and to distinguish its impact from those of both stopping childbearing and spacing births. It complements papers that argue the theoretical importance of the concept of postponement (Timæus & Moultrie, Reference Timæus and Moultrie2008) and that demonstrate that an emerging pattern of very long birth intervals due to postponement is playing an important role in the fertility transition of a number of African countries (Moultrie & Timæus, Reference Moultrie and Timæus2003; Moultrie et al., Reference Moultrie, Sayi and Timæus2012). Demographic theory tends to presuppose that the reason women use birth control is to achieve their preferences for the number and timing of their births. With the important exception of a few recent papers on historical European populations (e.g. Van Bavel, Reference Van Bavel2004; Dribe & Scalone, Reference Dribe and Scalone2010), it is largely blind to the possibility that women who might be ready and pleased to have a baby, other things being equal, may avoid pregnancy for reasons that are unrelated to their family-building history. However, as fertility transition in the region progresses, women in sub-Saharan Africa are increasingly demonstrating that they are less preoccupied than were women in Eurasian transitional populations with how many children they have to the exclusion of other concerns. Demography needs to stop classifying postponement in Africa as spacing and to begin to try and understand it on its own terms.