

Introduction
In cell biology, seeing is believing. Techniques that probe matter at atomic and near-atomic resolution provide insight into how molecular structure shapes life. Between the atomic and the macroscopic lies the mesoscopic organization of the cell. Light, as well as electron microscopy, provided observational insight into cell function, and fluorescent proteins (FPs) revolutionized cell biology by allowing real-time tracking of tagged proteins in live cells (Day, Reference Day and Davidson2014; Rodriguez et al., Reference Rodriguez, Campbell, Lin, Lin, Miyawaki, Palmer, Shu, Zhang and Tsien2017). However, <3% of the human genome is translated into protein while most is transcribed to RNA (Pertea, Reference Pertea2012; Hangauer et al., Reference Hangauer, Vaughn and McManus2013). Innovation in cellular RNA imaging technology is needed to uncover the dynamic and spatial properties of the transcriptome. To visualize RNA within cells, a number of fluorescent RNA tags have been developed. As there are no known naturally fluorescent RNAs, these tags are all products of in vitro and in vivo selection experiments as well as molecular engineering. Here, we review the current state of fluorescent RNA technology, highlighting the structural underpinnings for the function of fluorogenic RNA aptamers, i.e. RNAs that bind and turn on the fluorescence of conditional small-molecule fluorophores.
RNA imaging in cells
A popular approach for RNA imaging in live cells employs a fusion between an FP and a high-affinity RNA-binding protein (RBP), such as the bacteriophage MS2 (Johansson et al., Reference Johansson, Dertinger, LeCuyer, Behlen, Greef and Uhlenbeck1998; Ni et al., Reference Ni, Syed, Kodandapani, Wickersham, Peabody and Ely1995) and PP7 (Chao et al., Reference Chao, Patskovsky, Almo and Singer2008) coat proteins. Co-expression of the fusion protein with an RNA of interest engineered to contain the cognate binding site of the RNA-binding component produces a fluorescent tag (Bertrand et al., Reference Bertrand, Chartrand, Schaefer, Shenoy, Singer and Long1998). This technique allows single RNA species to be imaged in live cells, but has several drawbacks, not the least of which is that the FP fusion needs considerable time to be translated and matured, requiring it to be present long before the RNA of interest can be examined. Because the FP-RBP fusion is intrinsically fluorescent, and the affinity of MS2 for its cognate RNA hairpin is finite, some fraction of the fusion protein will not be bound to the intended RNA, producing background fluorescence. To overcome this, the binding sites need to be multimerized, yielding a tag, expressed from a potentially recombinogenic locus, that can be several hundred kDa in molecular mass, possibly larger than the RNA of interest. These large fluorogenic tags have been demonstrated to adversely affect the metabolism of some tagged RNAs (Garcia and Parker, Reference Garcia and Parker2015, Reference Garcia and Parker2016). Several approaches have been taken to improve the signal-to-noise of the approach. Ever brighter FPs have been deployed to increase the signal, but this does not reduce background fluorescence. Split green fluorescent protein (GFP) variants engineered to become fluorescent only upon co-localization on the RNA of interest have been reported (Valencia-Burton et al., Reference Valencia-Burton, McCullough, Cantor and Broude2007; Wu et al., Reference Wu, Chen and Singer2014). Nuclear export or import signals have also been used to reduce the background of the unbound fusion protein, but may confound the cellular localization of the RNA of interest. More recently, catalytically inactive CRSPR-Cas9-FP fusions have been used to image RNA localization in live cells (Nelles et al., Reference Nelles, Fang, O'Connell, Xu, Markmiller, Doudna and Yeo2016). This technique suffers from many of the same drawbacks of the GFP-MS2 fusion system, although the CRSPR guide RNA provides flexibility in targeting.
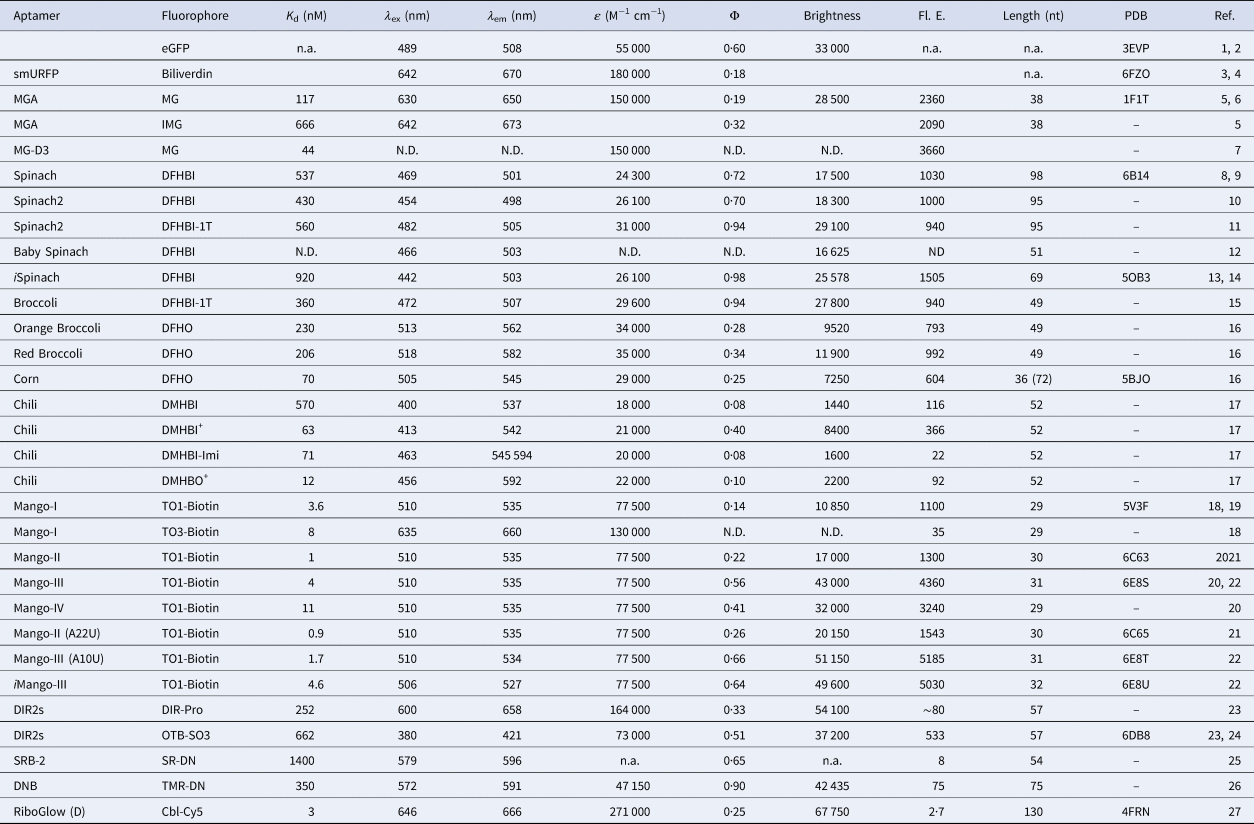
An optimal RNA tag would be small, genetically encodable, covalently attached to the RNA of interest, and exhibit bright fluorescence with tunable spectral properties. In vitro selection has been used to isolate RNA sequences that bind small molecules (Ellington and Szostak, Reference Ellington and Szostak1990; Robertson and Joyce, Reference Robertson and Joyce1990; Tuerk and Gold, Reference Tuerk and Gold1990), and fluorescent RNA tags have been produced by selecting RNA sequences that bind to, and enhance the fluorescence of conditionally fluorescent small molecules (Armitage, Reference Armitage2011; You and Jaffrey, Reference You, Jaffrey and Dill2015; Dolgosheina and Unrau, Reference Dolgosheina and Unrau2016; Ouellet, Reference Ouellet2016; Trachman et al., Reference Trachman, Truong and Ferre-D'Amare2017b; Troung and Ferré-D'Amaré, Reference Troung and Ferré-D'Amaré2019). Some of these fluorophores are cell-permeable and non-cytotoxic, and are minimally turned on by endogenous cellular components, therefore producing low background fluorescence. Expression of aptamer-tagged RNAs of interest in live cells perfused with the cognate fluorophores has allowed their visualization (e.g. Paige et al., Reference Paige, Wu and Jaffrey2011, Reference Paige, Nguyen-Duc, Song and Jaffrey2012; Strack et al., Reference Strack, Disney and Jaffrey2013; Autour et al., Reference Autour, C Y Jeng, D Cawte, Abdolahzadeh, Galli, Panchapakesan, Rueda, Ryckelynck and Unrau2018; Braselmann et al., Reference Braselmann, Wierzba, Polaski, Chromiński, Holmes, Hung, Batan, Wheeler, Parker, Jimenez, Gryko, Batey and Palmer2018). In addition to affinity-based SELEX, a number of other directed-evolution techniques, such as fluorescence-based in vitro selection and live cell sorting-based selection, have been employed to generate or optimize fluorescence turn-on RNAs. The fluorophores themselves have seen improvements that alter their aptamer binding affinity and selectivity, as well as the brightness and spectral properties of their aptamer complexes. Numerous combinations of the fluorophore–RNA complexes have been reported and are summarized in Table 1. By combining a variety of conditional fluorophores and structurally diverse RNAs, fluorescence turn-on tags are starting to rival the brightness and spectral range of the FPs (Figs 1 and 2).
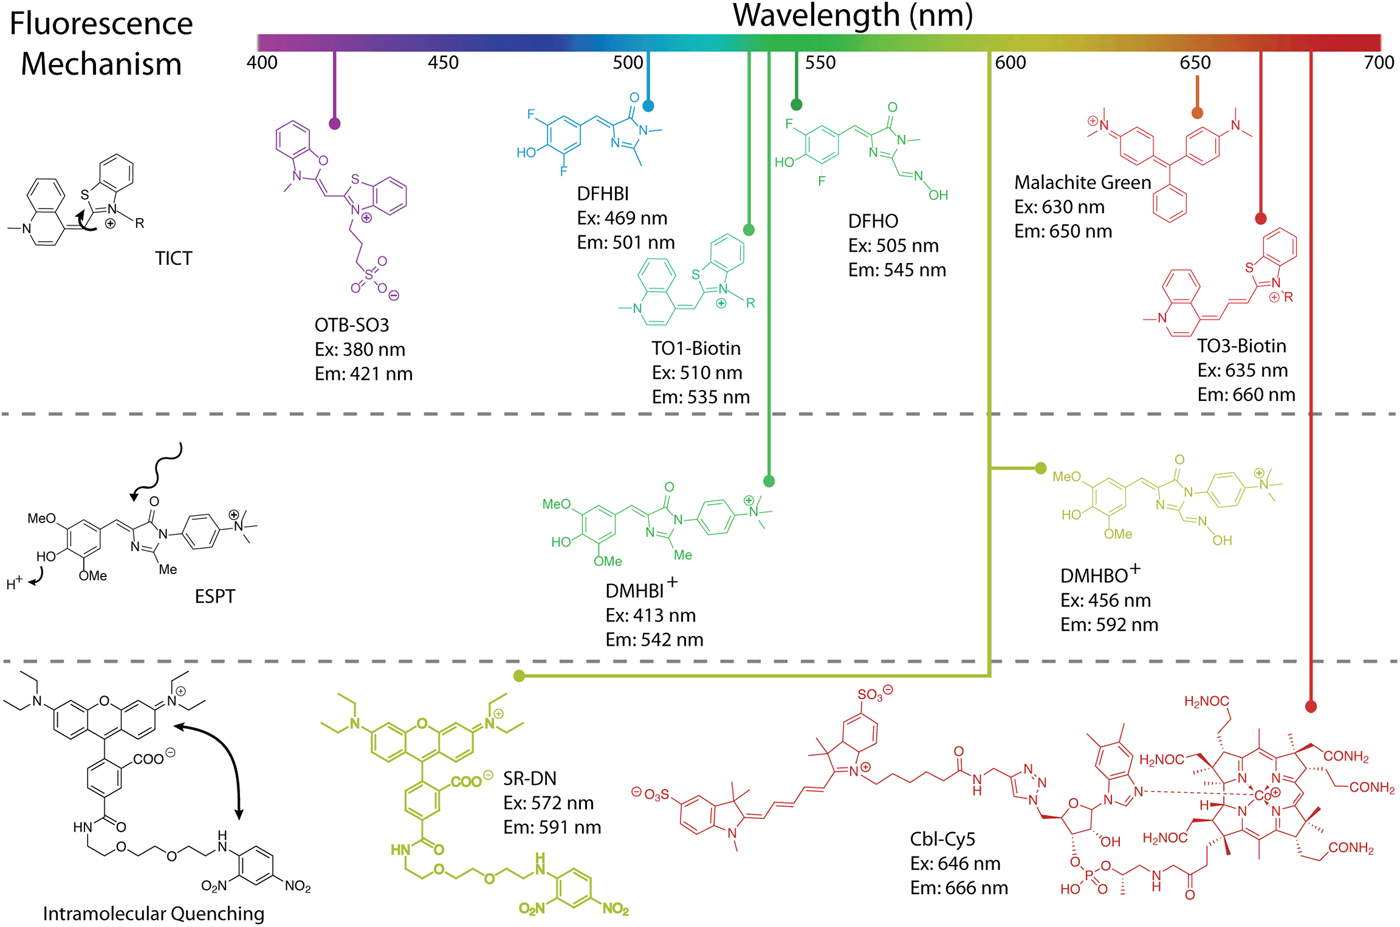
Overview of turn-on aptamer fluorophores and their mechanisms of activation. Reduction of rotation between conjugated heterocycles promoting twisted intramolecular charge transfer (TICT) is the most prevalent (top). Examples of TICT span almost the entire visible spectrum. Promoting excited state proton transfer (ESPT) has the benefit of producing large Stokes shifts (middle). The chromophores DMHBI+ and DMHBO+ are examples of ESPT, but function through a hybrid TICT/ESPT mechanism. Intramolecular quenching (IQ) in a fluorophore–quencher pair is relieved when an aptamer sequesters the quencher. Examples include SR-DN and Cbl-Cy5 (bottom), but numerous fluorophores can be used to expand the color spectrum of IQ aptamers.

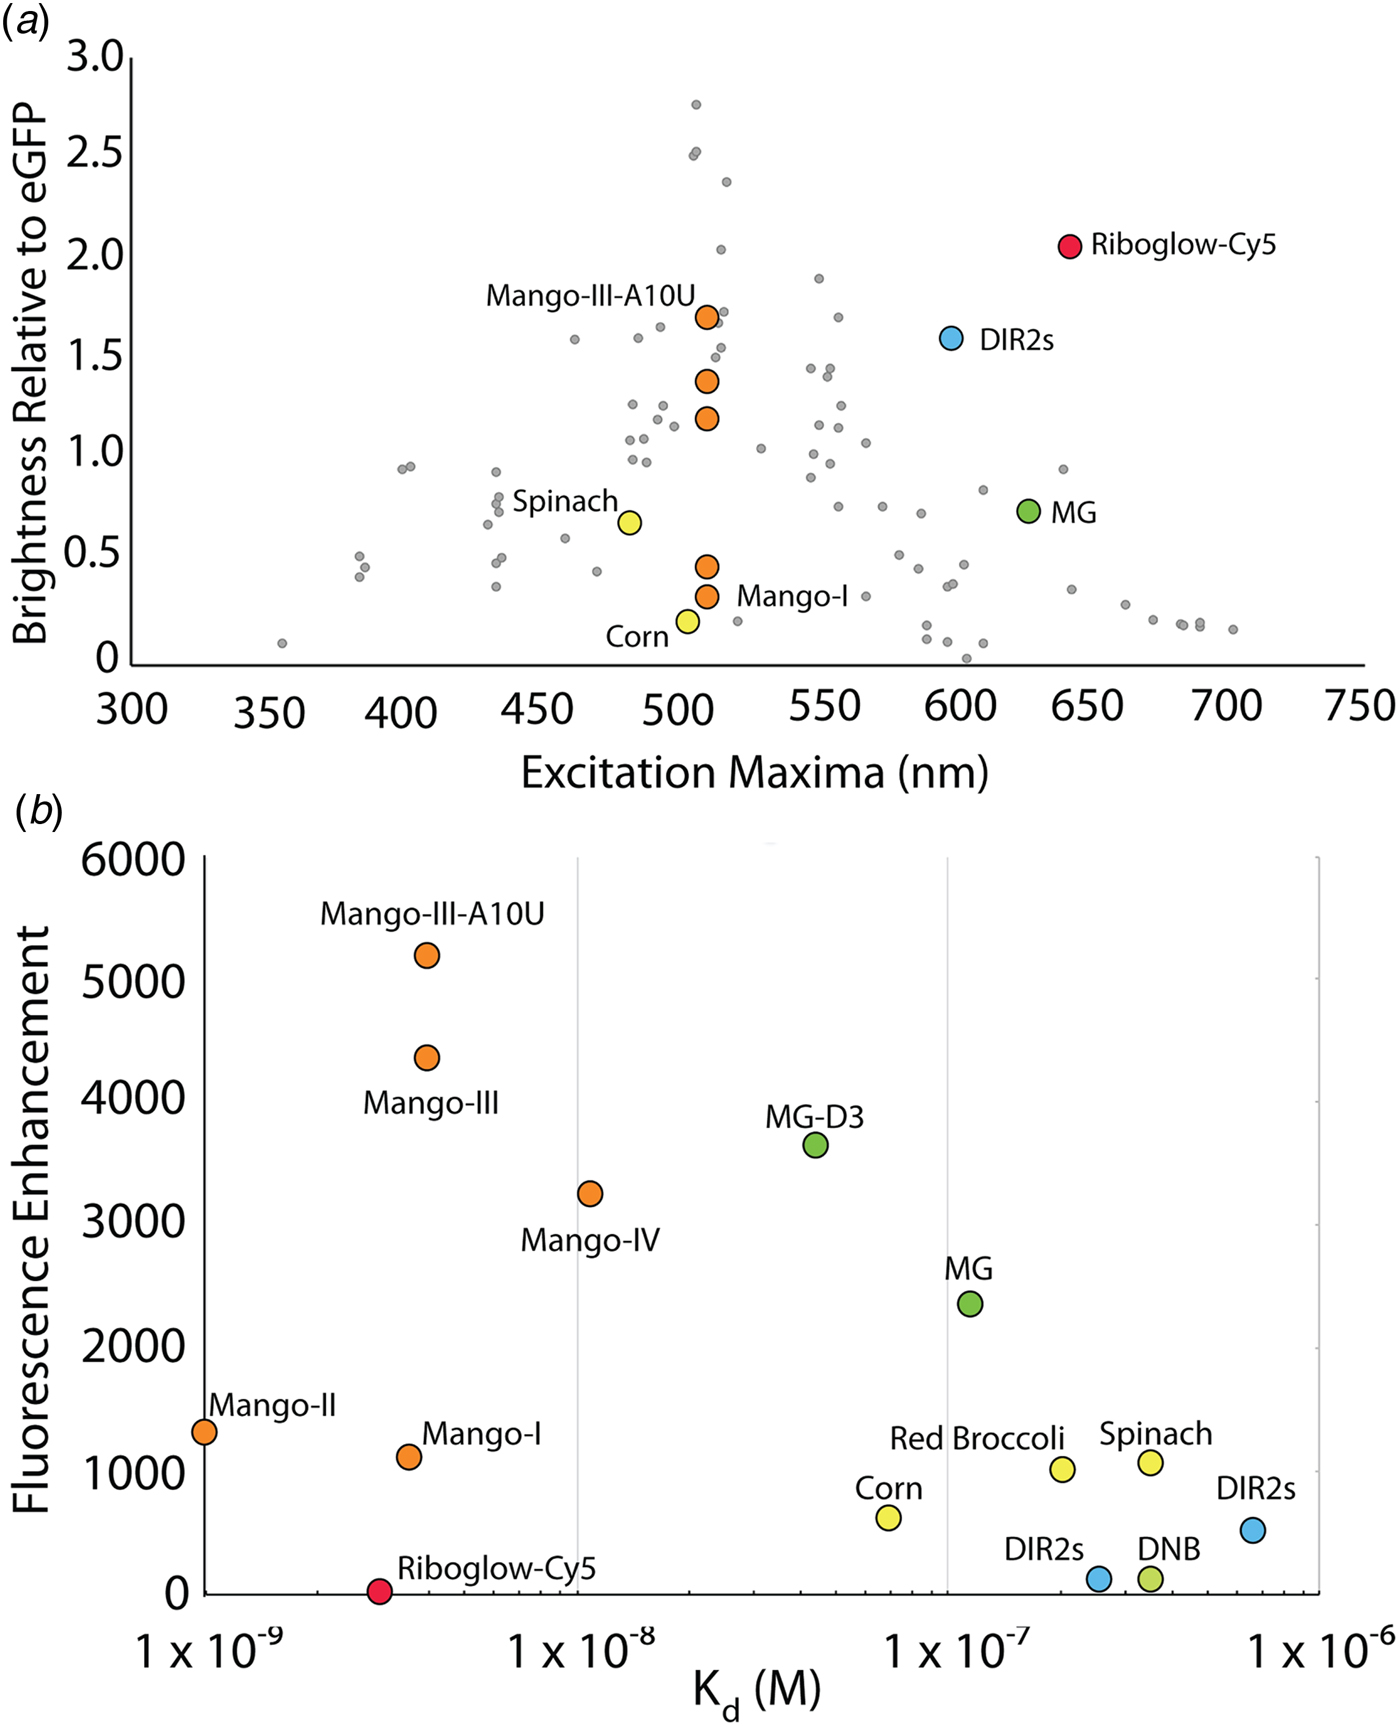
Photophysical comparison of fluorescent aptamers. (a) Excitation maxima and brightness relative to eGFP for select fluorescent aptamers. Aptamer complexes are colored according to sequence or fluorophore lineage (Fig. 1). DIR-2 (light blue), DNB (dark blue), Chili (purple), HBI derivatives (yellow), Riboglow (red), malachite green (green), Mango RNAs (orange). Gray points denote fluorescent proteins, adapted from Rodriguez et al. (Reference Rodriguez, Campbell, Lin, Lin, Miyawaki, Palmer, Shu, Zhang and Tsien2017). (b) Scatter plot of aptamer–fluorophore dissociation constants (K d) and fluorescence enhancements (FE), depicting diverse fluorescence efficiencies (K d × FE).

Fluorescence properties of select RNA–fluorophore complexes

(1) Heim et al. (Reference Heim, Prasher and Tsien1994); (2) Royant and Noirclerc-Savoye (Reference Royant and Noirclerc-Savoye2011); (3) Rodriguez et al. (Reference Rodriguez, Tran, Gross, Crisp, Shu, Lin and Tsien2016); (4) Fuenzalida-Werner et al. (Reference Fuenzalida-Werner, Janowski, Mishra, Weidenfeld, Niessing, Ntziachristos and Stiel2018); (5) Babendure et al. (Reference Babendure, Adams and Tsien2003); (6) Baugh et al. (Reference Baugh, Grate and Wilson2000); (7) Gotrik et al. (Reference Gotrik, Sekhon, Saurabh, Nakamoto, Eisenstein and Soh2018); (8) Paige et al. (Reference Paige, Wu and Jaffrey2011); (9) Koirala et al. (Reference Koirala, Shelke, Dupont, Ruiz, DasGupta, Bailey, Benner and Piccirilli2018); (10) Strack et al. (Reference Strack, Disney and Jaffrey2013); (11) Song et al. (Reference Song, Strack, Svensen and Jaffrey2014); (12) Warner et al. (Reference Warner, Chen, Song, Strack, Thorn, Jaffrey and Ferre-D'Amare2014); (13) Autour et al. (Reference Autour, Westhof and Ryckelynck2016); (14) Fernandez-Millan et al. (Reference Fernandez-Millan, Autour, Ennifar, Westhof and Ryckelynck2017); (15) Filonov et al. (Reference Filonov, Moon, Svensen and Jaffrey2014); (16) Song et al. (Reference Song, Filonov, Kim, Hirsch, Li, Moon and Jaffrey2017); (17) Steinmetzger et al. (Reference Steinmetzger, Palanisamy, Gore and Höbartner2019); (18) Dolgosheina et al. (Reference Dolgosheina, Jeng, Panchapakesan, Cojocaru, Chen, Wilson, Hawkins, Wiggins and Unrau2014); (19) Trachman et al. (Reference Trachman, Demeshkina, Lau, Panchapakesan, Jeng, Unrau and Ferré-D'Amaré2017a, Reference Trachman, Truong and Ferre-D'Amare2017b, Reference Trachman, Abdolahzadeh, Andreoni, Cojocaru, Knutson, Ryckelynck, Unrau and Ferré-D'Amaré2018, Reference Trachman, Autour, Sunny, Abdolahzadeh, Andreoni, Cojocaru, Garipov, Dolgosheina, Knutson, Ryckelynck, Unrau and Ferré-D'Amaré2019); (20) Autour et al. (Reference Autour, C Y Jeng, D Cawte, Abdolahzadeh, Galli, Panchapakesan, Rueda, Ryckelynck and Unrau2018); (21) Trachman et al. (Reference Trachman, Abdolahzadeh, Andreoni, Cojocaru, Knutson, Ryckelynck, Unrau and Ferré-D'Amaré2018); (22) Trachman et al. (Reference Trachman, Autour, Sunny, Abdolahzadeh, Andreoni, Cojocaru, Garipov, Dolgosheina, Knutson, Ryckelynck, Unrau and Ferré-D'Amaré2019); (23) Tan et al. (Reference Tan, Constantin, Sloane, Waggoner, Bruchez and Armitage2017); (24) Shelke et al. (Reference Shelke, Shao, Laski, Koirala, Weissman, Fuller, Tan, Constantin, Waggoner, Bruchez, Armitage and Piccirilli2018); (25) Sunbul and Jäschke (Reference Sunbul and Jäschke2013); (26) Arora et al. (Reference Arora, Sunbul and Jäschke2015); (27) Braselmann et al. (Reference Braselmann, Wierzba, Polaski, Chromiński, Holmes, Hung, Batan, Wheeler, Parker, Jimenez, Gryko, Batey and Palmer2018).
Mechanisms of fluorescence activation
Selection or engineering of a fluorescence turn-on aptamer starts with the choice of a conditional fluorophore (Klymchenko, Reference Klymchenko2017). Fluorophores of interest are small molecules that exhibit minimal fluorescence when free in solution, but become fluorescent upon changing the local environment (in particular, binding to a cognate RNA). There are three principal mechanisms of fluorescence turn-on that could be exploited by turn-on aptamers: twisted intramolecular charge transfer (TICT), excited state proton transfer (ESPT), and unquenching of fluorophore–quencher conjugates (Fig. 1). Fluorophores exhibiting TICT have increased vibrational modes in the solution and readily undergo non-radiative decay when the conjugated network of the excited fluorophore is disrupted by bond rotation. The majority of fluorescent aptamers rigidify TICT fluorophores to promote fluorescence enhancement (Fig. 1). A relatively recent addition to the fluorescent aptamer tool box, ESPT exploits proton exchange in the excited state by incorporating cationic groups on the fluorophore. These fluorophores mimic the FP fluorophores of LSSmOrange (Shcherbakova et al., Reference Shcherbakova, Hink, Joosen, Gadella and Verkhusha2012) and LSSmKate (Piatkevich et al., Reference Piatkevich, Hulit, Subach, Wu, Abdulla, Segall and Verkhusha2010a, Reference Piatkevich, Malashkevich, Almo and Verkhusha2010b) to produce large Stokes shifts. Fluorophore–quencher conjugates suppress the fluorescence of an otherwise constitutively fluorescent molecule through non-covalent interactions with a covalently linked quencher. Aptamers sequester the quencher moiety, allowing fluorescence.
Regardless of fluorescence turn-on mechanism, several properties of small-molecule fluorophores are important for imaging. Ideal fluorescent tags for live-cell imaging are bright and redshifted. Brightness is the product of the extinction coefficient (ε) and the quantum yield (Φ). For TICT fluorophores, Φ is a function of rigidity and conformation of the fluorophore in the photoexcited state, and can in principle be improved with stringent aptamer selection. However, ε is almost exclusively dictated by intrinsic properties of the fluorophore. Fluorophores with large ε (i.e. >50 000) and small Φ (i.e. <0·001) when free in solution are ideal. Fluorescent imaging in the cells is subject to large background signal from autofluorescence of the cytoplasm and nucleus. Background is mainly in the blue-green range of the visible spectrum (Monici, Reference Monici2005), so fluorophores that emit in the near-infrared are optimal. Fluorescence-activating proteins (FAPs) derived from bacterial phytochromes bind in trans to biliverdin and turn on fluorescence (Fig. 3). Like FAPs, fluorescence turn-on aptamers exhibit a finite affinity for their fluorophores. Sufficient binding affinity is required to image low copy RNAs and the fluorescent signal produced by free ligand must be accounted for. The fluorescence efficiency of an RNA has been defined as a function of both binding affinity (K d) and fluorescence enhancement (generally approximated to Φbound/Φunbound). Fluorescent aptamers with low K d (<10 nM) and large fluorescence enhancements (>1000) are desirable (Fig. 2). Not least, the selectivity of the fluorophore–RNA interaction is important. If the fluorophore is turned on non-specifically by cellular nucleic acids (or other endogenous molecules), high background will ensue.
Structure of two fluorescence-activating proteins bound to biliverdin. (a) Cartoon representation of the infrared fluorescent protein IFP 2·0 (PDB ID: 4CQH). The biliverdin chromophore (green sticks) is shown with the covalent linkage to cystine 24 (yellow sticks). (b) Cartoon representation of smURFP (PDB ID: 6FZN). The biliverdin chromophore (green sticks) is shown with the covalent linkage to cystine 52 (yellow sticks).

The malachite green aptamer
The malachite green (MG) aptamer was the first turn-on aptamer for which a three-dimensional structure was determined. It was originally selected for use in chromophore-assisted laser inactivation (CALI) (Jay and Keshishian, Reference Jay and Keshishian1990; Grate and Wilson, Reference Grate and Wilson1999, Reference Grate and Wilson2001). Using microinjected Fab-MG conjugates, CALI sought to employ the specificity of antibodies coupled to the hydroxyradical production by photoexcited MG to specifically knock out proteins of interest. The MG aptamer was engineered to perform the same function on RNA species using a genetically encodable aptamer.
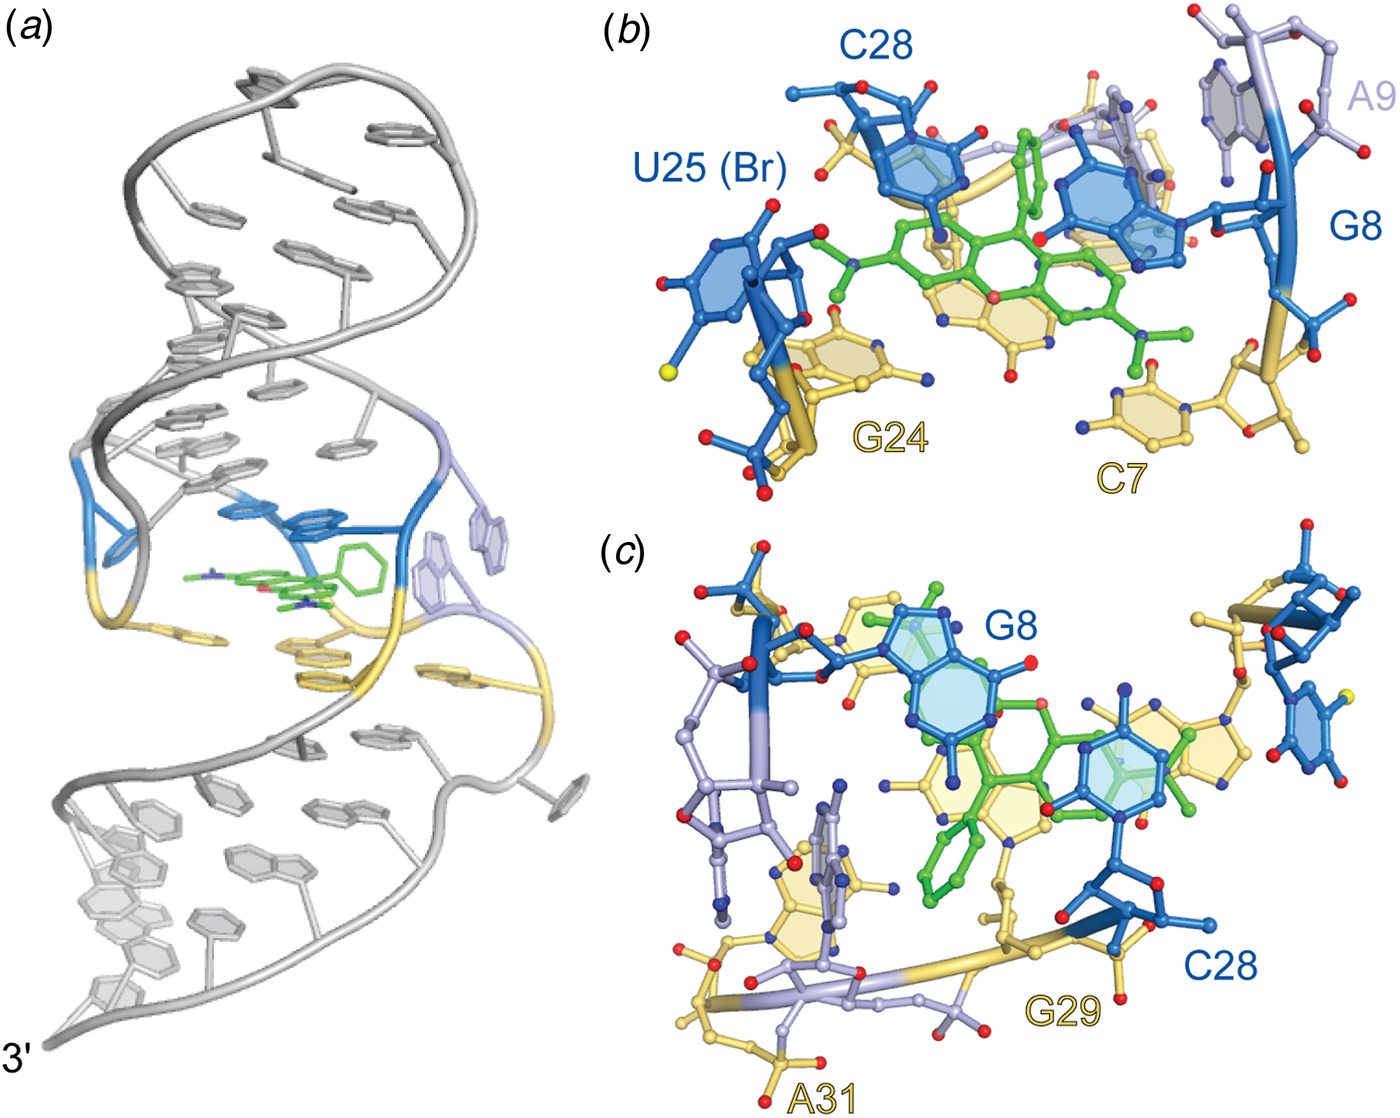
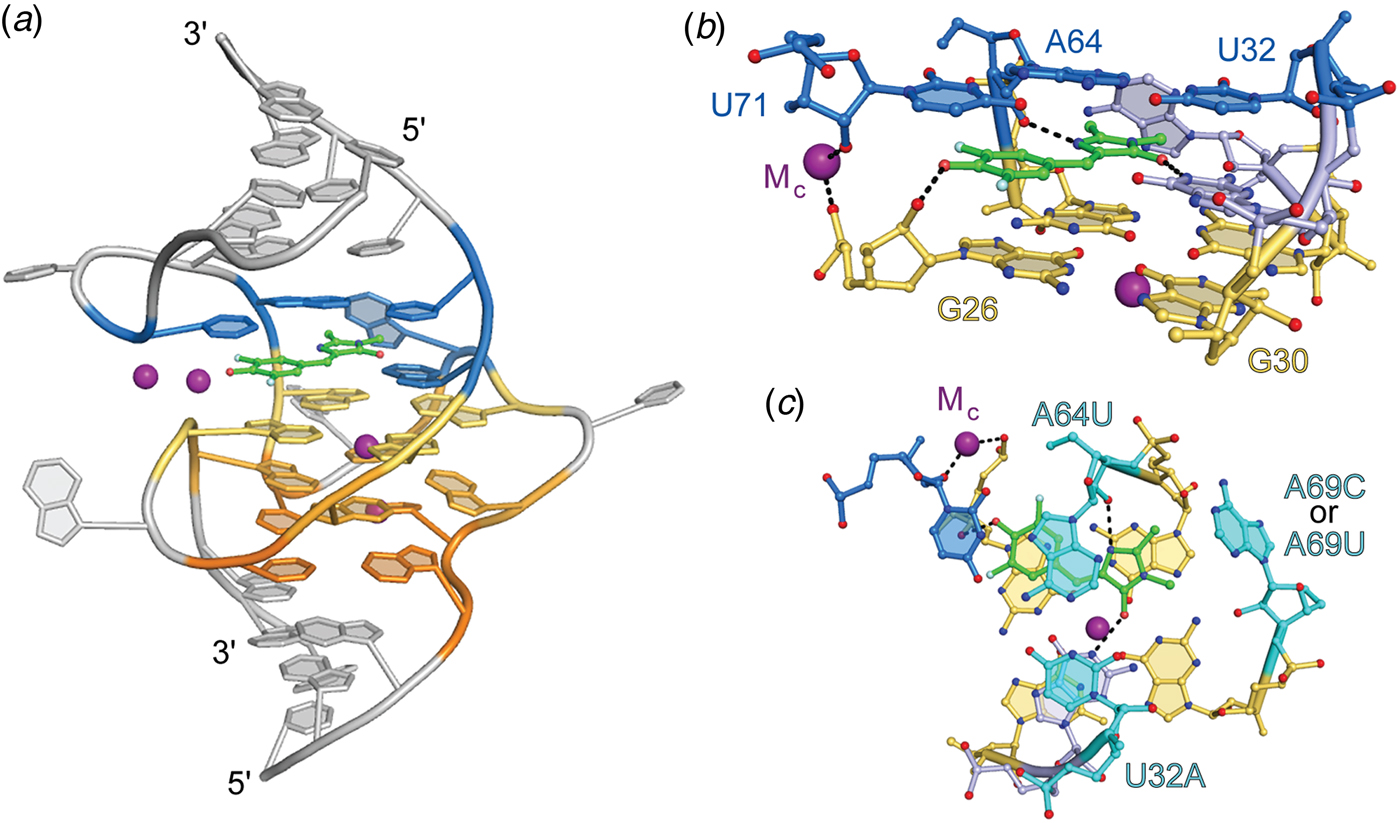
The MG aptamer was found to have a higher affinity for the planar analogue tetramethylrosamine (TMR; K d = 40 nM) despite being selected to bind MG (K d = 117 nM). The crystal structure of the MG aptamer–TMR complex demonstrated that the larger ring system of the fluorophore stacks between a base quadruple and a base pair (Baugh et al., Reference Baugh, Grate and Wilson2000), suggesting that the RNA would stabilize a planar conformation of MG (Fig. 4). Subsequent solution NMR structures of the aptamer bound to TMR and MG showed that the RNA structure can accommodate either ligand with only minor perturbations, although MG is bound in a slightly twisted conformation (Nguyen et al., Reference Nguyen, DeFina, Fink and Dieckmann2002; Flinders et al., Reference Flinders, DeFina, Brackett, Baugh, Wilson and Dieckmann2004; Brackett and Dieckmann, Reference Brackett and Dieckmann2006).
Structure of the malachite green aptamer. (a) Cartoon representation of the malachite green aptamer bound to TMR. The TMR ligand is shown as green ball-and-stick with flanking A-form helices and unstructured nucleotides (gray). Tetrad (yellow) and binding pocket nucleotides (marine and light blue) are colored. (b) Side view of the Spinach binding pocket (ball-and-stick) colored according to (a). (c) Top view of the malachite green ligand-binding pocket.

MG and other triphenylmethane dyes fluoresce weakly in the solution due to vibrational de-excitation. As with other TICT fluorophores, intramolecular rotation results in non-radiative decay in aqueous solution. Fluorescence can be enhanced by increasing the solution viscosity (Baptista and Indig, Reference Baptista and Indig1998). Based on the crystal structure of the MG aptamer–TMR complex, it was hypothesized that the aptamer may be able to enhance the fluorescence of the otherwise dark MG. Remarkably, the aptamer was shown to increase the quantum yield of MG by three orders of magnitude, producing a fluorescence enhancement of 2360 (Table 1) (Babendure et al., Reference Babendure, Adams and Tsien2003). MG and the fluorescent aptamer sulforhodamine blue (SRB) (Holeman et al., Reference Holeman, Robinson, Szostak and Wilson1998; Grate and Wilson, Reference Grate and Wilson1999, Reference Grate and Wilson2001) were the first aptamers demonstrated to turn on the fluorescence of small molecules. Their utility to image RNA in live cells, however, is limited by promiscuous binding of MG, toxicity upon illumination, and the low aptamer–MG affinity, and therefore low fluorescence efficiency (Table 1). A recent reselection sought to improve the fluorescence efficiency of the MG aptamer (Gotrik et al., Reference Gotrik, Sekhon, Saurabh, Nakamoto, Eisenstein and Soh2018). By reducing the concentration of fluorophore during selection while increasing stringency of the fluorescence sorting gate, both high affinity and bright aptamers were selected against MG. The best aptamer exhibited a K d of 44 nM and a fluorescence enhancement of 3660.
Spinach and related aptamers
In early studies seeking to characterize the intrinsic fluorophore of the Aequora victoria GFP, p-HBI was synthesized (Niwa et al., Reference Niwa, Inouye, Hirano, Matsuno, Kojima, Kubota, Ohashi and Tsuji1996). This soluble form of the GFP fluorophore was found to exhibit minimal fluorescence in solution, also consistent with the loss of fluorescence of the FP upon denaturation (Ward and Bokman, Reference Ward and Bokman1982). In vitro selection experiments in which RNAs were selected to bind to various derivatives of p-HBI produced several turn-on aptamer–fluorophore combinations (Paige et al., Reference Paige, Wu and Jaffrey2011). The brightest of these, termed Spinach, in complex with DFHBI, exhibited fluorescence ~50% as bright as that of enhanced GFP (EGFP), and was shown to be useful to visualize tagged RNAs in live cells. Further optimization of the aptamer to improve affinity and fluorescence enhancement yielded Spinach2, which in complex with a variant fluorophore, DFHBI-1T, achieves fluorescence 88% as bright as that of EGFP (Strack et al., Reference Strack, Disney and Jaffrey2013).
Crystallographic structure determination of the 98 nucleotide (nt) Spinach in complex with DFHBI revealed the fluorophore to be constrained in a planar conformation (consistent with its high Φ of 0.74) by sandwiching between a G-quartet and a base triple, while also making lateral interactions with a ribose 2′-OH, an unpaired guanine base, and well-ordered solvent (Huang et al., Reference Huang, Suslov, Li, Shelke, Evans, Koldobskaya, Rice and Piccirilli2014; Warner et al., Reference Warner, Chen, Song, Strack, Thorn, Jaffrey and Ferre-D'Amare2014). Overall, the aptamer folds as a single coaxial stack of two antiparallel A-form duplexes flanking a core G-quadruplex of mixed parallel and antiparallel connectivity (Fig. 5). The RNA chain needs to traverse the continuous coaxial stack and change polarity as well as strand number while maintaining base stacking; the resulting connectivity of the Spinach fold is of unprecedented complexity for a G-quadruplex nucleic acid. Mutational as well as solution NMR analyses confirmed the importance of the G-quadruplex structure for fluorescence turn-on. Small-angle X-ray scattering analyses and a fluorophore-free crystal structure indicate that Spinach is pre-folded, and an unpaired nucleotide occupies the DFHBI binding pocket in the unliganded state. The outlying A-form duplex elements of Spinach could be truncated to produce the 51-nt Baby Spinach, which retained the G-quadruplex-base triple core and exhibited the full brightness of the parent aptamer.
Structure of Spinach aptamer. (a) Cartoon representation of the Spinach aptamer core (PBD ID: 4TSO). The DFHBI fluorescent ligand is shown as green ball-and-stick with flanking A-form helices and unstructured nucleotides (gray), G-quadruplex nucleotides (warm colors), triplex and flanking binding pocket nucleotides (blue), shown in cartoon representation. Bound K+ ions represented as purple spheres. (b) Side view of the Spinach binding pocket (ball-and-stick) colored according to (a). Hydrogen bonds and metal coordination are represented as black dashed lines. (c) Top view of the Spinach ligand-binding pocket. Residues demonstrated to alter spectral properties in HBI-derivative binding aptamers are colored cyan and labeled with mutation details.

A variety of approaches have been employed to tune and improve the properties of Spinach. Mutational redesign of the base triple stacking on DFHBI resulted in hypsochromic shifts in the excitation and emission maxima of 45 and 11 nm, respectively (Fig. 5) (Warner et al., Reference Warner, Chen, Song, Strack, Thorn, Jaffrey and Ferre-D'Amare2014). Directed evolution by fluorescence-activated cell sorting produced the 49-nt aptamer Broccoli with improved brightness (Filonov et al., Reference Filonov, Moon, Svensen and Jaffrey2014). Further selection to bind and activate the extended-conjugation fluorophore DFHO yielded the red shifted aptamers Orange Broccoli and Red Broccoli, which differ from each other in the identity of a single nucleotide, while preserving the overall Spinach sequence. A microfluidic, droplet-based screening method was employed to reduce the folding dependence of the aptamer on K+ and select for brighter DFHBI binding aptamers. This selection produced iSpinach, a 69-nt aptamer that binds and enhances the fluorescence of DFHBI to levels almost 50% brighter than Spinach2 (Autour et al., Reference Autour, Westhof and Ryckelynck2016). This selection was carried out in high concentrations of NaCl resulting in an aptamer with vastly improved activity in Na+. The crystal structure of iSpinach revealed overall and binding pocket structures almost identical to those of Spinach; both RNA and water interactions with DFHBI are conserved between the two aptamers (Fernandez-Millan et al., Reference Fernandez-Millan, Autour, Ennifar, Westhof and Ryckelynck2017)
Quasisymmetry in the Corn aptamer
While Spinach and its derivatives demonstrated that a turn-on aptamer could achieve brightness comparable to that of many FPs, and could be used as a fluorescent tag for imaging RNAs in vivo, these aptamers have properties that limit their imaging applications. In addition to poor folding efficiency both in vitro and in vivo (possibly a result of their relatively large size and complex fold) and modest fluorophore binding affinity (K d ~ 0·5 µM), fluorophore complexes of Spinach and related aptamers (including the various Broccoli RNAs and iSpinach) were found to lose fluorescence rapidly upon illumination (Paige et al., Reference Paige, Wu and Jaffrey2011; Han et al., Reference Han, Leslie, Fei, Zhang and Ha2013; Wang et al., Reference Wang, Querard, Maurin, Nath, Le Saux, Gautier and Jullien2013). Interestingly, Spinach was found to regain fluorescence in the dark in the presence of excess DFHBI, suggesting that the photodamaged or photoisomerized fluorophore is bound only loosely and can readily exchange with a fresh fluorophore. Together with the crystal structures, which showed only two direct hydrogen bonds between the RNA and DFHBI, this suggested that a fluorophore with additional polar groups and an RNA pocket that bound these may improve photostability. To test this hypothesis, DFHO, a variant fluorophore that extends the conjugation of DFHBI through the addition of an oxime moiety was synthesized. It was reasoned that this additional moiety would not only allow for more RNA–fluorophore interactions, but also red-shift the fluorescence.
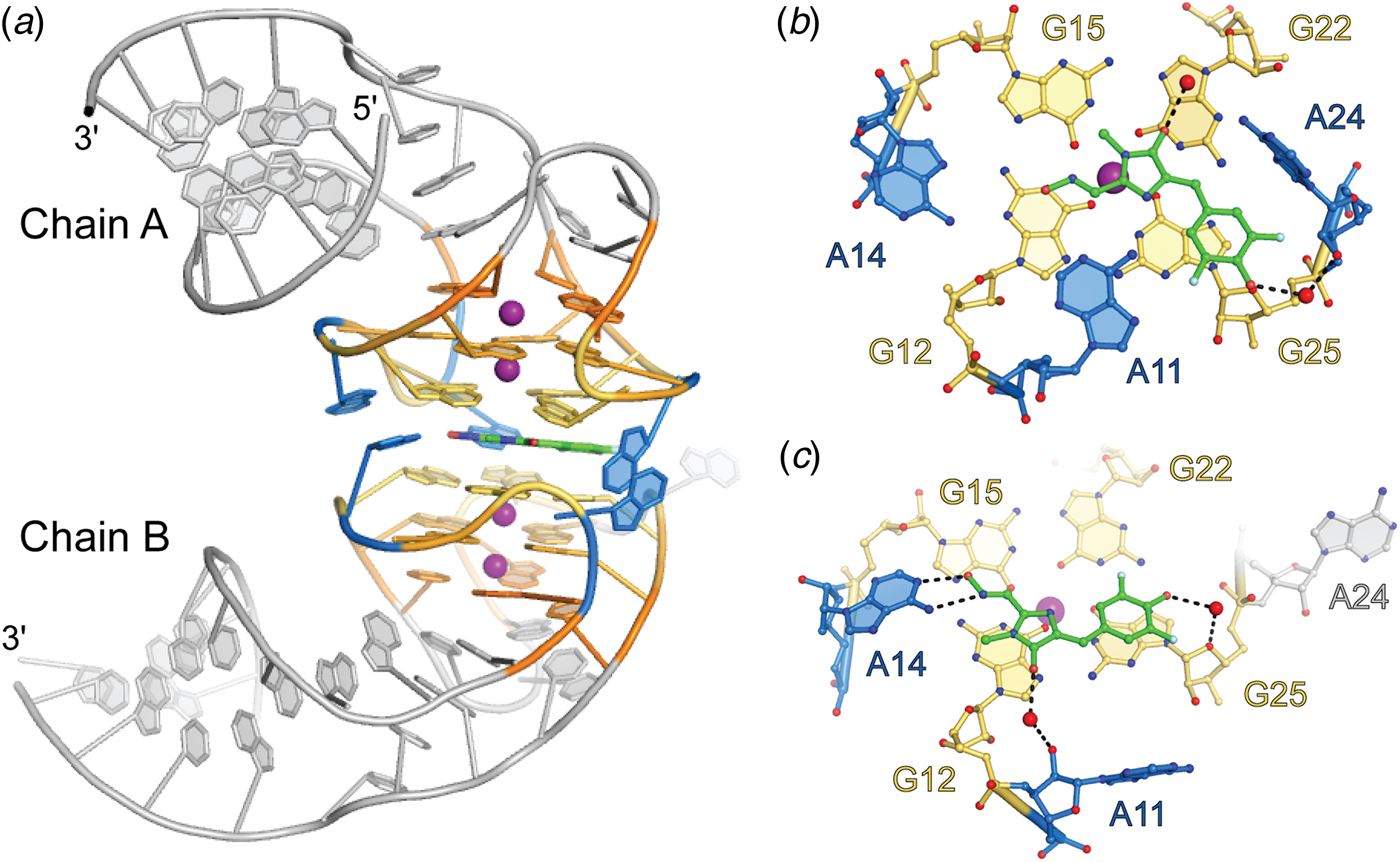
Selection from a randomized library for an RNA to bind and enhance the fluorescence of DFHO produced a yellow fluorescence turn-on aptamer, Corn (Song et al., Reference Song, Filonov, Kim, Hirsch, Li, Moon and Jaffrey2017). The small size of Corn (36 nt) was exploited to successfully image the activity of RNA polymerase III transcriptional units in live cells. Crystallographic structure determination revealed that Corn exists as a homodimer that binds one molecule of DFHO at its interprotomer interface (Fig. 6), and biochemical analyses confirmed this 2:1 RNA:DFHO stoichiometry. DFHO binds in a planar conformation, with a plane of mirror symmetry. Since Corn RNA is chiral, it cannot match the symmetry of the bound fluorophore and breaks the symmetry locally at the binding site. Overall, however, the dimer is symmetric, the two protomers being identical away from the interface. The dimerization interface of Corn is unique among known dimeric RNAs not only in being quasisymmetric (Jones and Ferré-D'Amaré, Reference Jones and Ferré-D'Amaré2015) but because it lacks any base-pairing interactions between protomers. Each Corn RNA comprises an A-form duplex that stacks on a four-tiered quadruplex, with an antiparallel connectivity much simpler than that of Spinach. Two of the tiers are canonical G-quartets, and one G-quartet from each protomer sandwiches the bound fluorophore. In addition, three unpaired adenosines from each RNA surround the bound fluorophore, and because of the quasisymmetry, adenines from the two protomers adopt different conformations. Consistent with the greatly improved photostability of Corn over Spinach (by over a factor of 1000), one of the interfacial adenines makes a bidentate interaction through its Watson–Crick face with the oxime of DFHO.
Structure of the Corn aptamer. (a) Cartoon representation of the Corn aptamer–fluorophore complex (PDB ID 5BJO). Quadruplex nucleotides are shown in warm colors and adenine flaps, at the dimer interface, shown in blue. DFHO ligand is represented as green sticks. (b) Ball-and-stick representation of DFHO interactions with Chain A at the dimer interface. Nucleotides and DFHO are colored according to (a) with water molecules shown as red spheres. Hydrogen bonds are represented as black dashed lines. (c) Ball-and-stick representation of DFHO interactions with Chain B at the dimer interface.

The quasisymmetry of the DFHO-bound Corn homodimer hinted that it might be possible to engineer the aptamer into variants that would function as obligate heterodimers. Such variants may be employed as RNA analogs of split GFP (and other split protein reporter systems), to monitor co-expression, co-localization, and dimerization of cellular RNAs. Mutagenesis of the interfacial adenines of Corn confirmed the importance of these residues for fluorescence turn-on, as most mutants were inactive, and even the most active was only a quarter as bright as the parental aptamer. However, when point mutants of Corn were combined pairwise, three combinations produced fluorescence approaching 50% of the wild-type, suggesting this may be a promising approach to generate ‘split Corn’.
To gain further insight into how the quasisymmetric Corn interface arises, its crystal structures in the absence of fluorophore, and also in the presence of the non-specific but G-quadruplex-preferent fluorophores thioflavin-T (ThT) and thiazole orange (TO) were determined (Sjekloca and Ferré-D'Amaré, Reference Sjekloća and Ferré-D'Amaré2019). The ligand-free Corn crystallized as an exactly symmetric homodimer, but at least in the crystalline form of the RNA, the ligand binding pocket had collapsed, such that the G-quadruplexes of the two protomers stacked directly on each other. Numerous studies have shown that ThT and TO bind non-specifically to a variety of nucleic acids and undergo variable levels of fluorescence turn-on (Turaev et al., Reference Turaev, Tsvetkov, Tankevich, Smirnov, Aralov, Pozmogova and Varizhuk2019; Nygren et al., Reference Nygren, Svanvik and Kubista1998; Jarikote et al., Reference Jarikote, Krebs, Tannert, Röder and Seitz2007; Guan et al., Reference Guan, Zhang, Sun, Li, Xiang, Wang, Lan, Yang, Xu, Guo and Tang2018). More recently, it was found that G-quadruplex containing DNAs and RNAs strongly activate ThT fluorescence (Mohanty et al., Reference Mohanty, Barooah, Dhamodharan, Harikrishna, Pradeepkumar and Bhasikuttan2013; Renaud et al., Reference Renaud de la Faverie, Guédin, Bedrat, Yatsunyk and Mergny2014; Xu et al., Reference Xu, Li, Xiang, Yang, Sun, Guan, Wang, Liu, Yu, Shi, Chen and Tang2016). This is the case for Corn, which achieves Φ of 0·41 and 0·53 for ThT and TO, respectively, considerably higher than for its cognate fluorophore DFHO (Φ = 0·25). The Corn co-crystal structures with these non-specific fluorophores revealed a third type of Corn homodimer, in this case strictly symmetric but with a binding pocket at the interprotomer interface. ThT and TO bind to Corn with 2:2 and 2:1 (RNA:fluorophore, respectively) stoichiometry, but symmetrically (or in two equivalent conformations in the case of TO). Neither fluorophore makes interactions with nucleobases or riboses; both ThT and TO appear to bind exclusively by stacking between the G-quartets of the two Corn protomers. Overall, these results suggest that Corn, whose dimerization K d is <1 nM, exists in solution as a mixture of open and closed symmetric forms, and that fluorophore binding either maintains symmetry (for ligands such as ThT and TO that do not engage in hydrogen bonding with RNA functional groups) or breaks symmetry, for ligands such as DFHO that make specific interactions with interfacial nucleotides.
Excited-state proton transfer in Chili
DFHBI and DFHO, the Spinach and Corn fluorophores, are thought to function by canonical TICT; the turn-on aptamers stabilize the planar conformation of their bound fluorophores, thereby dramatically increasing Φ. One of the structurally unrelated fluorescence turn-on aptamers isolated in the Spinach selection, termed 13–2 min, in conjunction with the variant fluorophore DMHBI, exhibited an unusually large Stokes shift of 137 nm (Paige et al., Reference Paige, Wu and Jaffrey2011), which suggests that it may also incorporate ESPT in its fluorescence turn-on mechanism, as this underlies the large Stokes shifts of FPs such as LSSmOrange (Shcherbakova et al., Reference Shcherbakova, Hink, Joosen, Gadella and Verkhusha2012) and LSSmKate (Piatkevich et al., Reference Piatkevich, Hulit, Subach, Wu, Abdulla, Segall and Verkhusha2010a, Reference Piatkevich, Malashkevich, Almo and Verkhusha2010b). The sequence of the ~60-nt 13–2 min aptamer suggests a structure different from that of Spinach, and 1D solution NMR indicates that while this aptamer also incorporates a G-quadruplex at or near its fluorophore binding site, it is different from the Spinach G-quadruplex (Warner et al., Reference Warner, Chen, Song, Strack, Thorn, Jaffrey and Ferre-D'Amare2014). No atomistic structure of 13–2 min has been reported. In an effort to improve the properties of this fluorescent tag system, several fluorophore variants of DFHBI containing the cationic moiety N-trimethylaniline were synthesized (Steinmetzger et al., Reference Steinmetzger, Palanisamy, Gore and Höbartner2019). It was found that in conjunction with the same aptamer, rechristened Chili, a variety of colors could be obtained. For one of the new fluorophores, DMHBO+, the large Stokes shift (136 nm) was maintained, and the affinity for the RNA improved nearly 50-fold to a K d of 12 nM. Its large Stokes shift, and its emission maximum at 592 nM, makes the Chili–DMHBO+ complex attractive for studies in which Förster resonant energy transfer (FRET), for instance to the rhodamine dye Atto 590, is sought, even though its modest Φ of 0·1 limits the applications where sensitivity is important. Another trimethylanilinium-containing fluorophore, DMHBI+, in complex with Chili, produced a Stokes shift of 127 nM, and while the affinity of the complex was weaker (K d = 63 nM), Φ was 0·4. Thus, further improvement of the Chili aptamer and its complexes with cationic p-HBI derivatives holds promise.
The Mango aptamers
Mango-I fluorescence is limited by a non-planar fluorophore
Although TO interacts non-specifically with DNAs and RNAs yielding variable fluorescence turn-on, the addition of a substituent to its benzothiazole heterocycle greatly reduces this intercalation-mediated binding. The TO derivative TO1-Biotin (in which a PEG linker connects the fluorophore to a biotin moiety useful for the immobilization of the fluorophore) was employed to search for high-affinity turn-on aptamers of moderate size. An aptamer called Mango-I (originally ‘RNA Mango’), with a 29-nt conserved core sequence resulted from the in vitro selection experiment performed so as to increase the on-rate of the aptamer while reducing the off-rate, and exhibited high affinity for TO1-Biotin (K d = 3·6 nM). Despite its modest Φ (0·14), the substantial fluorescence enhancement achieved by the aptamer (~1100-fold) and the high ε of the TO moiety allowed imaging of Mango-I–TO1-Biotin in microinjected live Caenorhabditis elegans.
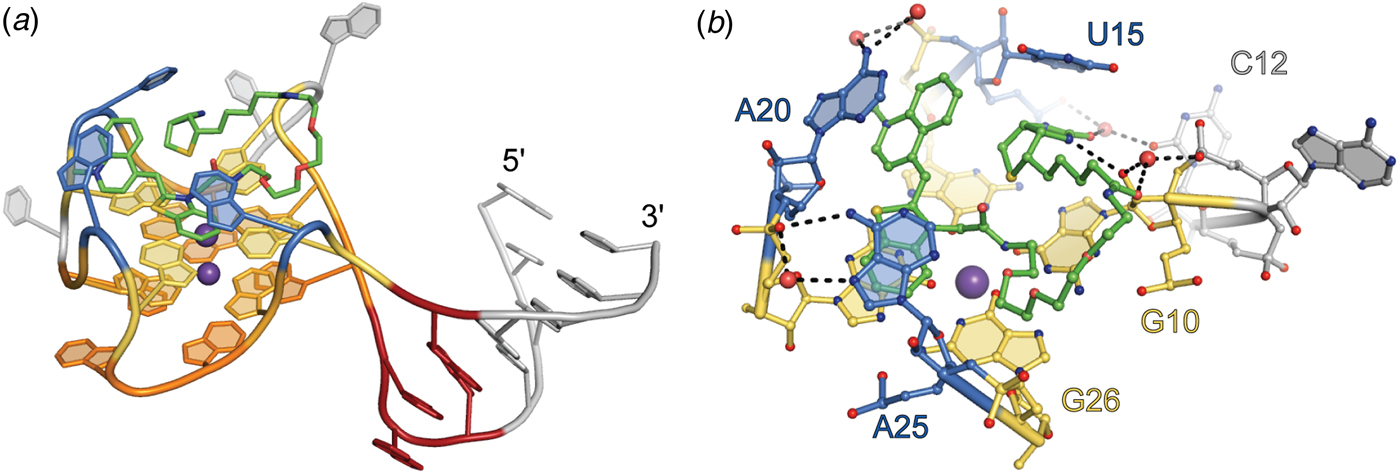
The 1·7 Å-resolution co-crystal structure of the Mango-I–TO1-Biotin complex (Trachman et al., Reference Trachman, Demeshkina, Lau, Panchapakesan, Jeng, Unrau and Ferré-D'Amaré2017a, Reference Trachman, Truong and Ferre-D'Amare2017b) revealed an RNA of relatively simple structure in which a three-tiered G-quadruplex is linked flexibly to an A-form helix through an interrupted GNRA tetraloop-like junction (Fig. 7a). The TO moiety of the fluorophore binds to one of the exposed planar faces of the G-quadruplex and is held in place by the nucleobases of two unpaired adenines from propeller loops of the mostly parallel G-quadruplex. Unexpectedly, the PEG linker and biotin of the fluorophore also pack against the G-quadruplex. When bound to Mango-I, TO1-Biotin adopts a circular conformation in which the biotin and methylquinoline heterocycles are closely juxtaposed. This conformation of the fluorophore appears to maximize the solvent-inaccessible interface between the small molecule and the RNA, probably contributing to the high affinity of the complex. The crystal structure shows that aptamer binding imposes a 45° angle between the heterocycles of TO (Fig. 7b). This conformation, suboptimal for TICT, may be responsible for the modest quantum yield of the complex. To improve fluorophore planarity, the biotin of TO1-Biotin was replaced with desthiobiotin. Presumably by relief of steric crowding, this resulted in a 50% increase in fluorescence enhancement.
Structure of the Mango-I aptamer. (a) Cartoon representation of the Mango-I aptamer (PDB ID: 5V3F) bound to TO1-Biotin (green sticks). Variable helical element and disordered nucleotides are shown in gray. GAA^A tetraloop-like junction shown in red. Binding pocket nucleotides are shown in warm, orange-yellow colors for the quadruplex and blue for nucleotide flaps. (b) Side view of the Mango-I binding pocket. Nucleotides and TO1-Biotin in ball-and-stick representation.

Mango-II and Mango-IV have improved brightness
Following the success in isolating the compact, high-affinity turn-on aptamer Mango-I, it was hypothesized that brighter, similarly high affinity, compact aptamers may exist in the sequence pool from which that RNA was selected. To search for such molecules, the final pool from the Mango-I selection was subjected to a microfluidics-based, in vitro compartmentalization selection (Autour et al., Reference Autour, C Y Jeng, D Cawte, Abdolahzadeh, Galli, Panchapakesan, Rueda, Ryckelynck and Unrau2018). RNA transcripts were expressed in aqueous droplets immersed in oil and incubated with TO1-Biotin. Droplets were sorted based on brightness relative to Mango-I. Sequential rounds of fluorescence sorting were performed with increasing concentration of small-molecule competitors to select for high-affinity aptamers. This functional re-selection yielded three new aptamer sequences of 24–29 nt core length, named Mango-II, Mango-III, and Mango-IV. All three new aptamers were brighter than Mango-I, with Mango-III being the brightest (Table 1). Dissociation constants for TO1-Biotin ranged from 1 to 11 nM (Table 1). Both Mango-II and Mango-IV have high sequence similarity to Mango-I; Mango-III is more divergent. The new RNAs were tested for fluorescence activity in live and fixed mammalian cells by grafting them into 5S, U6, and box C/D RNAs. Subcellular localization of the tagged RNAs was consistent with the localization of the native RNAs, demonstrating the usefulness of these aptamers for imaging both nuclear and cytoplasmic RNAs. Despite being the second brightest and lowest affinity TO1-Biotin aptamer in vitro, Mango-IV was the brightest of the fluorescent aptamers in live and formaldehyde-fixed cells.
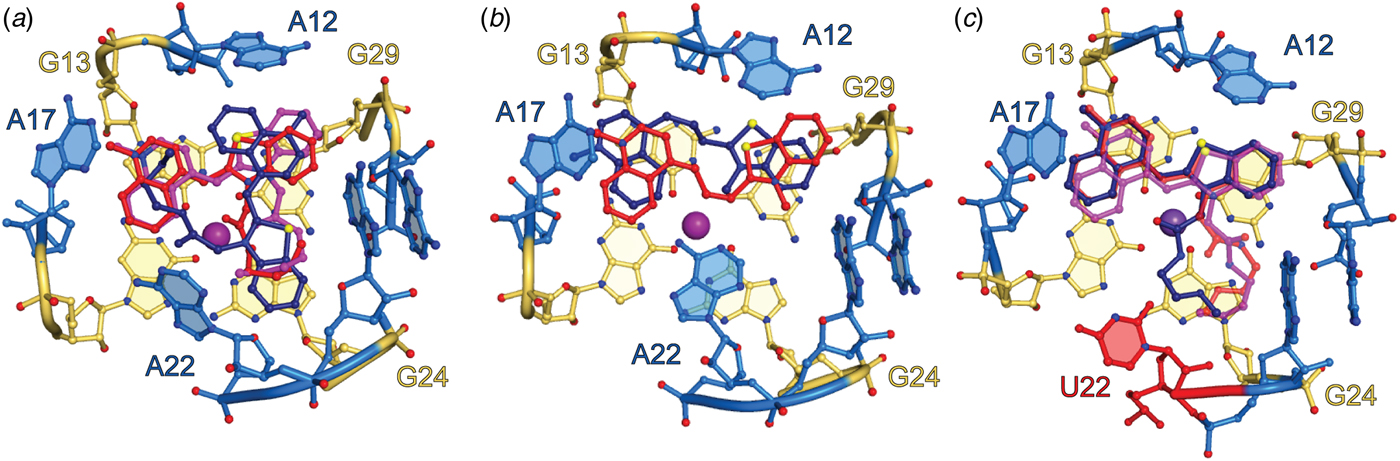
Crystallographic structure determination of Mango-II revealed functionally significant differences between it and Mango-I, despite their overall similar folds (the structure of Mango-IV has not been reported). As in Mango-I, the fluorophore binds on the top face of the three-tiered G-quadruplex of Mango-II, but its TO headgroup adopts a planar conformation, and is held in place by adenine flaps in a considerably more open binding pocket. Neither the biotin nor most of the PEG linker binds to Mango-II (Fig. 8). The crystallographic asymmetric unit (A.S.U.) comprised three independent aptamers with an overall similar structure. In all three molecules, the TO1 headgroup was coplanar with the G-quadruplex, but in one, it was rotated by 90° around the G-quadruplex fourfold axis, suggesting limited stereoselectivity of the fluorophore-binding pocket (Fig. 8). TO3-Biotin, a derivative of TO1-Biotin with extended conjugation from which the aptamer elicits red-shifted fluorescence and for which it has a comparable affinity, was also co-crystalized with Mango-II. In this structure, the three RNAs in the A.S.U are near-identical, but only two are bound to TO3-Biotin (Fig. 8b). The conformation of the unpaired nucleobase of A22 (in one of the propeller loops) differs between the Mango-II complexes with the two fluorophores. In the TO1-Biotin complexes, A22 extends upward and away from the fluorophore, while in the TO3-Biotin complex, the purine base packs against the dimethyne linker of the headgroup (Fig. 8b). Site-directed mutagenesis produced the more selective A22U mutant, which exhibited 18% improved fluorescence enhancement of TO1-Biotin and reduced affinity and fluorescence enhancement of TO3-Biotin. The crystal structure of Mango-II(A22U)–TO1-Biotin showed all three complexes in the A.S.U. adopting similar conformations (Fig. 8c), suggesting improved stereoselectivity. Biophysical experiments with analogs of TO1-Biotin imply that residue 22 modulates selectivity of Mango-II by interacting with the PEG linker of the fluorophore.
Binding pocket of Mango-II. (a) Ball-and-stick representation of the Mango-II-TO1-Biotin binding pocket. TO1-Biotin structures from three protomers in the asymmetric unit (red, purple, and dark blue) are superimposed. (b) Ball-and-stick representation of the Mango-II–TO3-Biotin binding pocket. TO3-Biotin structures from two protomers in the asymmetric unit (red, purple, and dark blue) are superimposed. (c) Ball-and-stick representation of the structure guided Mango-II(A22U) mutant bound to TO1-Biotin. TO1-Biotin colored according to (a) with mutated residue, 22, colored red.

Mango-III is an aptamer of unusual structural complexity
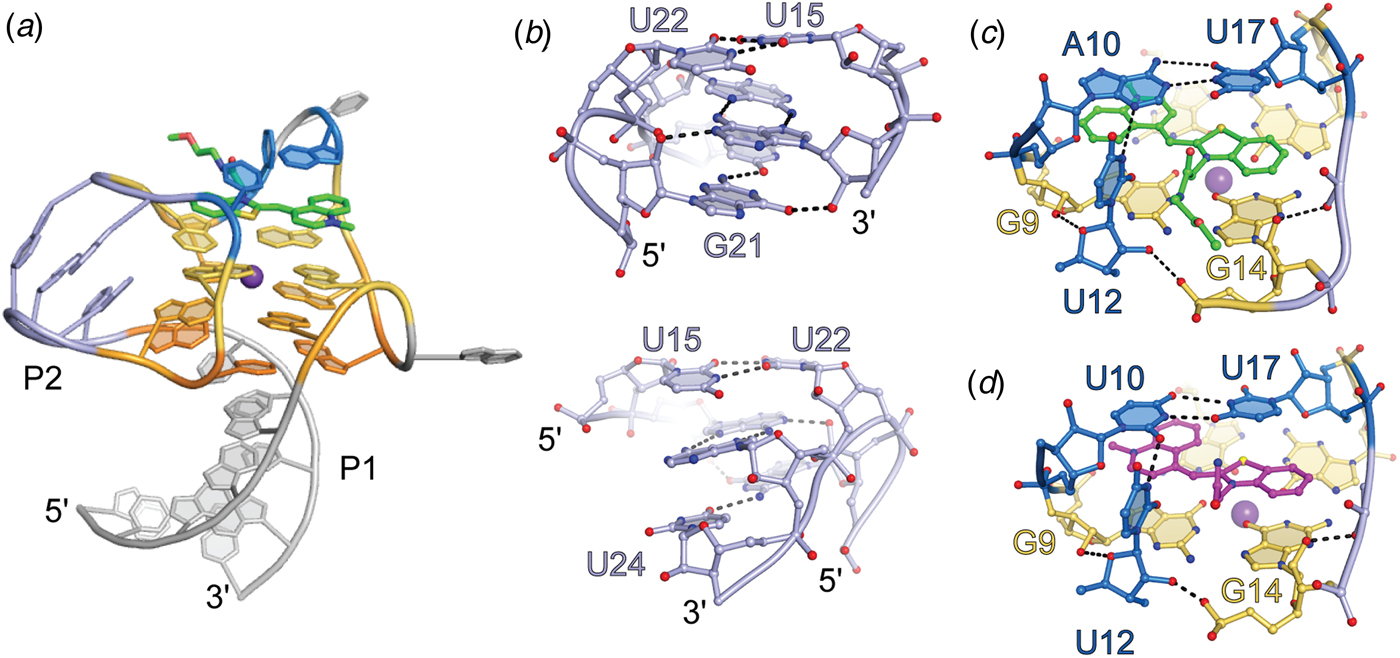
Crystallographic structure determination of the brightest and most sequence-divergent Mango aptamer in complex with TO1-Biotin revealed an unusually complex 3D structure for a small RNA. Mango-III folds around a two-tiered G-quadruplex that stacks co-axially on a partially water-mediated base triple, which in turn stacks on an A-form duplex. Completely unexpected, one of the propeller loops of the G-quadruplex base pairs with a segment 3′ to the quadruplex to form a second duplex consisting of three non-canonical pairs. For two of these, the backbone runs in the parallel direction, and all three are trans pairs (canonically, nucleic acid duplexes are comprised of cis, anti-parallel base pairs). This helix is unprecedented not only because of its local structure; globally, it introduces a connectivity to Mango-III that is analogous to that of a canonical (H-type) pseudoknot (Pleij et al., Reference Pleij, Rietveld and Bosch1985), that would be formed by base pairing of a loop at the apex of a conventional stem-loop with an unpaired segment distal to it. In the case of Mango-III, the G-quadruplex takes the place of the stem of the conventional stem-loop. Finally, two nucleotides, one each from two propeller loops diagonally across the G-quadruplex, form a trans A10•U17 Watson–Crick base pair that closes over the G-quadruplex. The overall complexity of Mango-III compared to Mango-I becomes apparent when the number of nucleotides that participate in hydrogen bonding is considered. Of the core 28 nucleobases of Mango-III, 26 participate in hydrogen bonding, while for the 22-nucleitide core of Mango-I only 16 do (92 versus 72%).
The co-crystal structure shows that the headgroup of TO1-Biotin binds to Mango-III in a planar conformation (consistent with its quantum yield of 0·55), sandwiched between the G-quadruplex and the trans Watson–Crick pair of the aptamer (Fig. 9). During in vitro selection, it was noted that a transition mutation of nucleotide 12 (crystal structure numbering) from cytosine to uridine improved fluorescence of the Mango-III pool by ~40% (Autour et al., Reference Autour, C Y Jeng, D Cawte, Abdolahzadeh, Galli, Panchapakesan, Rueda, Ryckelynck and Unrau2018). The crystal structure shows the nucleobase of U12 in an unusual conformation, projecting into the binding pocket perpendicular to the planes of the G-quadruplex and trans Watson–Crick base pair, packing against the PEG linker of TO1-Biotin. Thus, it appears that while the G-quadruplex and trans Watson–Crick base pair prevent rotation of the photoexcited fluorophore heterocycles, U12 packs against the PEG linker of TO1-Biotin prevent sliding of the TO1-Biotin (Fig. 9c), functioning in a manner analogous to that of residue 22 of Mango-II.
Structure of the Mango-III aptamer. (a) Cartoon representation of the Mango-III aptamer in complex with TO1-Biotin (green sticks), highlighting the triplex and quadruplex nucleotides (warm orange-yellow colors), P2 helix (light blue), and binding pocket nucleotides (marine). (b) Front (top) and back (bottom) view of the P2 helical element. (c) Ligand binding pocket of the Mango-III–TO1-Biotin complex. Hydrogen bonds are represented with black dashes. (d) Ligand binding pocket of the Mango-III (A10U) mutant in complex with (Z)-TO1-Biotin.

Structure-guided engineering and reselection of Mango-III
Electronic coupling between RNA and fluorophore would be expected to impact fluorescence properties. Mutagenesis of the trans Watson–Crick pair to all 16 possible variants revealed that a U10•U17 pair improved fluorescence enhancement by 16% (Trachman et al., Reference Trachman, Autour, Sunny, Abdolahzadeh, Andreoni, Cojocaru, Garipov, Dolgosheina, Knutson, Ryckelynck, Unrau and Ferré-D'Amaré2019). The co-crystal structure of the Mango-III(A10U)–TO1-Biotin complex contained four complexes in the A.S.U. The aptamers are highly similar among themselves, and also to the parental RNA. The mutated residue A10U forms a trans Watson–Crick U•U base pair, and the fluorophore binds in the same manner as in Mango-III. Notably, while in two of the complexes in the A.S.U., the TO1-Biotin is bound in the (E) conformation (as in all previously determined Mango aptamer structures), and in two of the Mango-III(A10U) complexes, the fluorophore is in the (Z) conformation (Fig. 9d). Thus, it appears that while the interaction of the TO1-Biotin with the homopyrimidine base pair improves brightness, its reduced steric confinement leads to less stereoselectivity.
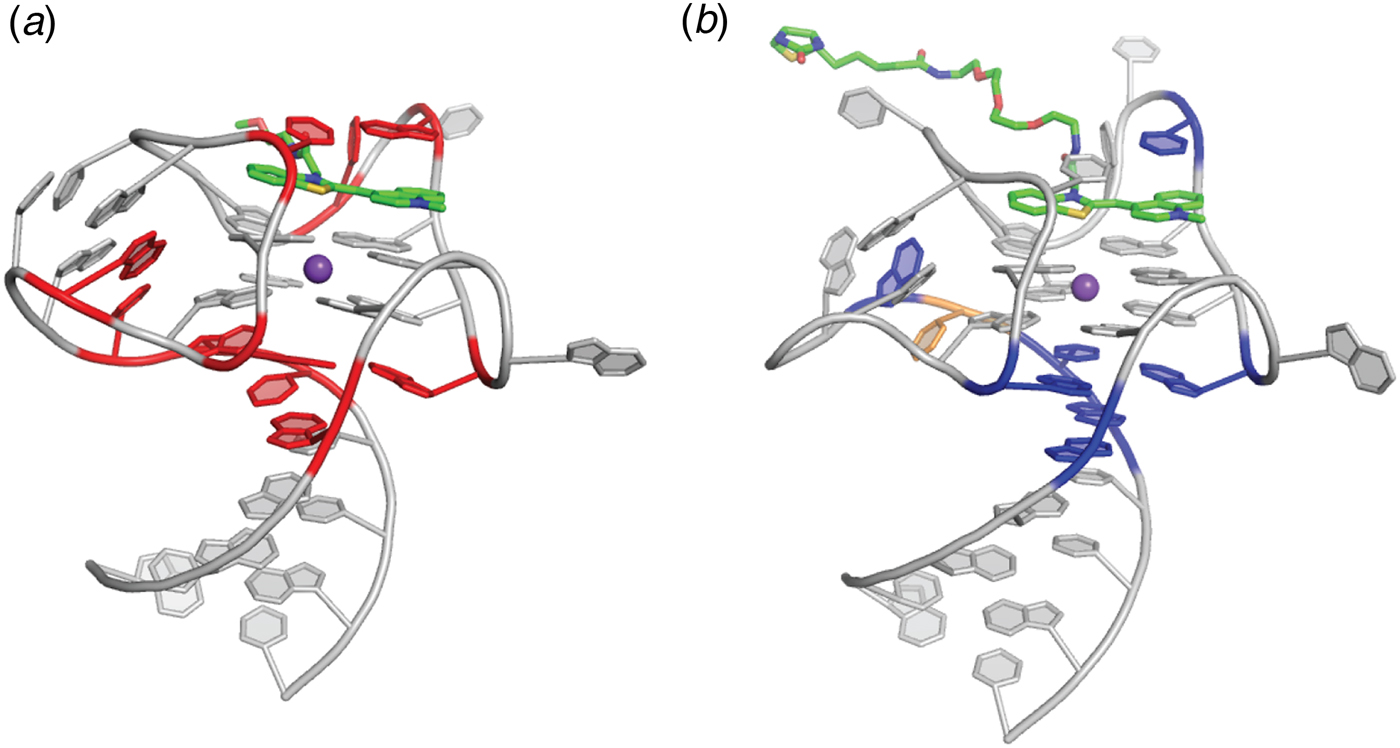
To search for additional variants of Mango-III with improved properties, a pool of variants was prepared by mutagenizing residues surrounding the fluorophore as well as those in the co-axial junction between the duplex and the quadruplex. Functional, microfluidic-based re-selection of this pool yielded four sequence variants. The most abundant improved variant (58% of the final pool), termed iMango-III, exhibited 13% greater fluorescence enhancement of TO1-Biotin than Mango-III. The 1·5 Å-resolution co-crystal structure of the iMango-III–TO1-Biotin complex revealed several differences from the parental Mango-III (Fig. 10). First, the trans Watson–Crick pair is formed by two uridines, confirming this is the optimal solution. Second, the sequence of the ‘pseudoknot’ duplex has changed, and this duplex is shortened by one residue. Third, an insertion has allowed rearrangement of the base triple at the co-axial junction, which is now a canonical (non-water-mediated) base triple. Examination of the photophysical properties of this new aptamer indicated that its excitation and emission wavelengths are blue-shifted by 4–7 nm relative to Mango-III and Mango-III(A10U) (the latter two have exactly overlapping spectra). Moreover, the fluorescence lifetime of the iMango-III complex was also consistently shorter than those of the other two aptamers. Reversion of the trans Watson–Crick pair of iMango-III [i.e. iMango-III (U10A)] did not lengthen the fluorescence lifetime or eliminate the hypsochromic shift. Thus, it appears that iMango-III residues that are not in direct contact with the fluorophore (either at the coaxial junction or in the non-canonical ‘pseudoknot’ helix) are responsible for these changed photophysical properties of the improved aptamer resulting from this structure-guided re-selection experiment.
Structure guided engineering of the Mango-III aptamer. (a) Structure of the Mango-III aptamer with 10 randomized nucleotide positions (red). Two rounds of SELEX followed by four rounds of microfluidic fluorescence sorting were carried out. (b) Locations of nucleotides that varied from the original sequence (blue) mapped onto the iMango-III structure. Yellow nucleotide represents the place at which an insertion was introduced and selected.

The dimethyl indole red aptamers
Cyanine dyes, such as TO, generally have large extinction coefficients, making them attractive conditional fluorophores for turn-on aptamer development. However, the hydrophobic and cationic characteristics inherent to these fluorophores promote non-specific binding to nucleic acids and membranes. The asymmetrical cyanine dye dimethyl indole red (DIR) was designed and synthesized in order to suppress non-specific binding to nucleic acids (Fig. 1) (Constantin et al., Reference Constantin, Silva, Robertson, Hamilton, Fague, Waggoner and Armitage2008). The dimethyl substituent was intended to have reduced the ability of the indole dye to intercalate into nucleic acids while the anionic propylsulfonate moiety yields a zwitterion with lessened non-specific electrostatic binding to nucleic acids. A propyne conjugated linker separates the two conjugated heterocylces to promote red emission and a large extinction coefficient (ε = 134 000 M−1 cm−1). Aptamers to DIR were generated through SELEX (Constantin et al., Reference Constantin, Silva, Robertson, Hamilton, Fague, Waggoner and Armitage2008). Three aptamers were identified that enhance the fluorescence of DIR by >20-fold. As this modest fluorescence enhancement is not sufficient for in-cell imaging, a second selection was performed against DIR using a starting pool enriched with a stem-loop structure (Tan et al., Reference Tan, Constantin, Sloane, Waggoner, Bruchez and Armitage2017). This selection yielded an RNA, DIR2s, that promiscuously binds cyanine dyes with submicromolar dissociation constants. In complex with the conditional fluorophore DIR-Pro (ε = 164 000 M−1 cm−1; K d = 252 nM), DIR2s fluoresced at 658 nm. To test function in live cells, DIR2s was fused to an EGFR aptamer (Li et al., Reference Li, Larson, Nguyen, Sokolov and Ellington2010) and internalization of the EGFR–DIR2s–DIR chimeric complex was monitored with microscopy with a red channel filter (Tan et al., Reference Tan, Constantin, Sloane, Waggoner, Bruchez and Armitage2017).
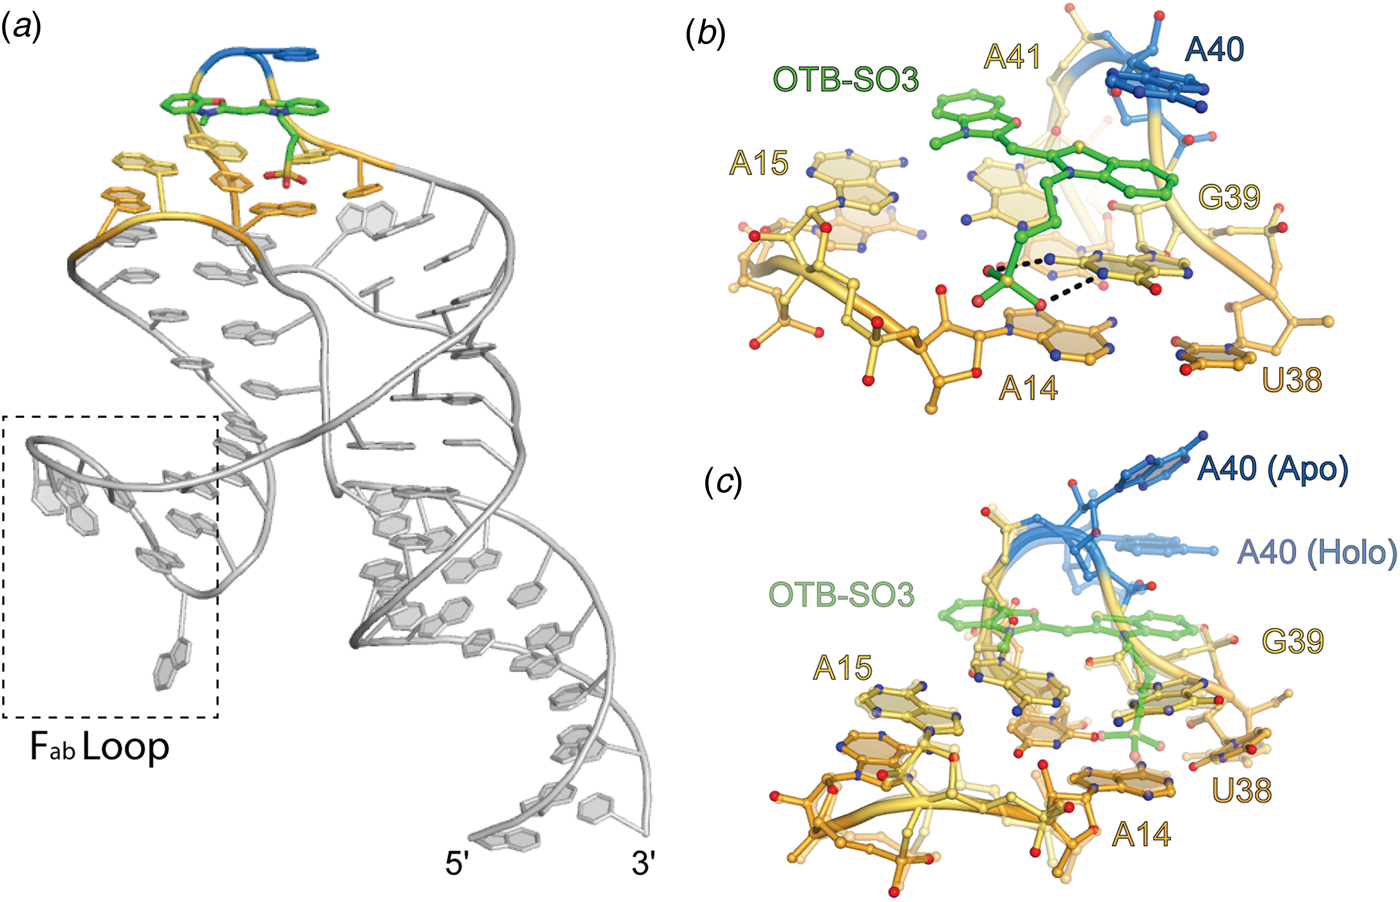
Crystal structures of the DIR2s aptamer, unliganded and bound to the oxazole thiazole blue (OTB-SO3) fluorophore have been reported (Fig. 11) (Shelke et al., Reference Shelke, Shao, Laski, Koirala, Weissman, Fuller, Tan, Constantin, Waggoner, Bruchez, Armitage and Piccirilli2018). These locate the ligand at a kissing-loop-type junction, in which the fluorophore headgroup stacks between a mixed-sequence base tetrad and a single adenine ‘flap’ (Fig. 11b). Similar to the MG aptamer, DIR2s lacks a G-quadruplex motif, yet employ a base tetrad to promote planarity of the fluorophore heterocycles. In addition to the stacking interaction, two hydrogen bonds form between the Watson–Crick face of a guanine and the sulfate OTB-SO3 (Fig. 11b). The only substantial change to the structure induced by fluorophore binding appears to be the adenine flap swinging over the ligand (Fig. 11c). This turn-on aptamer system has the potential for bright fluorescence, and the available structural information should drive further improvements.
Structure of the DIR2s aptamer. Cartoon representation of DIR2s aptamer bound to OTB-SO3 (green sticks). Nucleotides composing the ligand platform are colored orange and yellow and the adenine lid (A40) is colored blue. Dashed box denotes the Fab binding loop used to facilitate crystallization. (b) Ligand binding pocket of the DIR2s aptamer (ball-and-stick) bound to OTB-SO3 (green ball-and-stick). (c) Overlay of the Apo-DIR2s structure with DIR2s-OTB-SO3 (transparent).

Aptamers to fluorophore–quencher conjugates
All the fluorescence turn-on aptamers discussed above bind to a conditional fluorophore to promote fluorescence by TICT (as well as ESPT for Chili). Aptamers have also been designed to induce fluorescence by reducing intramolecular quenching. By covalently attaching a contact quencher through a flexible linker to a fluorophore, intrinsic fluorescence is dramatically reduced. The first report of the selection of a fluorescence turn-on aptamer employing a fluorophore–quencher conjugate was of an RNA selected to bind the quencher dimethylaniline (Sparano and Koide, Reference Sparano and Koide2005, Reference Sparano and Koide2007). Binding of dimethylaniline by the DMA aptamer enhanced the fluorescence of the conjugated fluorescein, but applications of this RNA were limited by its micromolar dissociation constant for dimethylaniline. Subsequently, an effort to repurpose the SRB aptamer was undertaken by ligating various quenchers to SRB (Sunbul and Jäschke, Reference Sunbul and Jäschke2013). Fluorescence enhancement was promoted by eliminating contact quenching by binding the fluorophore SRB. The SRB aptamer was still limited by micromolar affinity to its fluorophore. A combination of the SRB aptamer and an aptamer selected to bind dinitroaniline, an effective contact quencher, was used as proof of principle for two-color imaging of RNA (Arora et al., Reference Arora, Sunbul and Jäschke2015). More recently, Riboglow was developed using the aptamer domain of the bacterial cobalamin riboswitch. Cobalamin effectively quenches the fluorescence of fluorescent molecules through contact quenching. The high affinity of the cobalamin riboswitch (K d ~ 4 nM), coupled with the folding efficiency of the biologically evolved RNA provided a dramatic improvement over previously developed fluorophore–quencher conjugates (Braselmann et al., Reference Braselmann, Wierzba, Polaski, Chromiński, Holmes, Hung, Batan, Wheeler, Parker, Jimenez, Gryko, Batey and Palmer2018). Riboglow was able to outperform the MS2 cassette system to image stress granules in live cells. Overall, aptamers that induce fluorescence of fluorophore–quencher conjugates hold promise for their ability to accommodate spectrally diverse fluorophores with minimal RNA engineering. However, these systems suffer from high background fluorescence, inherent to contact quenching in solution.
Discussion
Optimization of fluorophores and aptamer selectivity
Rapid development of fluorescence turn-on aptamers has been facilitated by the use of established fluorophores, which can be modified to improve molecular characteristics (Lavis and Raines, Reference Lavis and Raines2008; Lavis, Reference Lavis2017a, Reference Lavis2017b). Limits to the ultimate photophysical and imaging capabilities of aptamer–fluorophore complexes are largely set by the fluorophores. For example, cyanine dyes and triphenylmethane dyes often bind with high affinity to fluorescence turn-on aptamers and can yield high brightness, as a result of their large absorption cross-sections (ε). However, hydrophobic, and sometimes cationic properties inherent to these fluorophores can result in non-specific interactions with membranes and nucleic acids, and the concomitant fluorescence turn-on can raise the background fluorescence. As noted above, the specificity of the Mango aptamers for TO1-Biotin is in part mediated by interactions with the PEG linker (as well as the biotin itself, in the case of Mango-I), and the linker also reduces non-specific nucleic acid binding and turn-on. Thus, substituting fluorophores with hydrophilic tags provides a plausible approach to promoting specificity and photostability (Shank et al., Reference Shank, Zanotti, Lanni, Berget and Armitage2009, Reference Shank, Pham, Waggoner and Armitage2013; Grimm et al., Reference Grimm, Muthusamy, Liang, Brown, Lemon, Patel, Lu, Macklin, Keller, Ji and Lavis2017; Lavis, Reference Lavis2017a, Reference Lavis2017b).
Fluorophores derived from FPs, such as DFHBI and DFHO, have smaller ε than those of cyanine dyes, limiting their ultimate brightness. However, being more polar and often anionic, they are less prone to non-specific interactions. In addition, extensive studies of FP fluorophores facilitate the rational design of synthetic FP-derived conditional fluorophores with consistently improving properties (see, e.g. Paige et al., Reference Paige, Wu and Jaffrey2011; Song et al., Reference Song, Filonov, Kim, Hirsch, Li, Moon and Jaffrey2017). Bright cyanine dye-contact quencher conjugates provide easy access to red-shifted emission spectra, and can comprise a variety of quenchers, including polar or anionic quenchers that may reduce non-specific cellular interactions, for which aptamers can be selected. Fluorophore–quencher conjugates often suffer from high background fluorescence and potential non-specific interactions. This is not to say that these systems cannot be utilized or further improved. At present, turn-on aptamers that bind their fluorophores with the highest affinity and produce the largest fluorescence enhancements employ cyanine dye derivatives (Table 1), and it has been demonstrated that this type of fluorophore, diffused into cells at low concentrations, can result in bright aptamer fluorescence with low background (Autour et al., Reference Autour, Westhof and Ryckelynck2016; Braselmann et al., Reference Braselmann, Wierzba, Polaski, Chromiński, Holmes, Hung, Batan, Wheeler, Parker, Jimenez, Gryko, Batey and Palmer2018).
To be effective imaging tools in vivo, it is desirable that turn-on aptamers exhibit high specificity for their cognate fluorophores, and discriminate strongly against other fluorophores. Such discrimination is essential if multiple turn-on aptamers are to be deployed simultaneously for studying different RNAs concurrently, as FRET pairs, or possibly as orthogonal FRET pairs (Jepsen et al., Reference Jepsen, Sparvath, Nielsen, Langvad, Grossi, Gothelf and Andersen2018). Structural and biochemical studies of RNA–small-molecule interactions indicate that molecular specificity arises primarily from polar interactions, while van der Waals and stacking interactions provide the driving force for the association through the hydrophobic effect. Thus, shape complementarity between the ligand and the RNA pocket may be sufficient for binding and fluorescence turn-on, but may not provide specificity. For instance, the Corn aptamer was found to promote bright fluorescence of two general nucleic acid dyes (ThT and TO), but crystal structures of these complexes revealed disorder in the binding pockets (Sjekloca and Ferré-D'Amaré, Reference Sjekloća and Ferré-D'Amaré2019). DFHO, the cognate fluorophore of Corn, was designed by adding a hydrogen bonding ‘handle’ (an oxime function) onto DFHBI, which the aptamer could use to increase specificity. Indeed, the Corn–DFHO co-crystal structure demonstrates that the aptamer makes two hydrogen bonds with this functional group. This recognition scheme is consistent with Corn–DFHO being 400-times brighter than the non-cognate Corn–DFHBI complex. Spinach, in contrast, is only 20 times brighter bound to its cognate fluorophore DFHBI, than in complex with the Corn fluorophore DFHO (Warner et al., Reference Warner, Sjekloca, Song, Filonov, Jaffrey and Ferré-D'Amaré2017). The Spinach fluorophore binding pocket appears to have generally limited selectivity, even being able to turn on the fluorescence of TO1-Biotin. Indeed, the Spinach–TO1-Biotin complex is nearly five times brighter than the cognate TO1-Biotin complex of Mango-I (Jeng et al., Reference Jeng, Chan, Booy, McKenna and Unrau2016). Because turn-on aptamers all employ planar arrangements of nucleobases to enhance fluorescence by TICT, some level of cross-reactivity is to be expected. Nonetheless, a combination of strict shape and hydrogen-bonding group complementarity, as seen for instance in some riboswitches (Edwards et al., Reference Edwards, Klein and Ferré-D'Amaré2007; Wakeman et al., Reference Wakeman, Winkler and Dann2007; Peselis and Serganov, Reference Peselis and Serganov2014), may allow a higher degree of aptamer–fluorophore specificity.
The diversity of turn-on aptamer structures
Most of the fluorescence turn-on aptamers whose structures have been determined to date employ G-quadruplexes to organize their cores, and to bind to their cognate fluorophores. This is unexpected because G-quadruplexes are unknown among structures of other small-molecule binding RNA aptamers and ribozymes (catalytic RNAs) evolved by SELEX, and absent as well in the known structures of naturally evolved metabolite-responsive RNAs (riboswitches). The 3D architectures of small-molecule binding aptamers, ribozymes, and riboswitches are typically organized around multi-helical junctions or around pseudoknots. Some of these RNAs incorporate both structural elements. However, there is no known example of a natural small-molecule binding RNA with a G-quadruplex, and the only known examples of in vitro evolved RNAs other than turn-on aptamers that incorporate a G-quadruplexes are protein-binding aptamers, such as the fragile-X mental retardation protein aptamer (Vasilyev et al., Reference Vasilyev, Polonskaia, Darnell, Darnell, Patel and Serganov2015; Phan et al., Reference Phan, Kuryavyi, Darnell, Serganov, Majumdar, Ilin, Raslin, Polonskaia, Chen, Clain, Darnell and Patel2011). Because G-quadruplexes are common among in vitro evolved DNAs (Tucker et al., Reference Tucker, Shum and Tanner2012), their absence from small-molecule binding RNAs (other than turn-on aptamers) likely is not a result of negative selection during the in vitro evolution process (e.g. by blocking reverse-transcription or causing aggregation). Thus, the prevalence of G-quadruplexes among turn-on RNA aptamers suggests that this nucleic acid structural motif is uniquely suited to activate conditional fluorophores.
The maximally fluorescent conformation of typical TICT fluorophores is one in which their conjugated heterocycles and linkers are coplanar. G-quadruplexes may be frequent in the ligand binding sites of turn-on RNA aptamers because by virtue of their cyclic symmetry and stabilization by the centrally bound cation (canonically the abundant intracellular monovalent ion, K+), their nucleobases are typically more coplanar than the bases of base pairs or triples, which often twist and buckle. Thus, G-quadruplexes can more easily restrain a stacked fluorophore into a conformation with a high quantum yield. In addition, the planar faces of G-quadruplexes are large enough to accommodate, not only the TICT fluorophore, but also additional RNA elements that can make lateral interactions with the fluorophore, thus contributing to affinity and selectivity (and possibly modulation of photophysical properties). Not all turn-on aptamers comprise G-quadruplexes. Those that do not, such as the DIR2s and MG aptamers, nonetheless employ base triples and quadruples to stabilize their fluorophores in a planar conformation.
G-quadruplexes typically display great thermodynamic stability under physiological conditions. An important design goal of fluorescence turn-on aptamers is small size, so as to allow for efficient transcription and to be minimally disruptive of the biological properties of a fluorescently tagged cellular RNA. The structural cores of most turn-on aptamers are only ~30 nucleotides long, yet these RNAs can make high-affinity, multidentate interactions with their cognate ligands that endow them with specificity, and also restrain their photoexcited states so as to induce fluorescence with high quantum yields. The Mango-III aptamer, whose structure results from functionalizing a G-quadruplex with two duplexes, a lone tertiary base pair, and a triplex interhelical junction, illustrates the unprecedented structural complexity that is possible in a small RNA. As structural complexity [and high information (Szostak, Reference Szostak2003)] is a prerequisite for functional complexity, G-quadruplexes may also be common in turn-on aptamers because they enable stable folding of even very small RNAs.
Applications of turn-on aptamers
Although the initial impetus for the development of fluorescence turn-on aptamer RNA aptamers was to serve as genetically-encoded tags for cellular RNAs to track their expression, localization, transport, and turnover of transcripts, they have been deployed for other applications. Similar to split GFP, split aptamers have been engineered to characterize quaternary interactions (Rogers et al., Reference Rogers, Andrews, Jaeger and Grabow2015; Alam et al., Reference Alam, Tawiah, Lichte, Porciani and Burke2017, Reference Alam, Jung, Verosloff, Clauer, Lee, Capdevila, Pastén, Giedroc, Collins and Lucks2019; Chandler et al., Reference Chandler, Lyalina, Halman, Rackley, Lee, Dang, Ke, Sajja, Woods, Acharya, Baumgarten, Christopher, Elshalia, Hrebien, Kublank, Saleh, Stallings, Tafere, Striplin and Afonin2018) making it possible to visualize co-localization of RNA in living cells. Split aptamers benefit from diffusion-limited maturation as opposed to FP maturation that can take minutes to hours (Bevis and Glick, Reference Bevis and Glick2002; Subach et al., Reference Subach, Subach, Gundorov, Morozova, Piatkevich, Cuervo and Verkhusha2009). Additionally, concentrations of small molecules have been determined in live cells through fluorescent aptamer-riboswitch chimeras (Paige et al., Reference Paige, Wu and Jaffrey2011, Reference Paige, Nguyen-Duc, Song and Jaffrey2012; Kellenberger et al., Reference Kellenberger, Chen, Whiteley, Portnoy and Hammond2015). This is not to say that biological sciences is the only field to benefit from this new technology. It has recently been shown that a robust in vitro transcription assay using a fluorescent aptamer read-out can assay toxin levels in polluted water (Alam et al., Reference Alam, Tawiah, Lichte, Porciani and Burke2017, Reference Alam, Jung, Verosloff, Clauer, Lee, Capdevila, Pastén, Giedroc, Collins and Lucks2019). These examples illustrate the diversity of applications possible for fluorescent RNA technologies and hint at the potential to expand on these in creative ways.
Perspectives
Fluorescence turn-on RNA aptamers hold great promise for unlocking the spatial and dynamic aspects of the transcriptome in live cells. There are still improvements to be made in regard to the design and engineering of optimal tags. The bimolecular nature of fluorescent aptamers enables tuning and selection of both the fluorophore and RNA component to achieve optimal properties. Recent developments in imaging dye technology (Grimm et al., Reference Grimm, Muthusamy, Liang, Brown, Lemon, Patel, Lu, Macklin, Keller, Ji and Lavis2017) can be applied so as to expand upon the current set of fluorophores used for RNA imaging. Fluorophore design and synthesis are likely to focus on generating conditional fluorophores with a large ε, as well as sufficient polar functionalization to promote solubility and specificity. Ideally, new fluorophores will have excitation maxima corresponding to popular diode laser wavelengths to facilitate use with widely available instrumentation. Additionally, an avenue of research suggested by FAPs, the use of endogenous conditional fluorophores such as biliverdin, is promising.
Although the workflow, SELEX → functional selection → structure guided engineering and re-selection has produced the various complexes of Mango-III variants and TO1-Biotin, fluorescent tags brighter than EGFP, continued progress in methods for generating bright and stable fluorescent aptamers remains important. In vitro selection experiments can only partially mimic conditions encountered within a cell, and in vivo aptamer selection is still under active development. In terms of structure-guided design, all extant turn-on aptamer crystal structures were solved using X-ray diffraction data collected over seconds to minutes in ambient light. The resulting structures likely represent the dark states of the aptamer–fluorophore complexes. In order to understand in predictive detail how RNA structure contributes to fluorescence turn-on, and how to rationally engineer fluorescence properties, high-resolution structures of photoexcited states are needed. Serial femtosecond crystallography, enabled by X-ray-free electron lasers (Chapman, Reference Chapman2019), holds promise for determining excited-state structures, in principle with high spatial and temporal resolution. Such structures would open the way to detailed quantum mechanical analyses of the photophysics of these fluorescent complexes.
Future fluorescent RNA tag development will likely recapitulate in part the trajectory of FP development. Engineering photoactivatable, photoconvertible, and photoswitchable fluorescent RNA aptamer–fluorophore complexes will improve coordinated tracking and super-resolution imaging of RNA complexes. Similar to FAPs, autocatalysis can be employed to covalently fuse the RNA–fluorophore complex and alter photophysical properties (Yu et al., Reference Yu, Gustafson, Han, Lafaye, Noirclerc-Savoye, Ge, Thayer, Huang, Kornberg, Royant, Jan, Jan, Weiss and Shu2014; Rodriguez et al., Reference Rodriguez, Tran, Gross, Crisp, Shu, Lin and Tsien2016, Reference Rodriguez, Campbell, Lin, Lin, Miyawaki, Palmer, Shu, Zhang and Tsien2017). However, despite performing a similar function, fluorescent RNA aptamers must function under a different set of principles than FAPs. The hydrophobic core of a protein, marked by a low dielectric constant, is vastly different from the large, negative, electrostatic field generated by RNA (Misra and Draper, Reference Misra and Draper2002; Draper, Reference Draper2004). Inherent differences in polymer makeup such as this may result in new and interesting fluorescence activation mechanisms for RNA.
Financial support
This work was funded by the intramural program of the National Heart, Lung, and Blood Institute, NIH.