




Introduction
Long-term care (LTC) is a crucial part of Canada’s healthcare system, and its importance is poised to grow. Canada’s population is aging and life expectancy into old age continues to increase (Hallman, Reference Hallman2022). With older age comes increased medical complexity. Over 80% of Canadians aged 85 years and over self-report at least one chronic disease or condition, and almost half experience multimorbidity of two or more conditions, but mortality rates with chronic conditions have decreased (Public Health Agency of Canada, 2020). This means that there are more years lived with medical complexity, and this is reflected in LTC use: almost one in three Canadians over the age of 85 lives in a communal living space, with many ending up in LTC as their final place of residence before death (Hallman, Reference Hallman2022; Hirdes et al., Reference Hirdes, Mitchell, Maxwell and White2011). Residents in Canadian LTC homes have high rates of co-morbidity and symptom complexity, including 75–80% of residents who have some form of age-related dementia (Estabrooks et al., Reference Estabrooks, Hoben, Poss, Chamberlain, Thompson, Silvius and Norton2015a; Ng et al., Reference Ng, Lane, Tanuseputro, Mojaverian, Talarico, Wodchis, Bronskill and Hsu2020). The number of Canadians aged 85 and over could reach 2.7 million by 2046, nearly triple the amount in 2024 (Hallman, Reference Hallman2022; Statistics Canada, 2025a), and the number of Canadians with complex cases and need for LTC is expected to rise as well.
Most of the direct care within LTC homes is provided by care aides (Arain et al., Reference Arain, Deutschlander and Charland2017; Berta et al., Reference Berta, Laporte, Deber, Baumann and Gamble2013; Statistics Canada, 2025b); however, this staff group remains largely unregulated in most provinces. The policy framework guiding LTC varies on a per-province basis, which means that the care aide role can vary significantly across provinces; there are presently no national definitions or standards for care aide responsibilities or education (Arain et al., Reference Arain, Deutschlander and Charland2017; Estabrooks et al., Reference Estabrooks, Armstrong, Bourbonnais, Donner, Flood, Keefe, Pringle, Silvius, Straus, Wolfson, McNeil, Black, Dupuis-Blanchard and Graham2024, Reference Estabrooks, Squires, Carleton, Cummings and Norton2015b). Care aides often find themselves working outside of their training or typical expectations when demand arises (Berta et al., Reference Berta, Laporte, Deber, Baumann and Gamble2013; Janes et al., Reference Janes, Sidani, Cott and Rappolt2008), but might not have access to further opportunities for job growth like formal education, training, and vertical movement within an organization (Andersen, Reference Andersen2009; Arain et al., Reference Arain, Deutschlander and Charland2017; Berta et al., Reference Berta, Laporte, Deber, Baumann and Gamble2013). Care aides are frequently found to be stressed, burnt out, and overwhelmed (Booi et al., Reference Booi, Sixsmith, Chaudhury, O’Connor, Young and Sixsmith2021; Costello et al., Reference Costello, Walsh, Cooper and Livingston2019; Duan et al., Reference Duan, Smith, DeGraves, Angel, Wang, Saeidzadeh, Lanius and Estabrooks2025). Nevertheless, they maintain a deep sense of commitment for their role and the people they work with, which seems to help them find resilience in the face of challenges (Song et al., Reference Song, Keefe, Squires, deGraves, Duan, Cummings, Doupe, Hoben, Duynisveld, Norton, Poss and Estabrooks2024). Research into LTC staff can help us understand the impact of policy interventions, link staff indicators to quality-of-care indicators, and address the evolving needs faced at the forefront of care (Cranley et al., Reference Cranley, Hoben, Yeung, Estabrooks, Norton and Wagg2018; Estabrooks et al., Reference Estabrooks, Squires, Cummings, Teare and Norton2009).
There has been some effort to shed light on Canada’s unregulated care aides. The Government of Ontario (2020) found provincial care aides to be mostly women between the age of 35–54 years, with visible minorities comprising approximately 41% of this workforce. Furthermore, Estabrooks et al. (Reference Estabrooks, Squires, Carleton, Cummings and Norton2015b) reported a broad profile on care aides in Western Canada as part of the Translating Research in Elder Care (TREC) project. Across Alberta, Manitoba, and Saskatchewan, they found care aides in urban areas were mostly women around the age of 40–49 years; only 40.2% were born in Canada and just over half spoke English as their first language. While burnout scales of emotional exhaustion and cynicism were generally high, so were professional efficacy and job satisfaction. A follow-up paper that additionally sampled British Columbia in place of Saskatchewan found similar trends (Chamberlain et al., Reference Chamberlain, Hoben, Squires, Cummings, Norton and Estabrooks2019). However, almost all of these demographic, wellbeing, and quality of work-life findings differed significantly between provinces at both time points. The generalizability of these findings across provinces has not been established, highlighting the need for regional research into the care aide population.
This need is especially true in Atlantic Canada. The Atlantic provinces have some of the highest current proportions and future projections of adults over the age of 65 and 85 nationwide (Hallman, Reference Hallman2022; Statistics Canada, 2022); already, this region is experiencing high rates of dementia among its older population (Alzheimer Society of Canada, 2022). A 2024 study on Nova Scotian LTC staff found the majority of care aides were born in Canada and speak English as a first language (Keefe et al., Reference Keefe, Duynisveld, Stevens and Estabrooks2024). The demographics of care workers in the region are expected to evolve, however, and we are already seeing evidence of this shift in the form of new immigrant pathways, such as the Atlantic Immigration Program, which provides jobs to skilled migrant workers including those with healthcare experience. These programs are typically tied to closed work permits from specific employers, with some Atlantic LTC organizations making use of this recruitment pool (Government of Canada, 2025; Hounsell, Reference Hounsell2023).
Keefe et al. (Reference Keefe, Duynisveld, Stevens and Estabrooks2024) also noted that, while efficacy and job satisfaction were high among care aides in Nova Scotia, mental health and some burnout sub-scales showed more concerning scores than those in Western Canada. The Atlantic LTC workforce seems to differ from reports elsewhere in the country and it is this recognition that fueled the creation of the Atlantic Research Collaboration on Long-term Care (ARC LTC), a research program that partnered with TREC to increase research capacity on LTC within Atlantic Canada (Keefe et al., Reference Keefe, Mercer, O’Brien and Daye2025b). The 2023–2024 wave of data collection marks the first time that in-depth data has been collected on the Atlantic Canadian LTC workforce. With these data, we address two research questions: who makes up Atlantic Canada’s LTC care aide workforce? How do demographics, health and wellbeing indicators among this staffing group vary among Atlantic provinces, if at all?
Methods
Data on care aides
The cross-sectional data we use were collected between November 2023 and May 2024 as part of the ARC LTC research program. Our sample included 53 LTC homes from New Brunswick (NB), Newfoundland and Labrador (NL), Nova Scotia (NS), and Prince Edward Island (PEI). Homes were stratified based on size (bed count), owner-operator model, region, and language, then randomly sampled within each province with oversampling in PEI and NL. In addition to facility-level data gathered in each of the 53 homes, the research team collected 2,305 staff surveys of which 1,338 were from care aides (Keefe et al., Reference Keefe, McCloskey, Hodgins, McArthur, MacKenzie, Weeks and Estabrooks2025a).
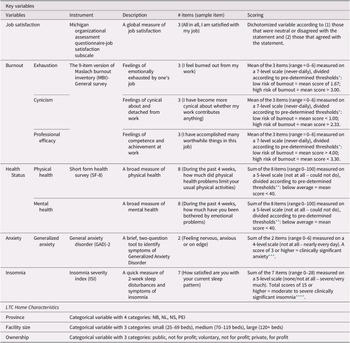
In this paper, we consider the demographics, family status, education, work experience, job satisfaction, intention to leave, and overall health and wellbeing of care aides working in the LTC sector in Atlantic Canada. For the health and wellbeing variables in particular, we draw from an extensive series of validated scales, which were used with permission from the developers. These scales are described further in Table 1 and in our Supplementary File.
Health and wellbeing variables
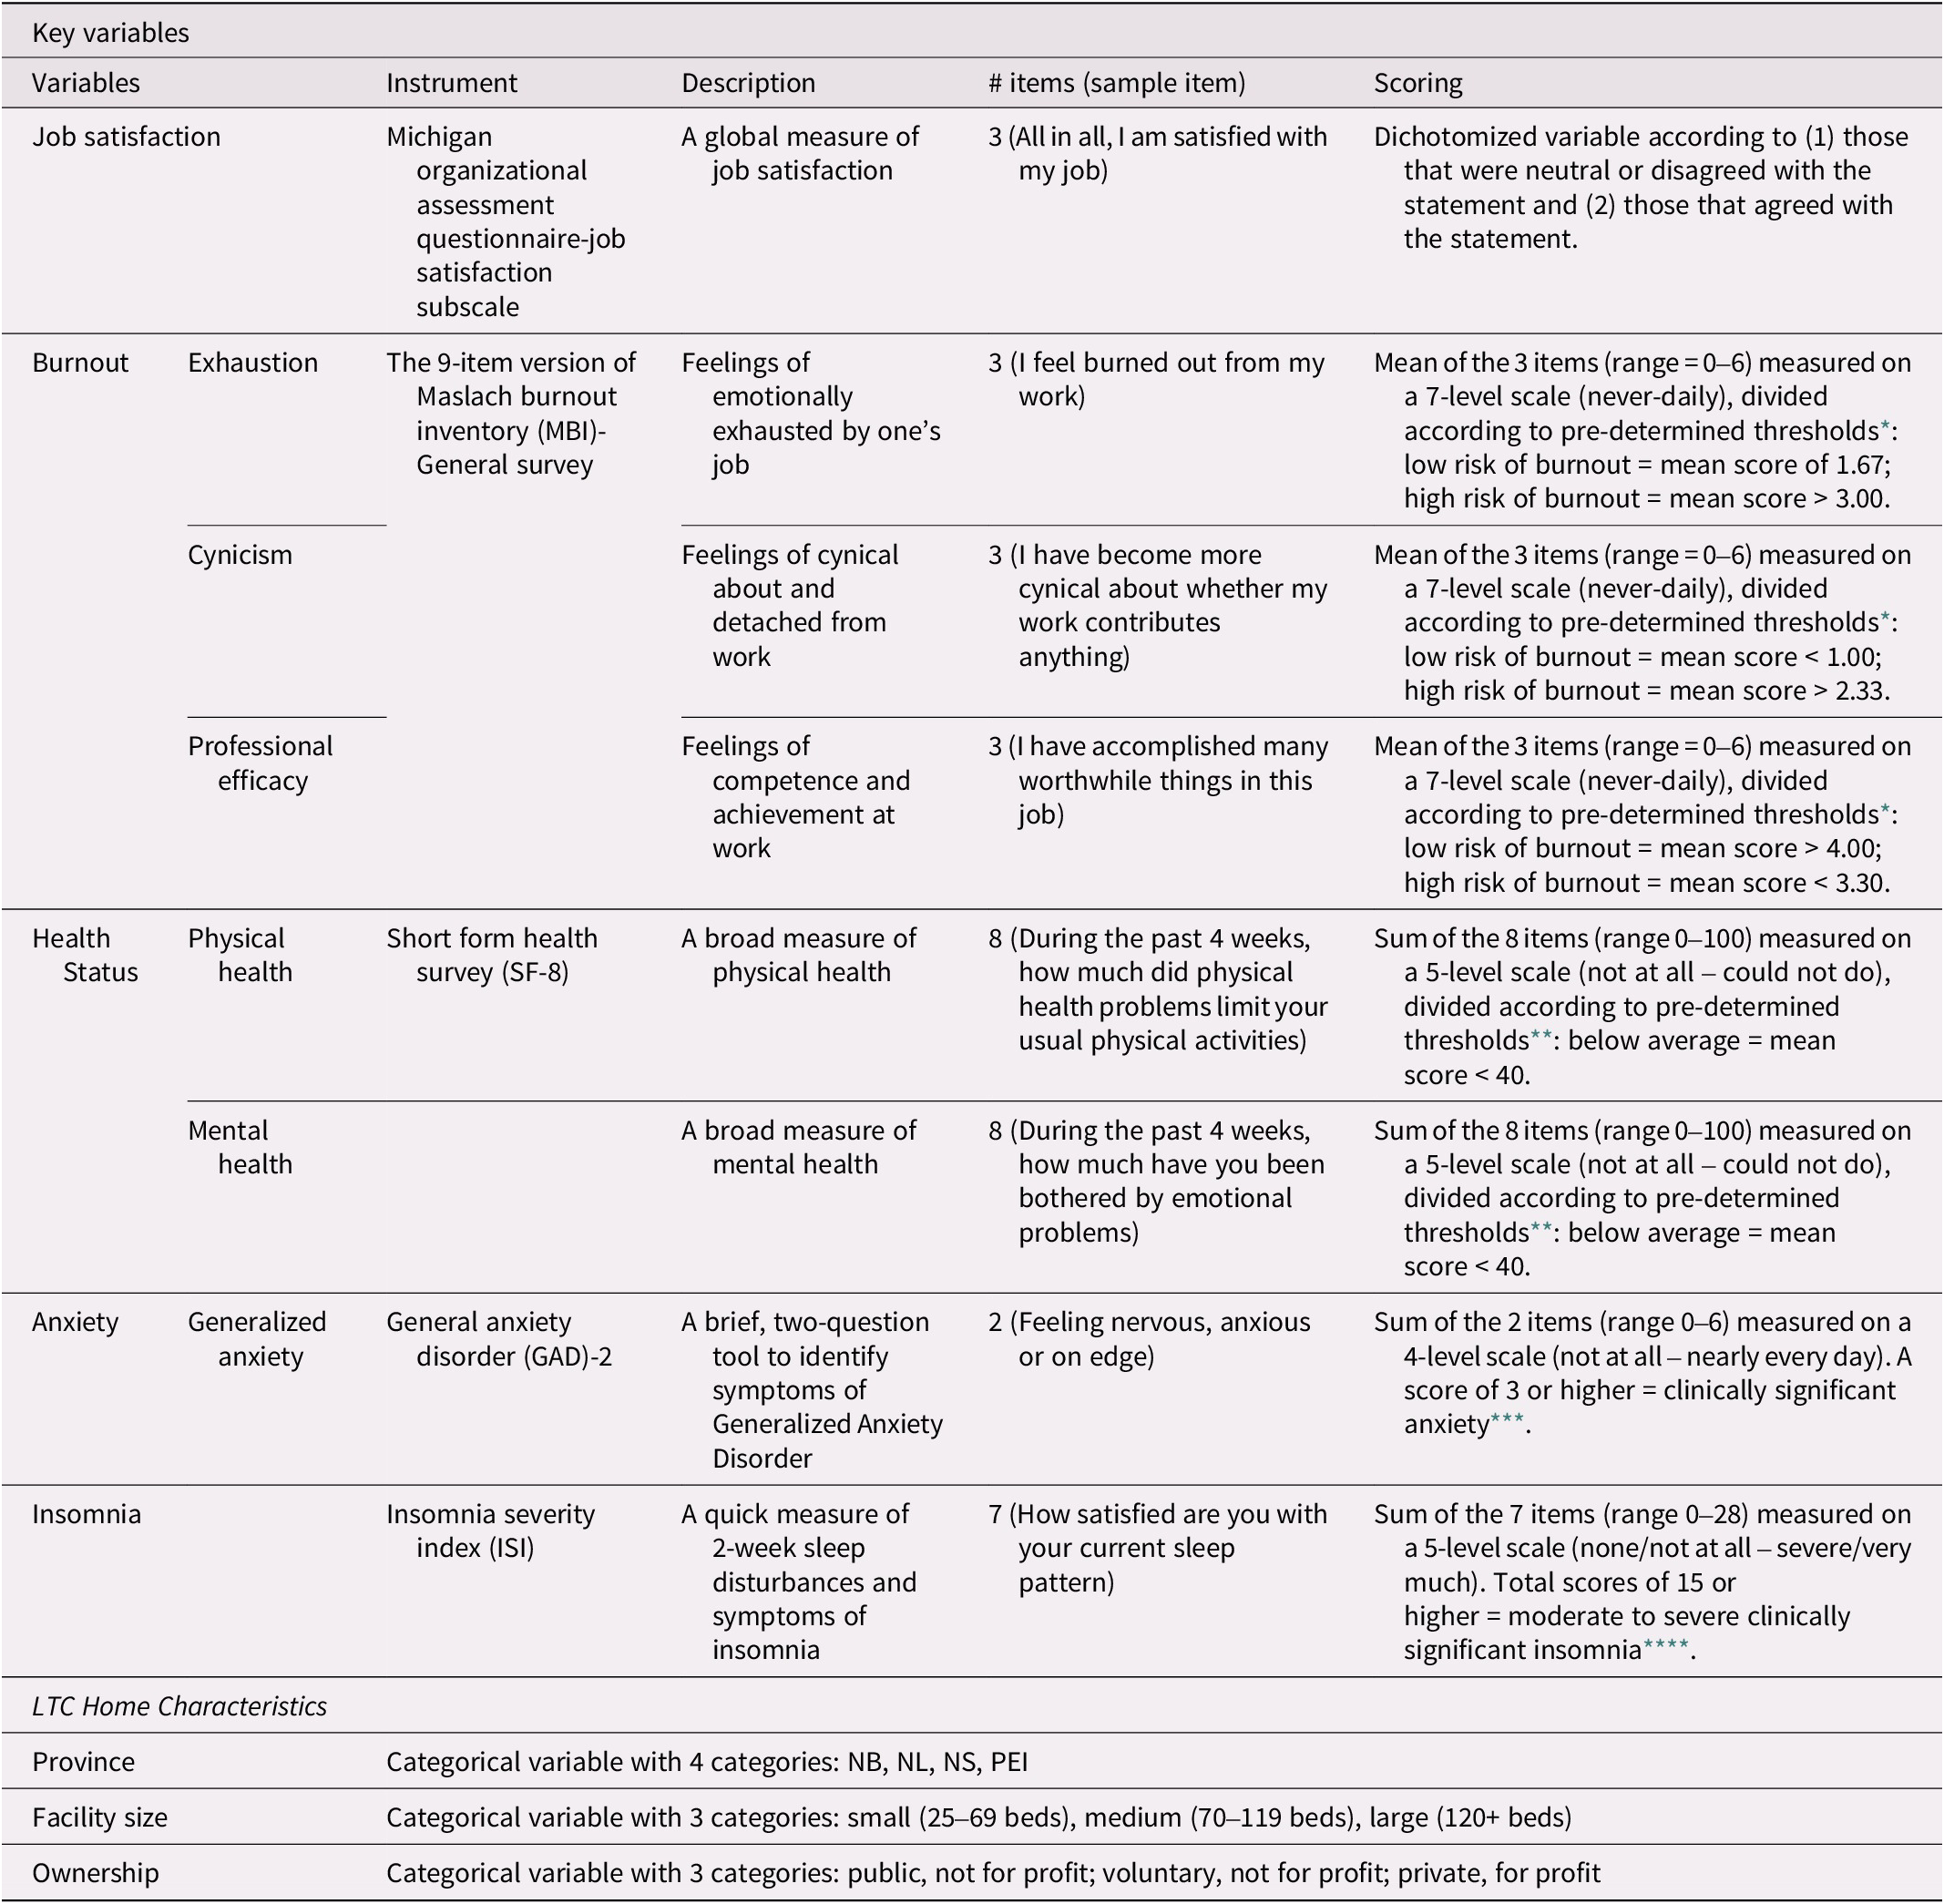
Table 1. Long description
The table is organized into six columns: Variables, Instrument, Description, Number of items (sample item), and Scoring.
* Job satisfaction: Measured by the Michigan organizational assessment questionnaire-job satisfaction subscale. It uses 3 items and is dichotomized into neutral/disagree or agree.
* Burnout: Measured by the 9-item M B I-General survey across three dimensions:
- Exhaustion: 3 items, high risk if mean score is greater than 3.00.
- Cynicism: 3 items, high risk if mean score is greater than 2.33.
- Professional efficacy: 3 items, high risk if mean score is less than 3.30.
* Health Status: Measured by the S F-8 survey:
- Physical health: 8 items, below average if mean score is less than 40.
- Mental health: 8 items, below average if mean score is less than 40.
* Anxiety: Measured by the G A D-2 tool with 2 items. A score of 3 or higher indicates clinically significant anxiety.
* Insomnia: Measured by the I S I with 7 items. A score of 15 or higher indicates moderate to severe clinically significant insomnia.
The bottom section covers L T C Home Characteristics:
* Province: Categorical (N B, N L, N S, P E I).
* Facility size: Small (25 to 69 beds), medium (70 to 119 beds), or large (120 plus beds).
* Ownership: Public, not for profit; voluntary, not for profit; or private, for profit.
* See Estabrooks et al. (Reference Estabrooks, Hoben, Poss, Chamberlain, Thompson, Silvius and Norton2015a).
** See Ware et al. (Reference Ware, Kosinski, Dewey and Gandek2001).
*** Spitzer et al. (Reference Spitzer, Kroenke, Williams and Löwe2006).
**** See Bastien (Reference Bastien2001).
Stratification measures
In our analysis for this paper, we consider three principal means of stratifying our results. First, we look at province, to consider whether the distinct policy environment at the provincial level may relate to any significant differences in terms of the breakdown of care aide characteristics. Second, we consider the ownership model of the LTC home. Here, we look at three potential models that exist in the region: (a) public, not for profit; (b) private, for profit; and (c) voluntary, not for profit. Finally, we consider the size of the LTC home, comparing small (25–69 beds), medium (70–119 beds) and large LTC homes (120+ beds). The results for the provincial-level stratification are captured in the tables below; results stratified by ownership model and size can be found in our Supplementary File.
Statistical analyses
To analyze our categorical variables, we calculated the frequency of responses in each of the variable categories according to our main stratification measures (province, ownership model, and size), and then ran contingency chi-square tests and post-hoc tests to determine if there were any statistical differences across the categories in our stratification variables. For our continuous variables, we calculated the mean and standard deviation corresponding to the categories within our identified stratification measures and then ran one-way ANOVA and post-hoc tests using Bonferroni correction to determine statistical significance. For ease of interpretation, we have re-coded the majority of the variables used in our analysis as categorical variables. Missing data for all except one variable ranged from 0% to 1.5% of the total sample. The only variable with additional missing cases related to the total number of hours worked in a two-week period; 5.9% of cases were missing from this variable. Pairwise deletion was employed to handle all missing cases.
As a final step in our analysis, we re-ran our health, job satisfaction and intention to leave variables across key demographic differences associated with care aides to determine if there are any significant differences associated with these characteristics. The stratification measures used here are (a) place of birth (Canada/outside of Canada), (b) age (under 40 years/40 years and above), and (c) sex at birth (male/female). Again, we used contingency chi-square tests and post-hoc tests to determine statistical significance.
Results
The results that follow represent the first detailed exploration of the care aide workforce in Atlantic Canada. Importantly, these results provide an initial insight into what this workforce looks like, in terms of demographics, education, work, job satisfaction, intention to leave, and health. As these data are cross-sectional and given that we do not employ inferential statistics in this paper, no inferences of causality can be drawn. However, these results serve as a foundational understanding, upon which more in-depth research can be built.
Demographics of care aides
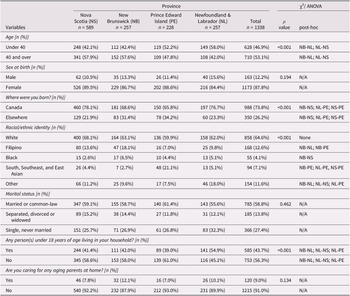
Our response rate was 61.5% of eligible care aides. The majority of care aides were female (87.8%), White (64.6%) and were born in Canada (73.8%). A little over half of care aides were over the age of 40, and they were mostly married or in common-law relationships. A little less than half had children in their household (43.7%) and a minority of care aides were also caring for aging parents (9.0%) (Table 2).
Demographics & family status
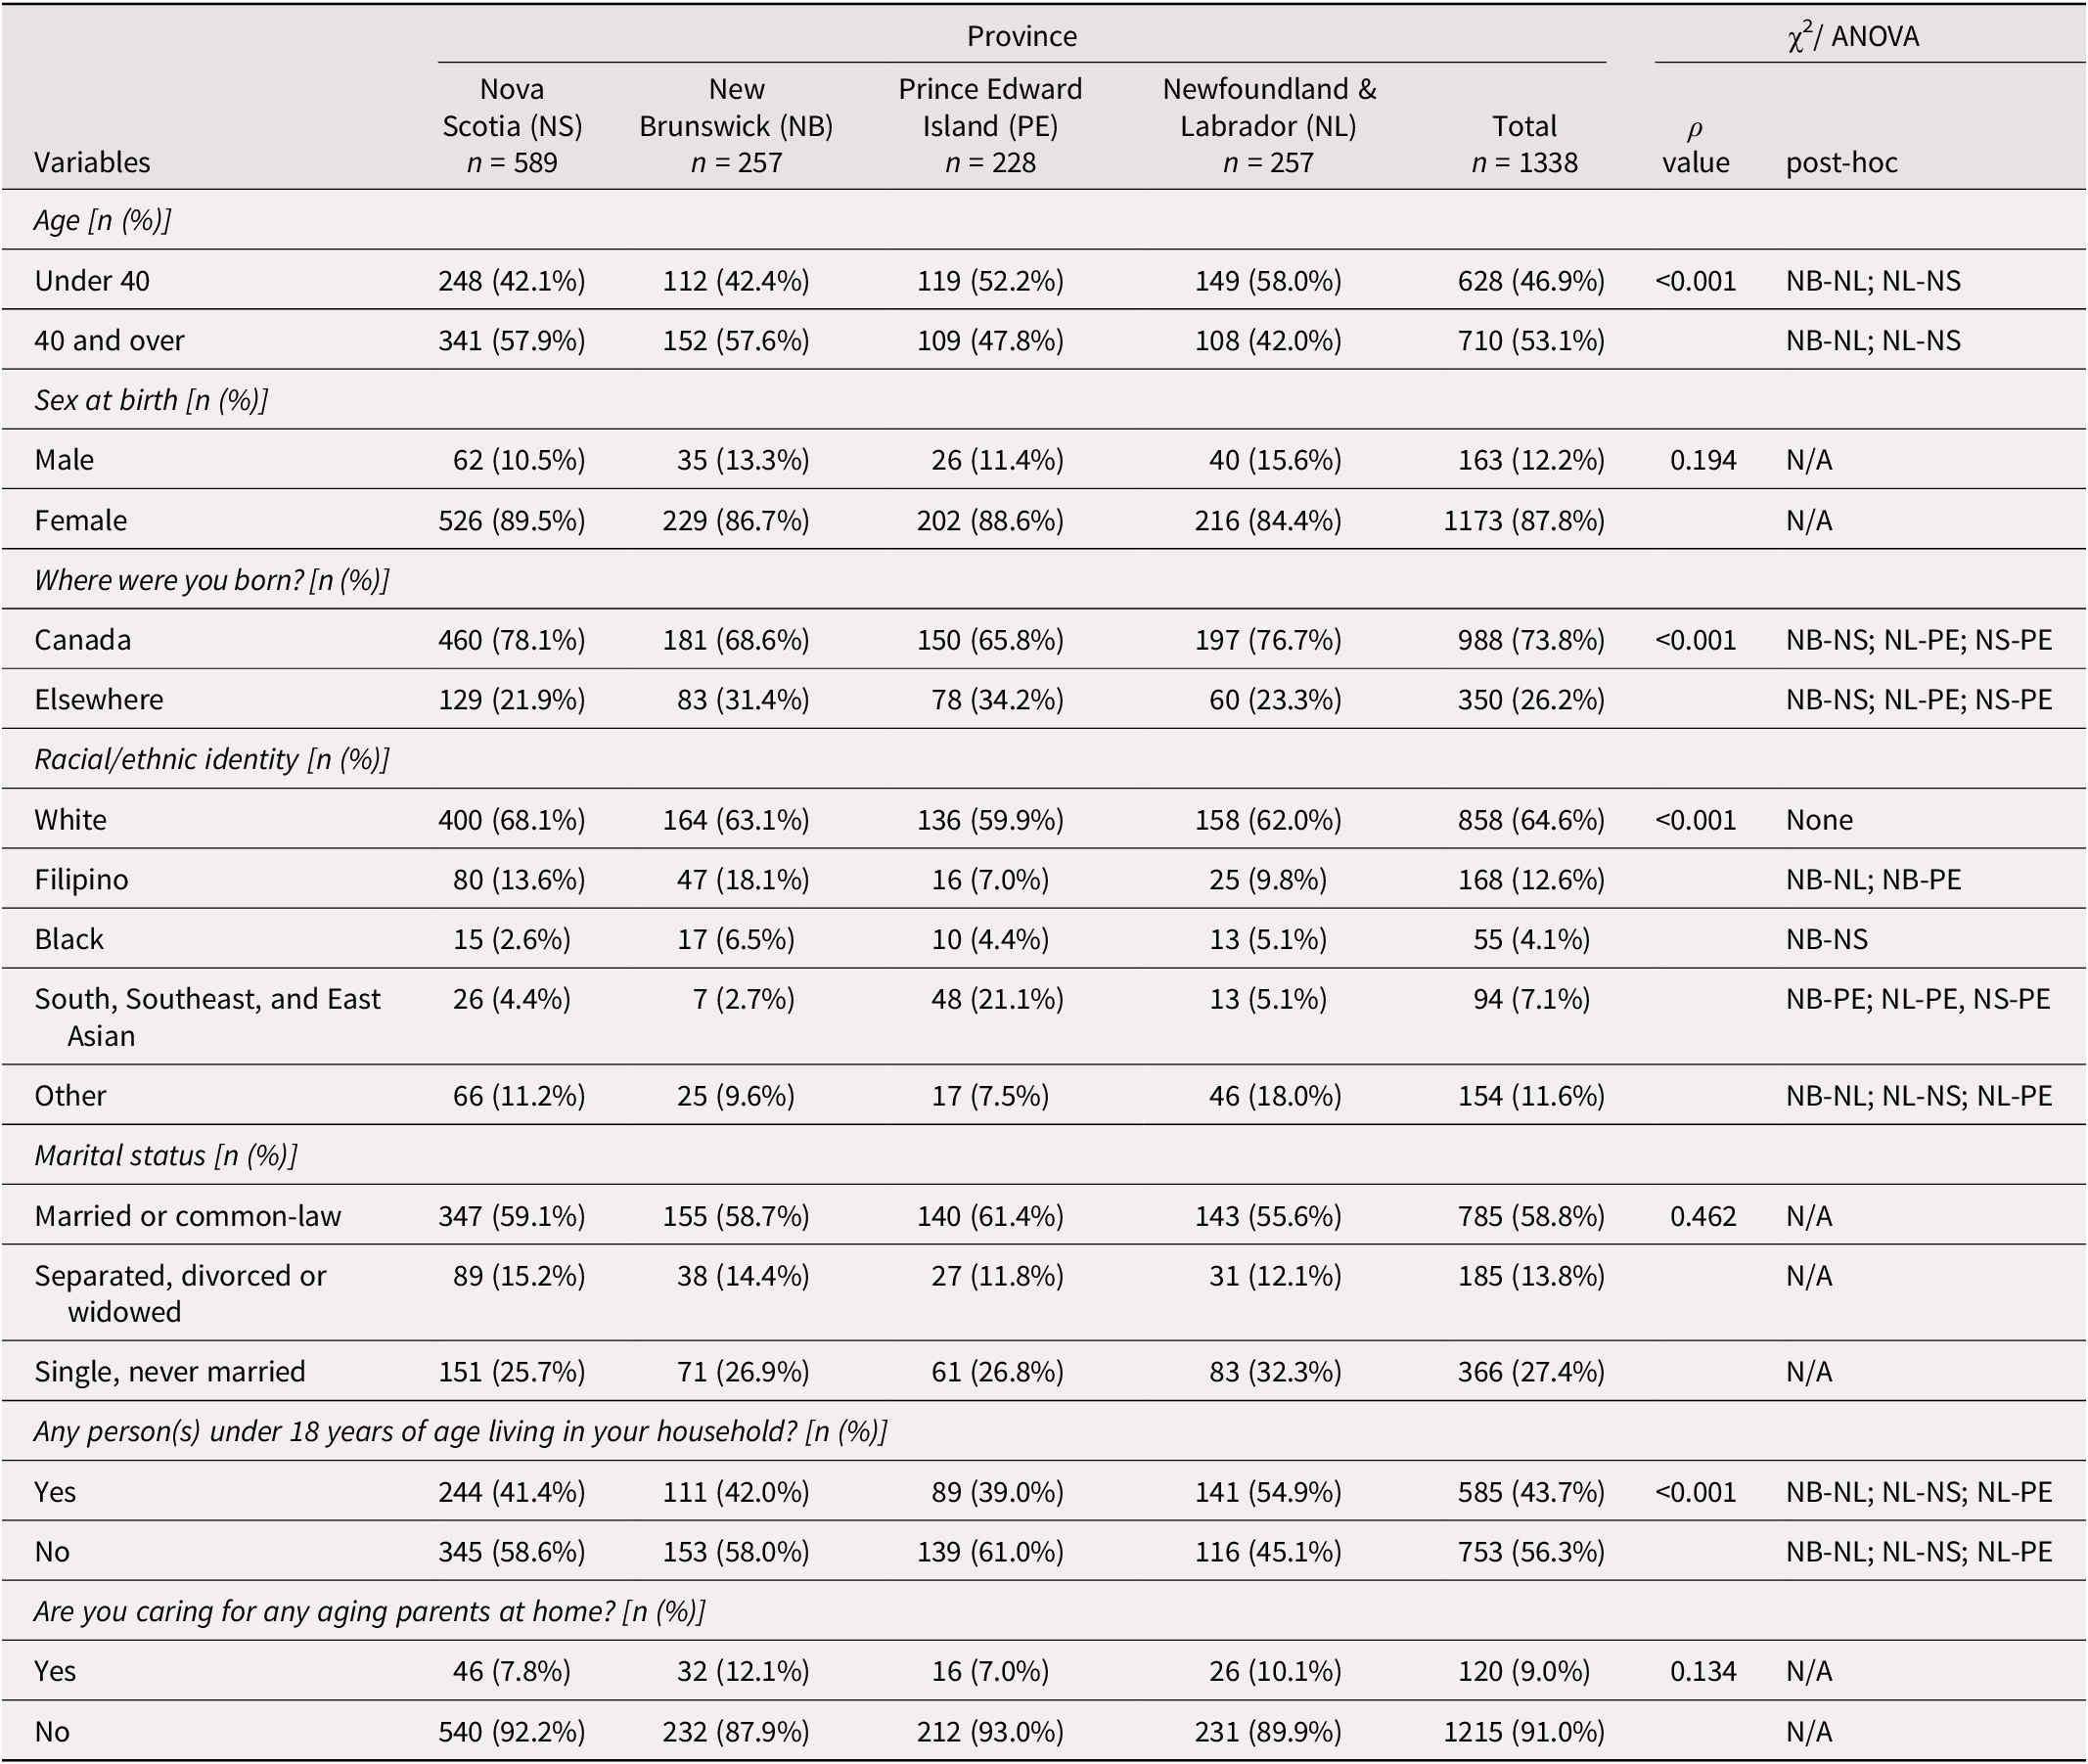
Table 2. Long description
A table titled Demographics and family status. The columns are Variables, Province (subdivided into Nova Scotia N S n equals 589, New Brunswick N B n equals 257, Prince Edward Island P E n equals 228, Newfoundland and Labrador N L n equals 257, and Total n equals 1338), and Chi-square or A N O V A results (subdivided into rho value and post-hoc).
Key data points include:
* Age: 46.9 percent of the total are under 40, while 53.1 percent are 40 and over. p value is less than 0.001.
* Sex at birth: The total sample is 12.2 percent male and 87.8 percent female. p value is 0.194.
* Birthplace: 73.8 percent were born in Canada, and 26.2 percent elsewhere. p value is less than 0.001.
* Racial/ethnic identity: White (64.6 percent), Filipino (12.6 percent), Black (4.1 percent), South, Southeast, and East Asian (7.1 percent), and Other (11.6 percent). p value is less than 0.001.
* Marital status: Married or common-law (58.8 percent), Separated, divorced or widowed (13.8 percent), and Single, never married (27.4 percent). p value is 0.462.
* Caring for children: Yes (43.7 percent), No (56.3 percent). p value is less than 0.001.
* Caring for aging parents: Yes (9.0 percent), No (91.0 percent). p value is 0.134.
Post-hoc results indicate significant differences between specific provinces like N B-N L and N L-N S for age, and various combinations for birthplace and ethnicity.
Used chi-square test for categorical variables and one-way ANOVA for continuous variables.
The post-hoc test was examined using Bonferroni correction for continuous outcomes. The paired province list represents those provinces with differences that are statistically significant (ex: NS-NB = Nova Scotia and New Brunswick have significantly different outcomes for this variable).
We found that PEI has a higher proportion of care aides that were born outside of Canada (34.2%) than the other provinces. Similarly, large homes have a significantly higher number of younger care aides who are non-White (45.6%) and were born outside of Canada (38.5%). Considering ownership model, private homes have the highest proportion of non-White care aides (51.3%) that were born outside of Canada (44.9%). Meanwhile, voluntary not for profit homes have significantly more care aides that are older, female and are either separated, widowed or divorced (Supplementary Tables).
Education and work
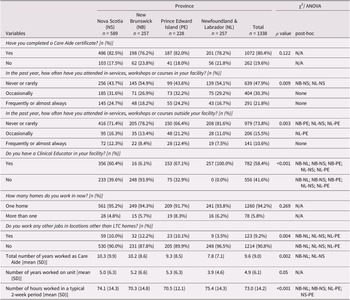
Looking at the education and experience of care aides in the region (Table 3), our data show that care aides have been working in the sector for about 9.6 years, and a large majority (80.4%) hold a care aide certification; however, they are not frequently attending on-the-job training. When the team surveyed the 53 LTC homes, moreover, a little under half (26 homes: 49.1% of total) reported that they have a Clinical Educator within the home. As such, approximately 58.4% of all care aides within our sample had access to a Clinical Educator within their LTC home.
Education & work
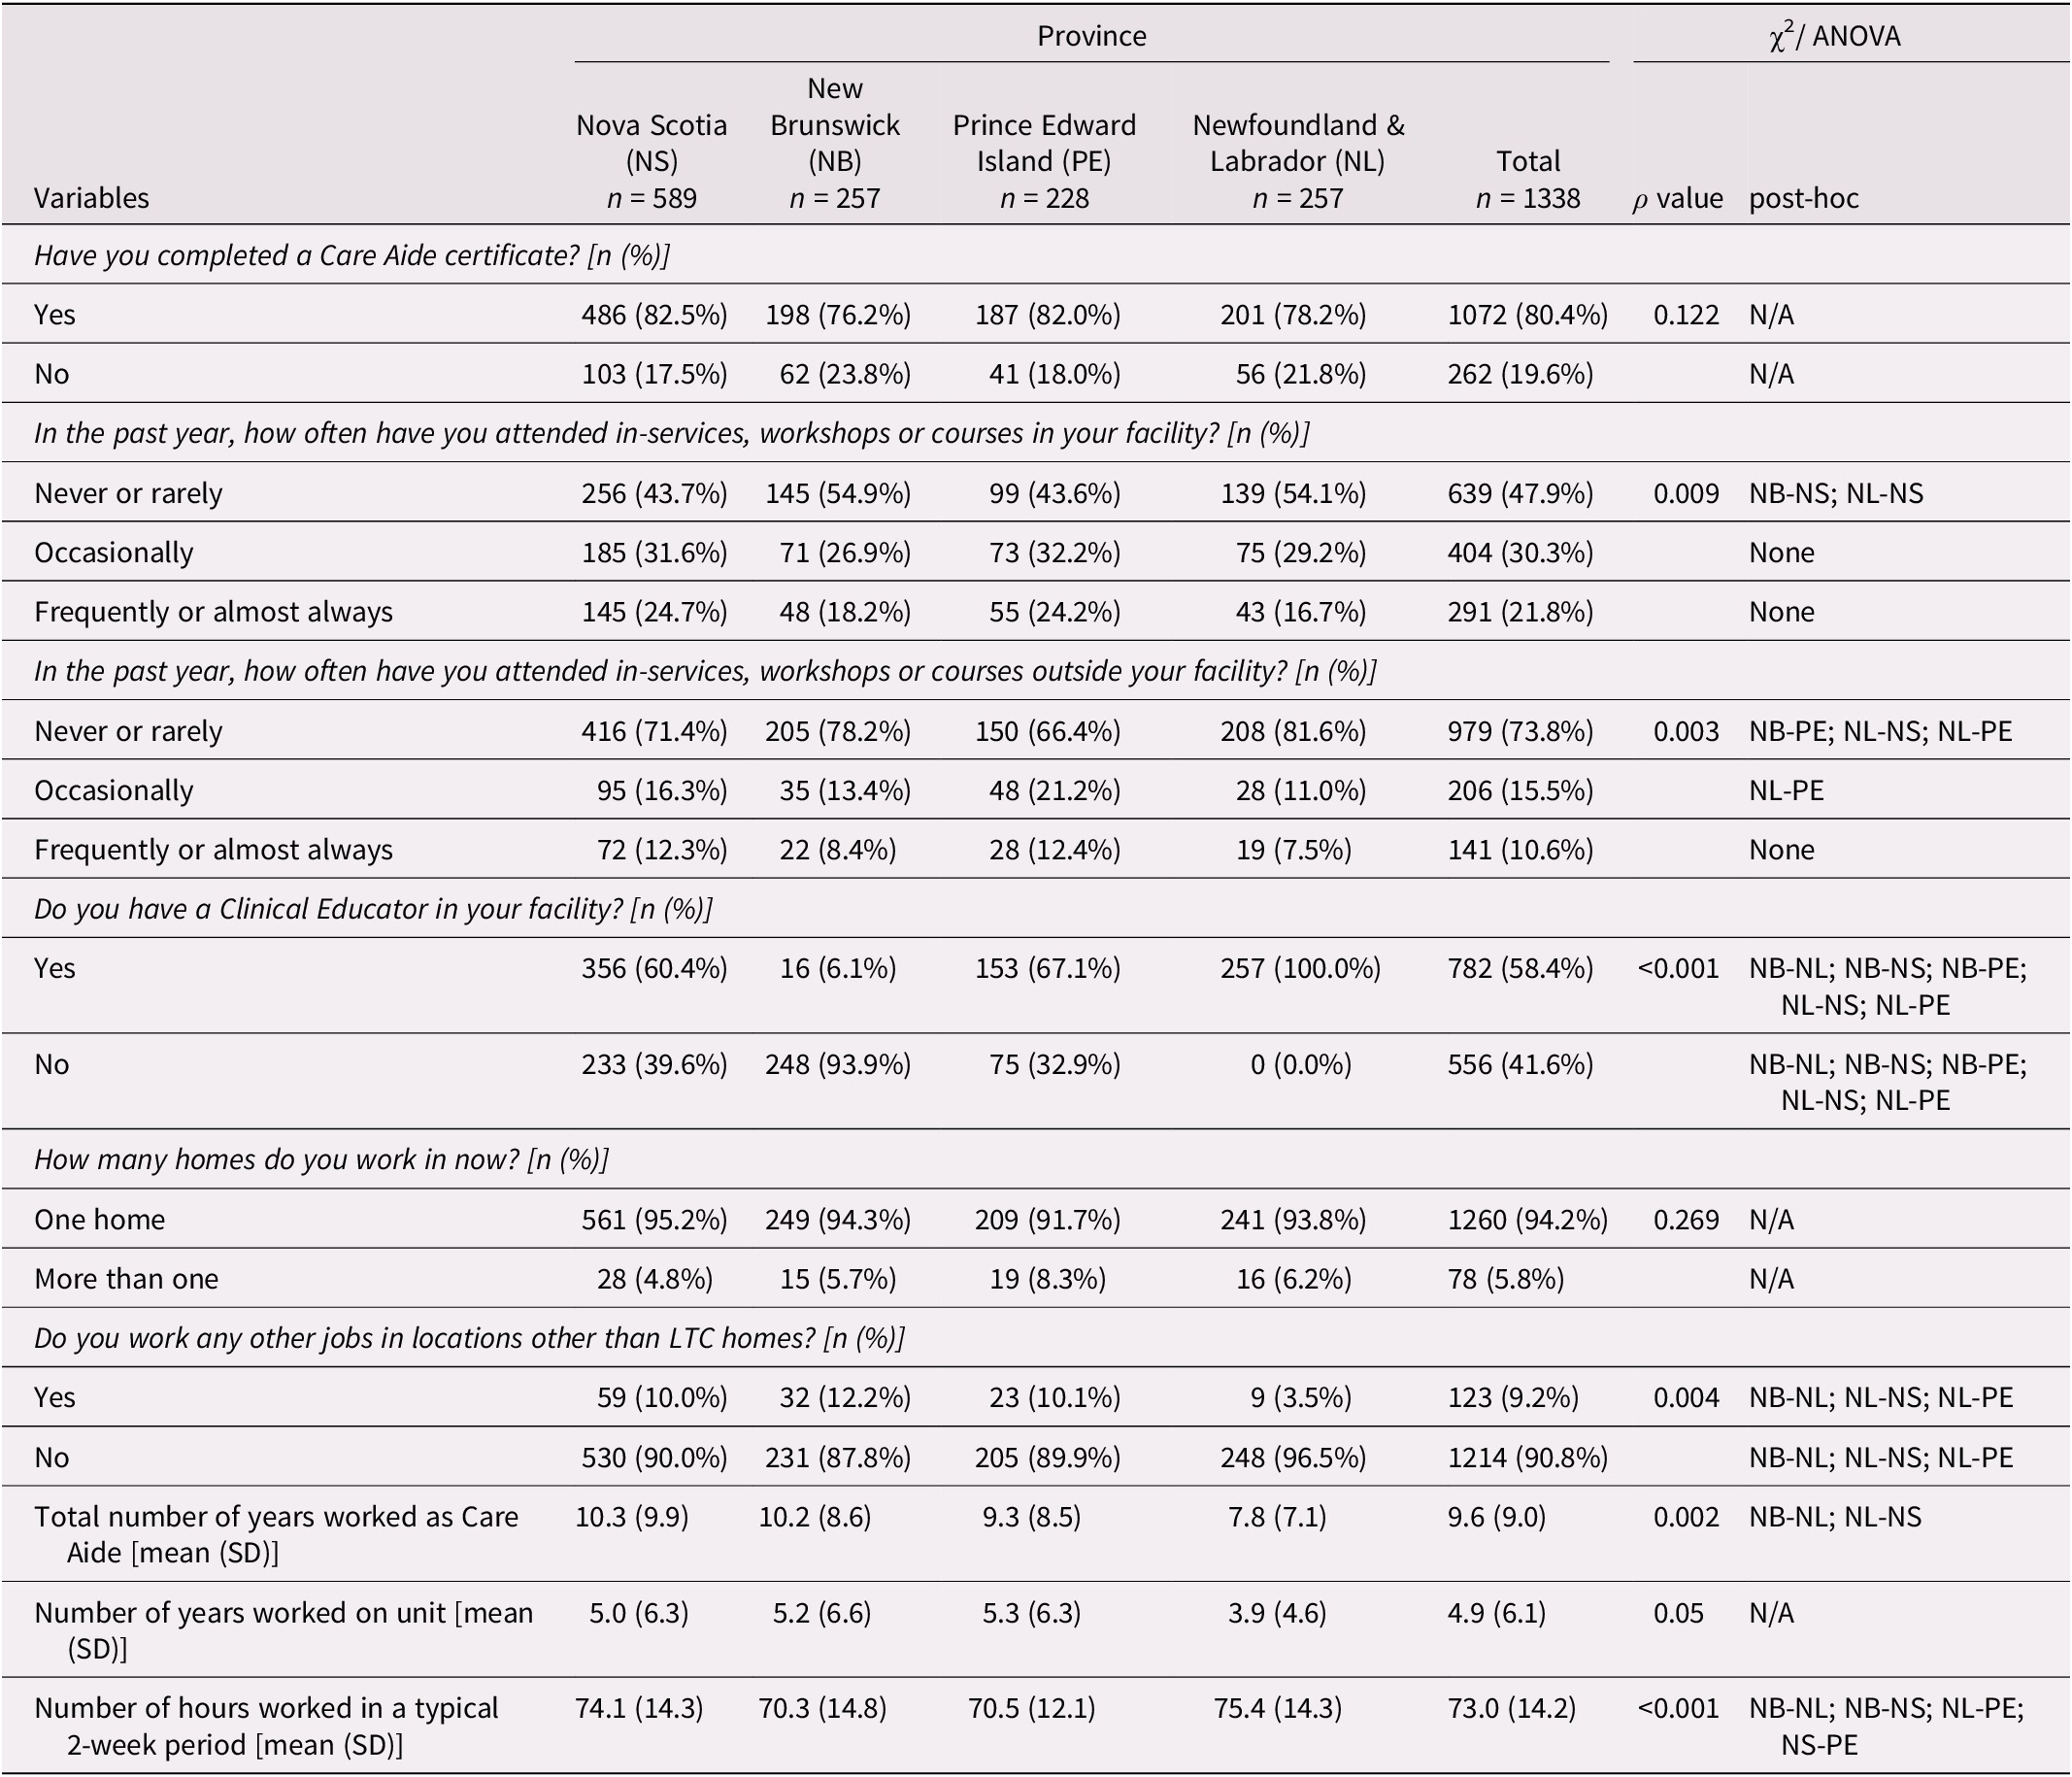
Table 3. Long description
The table presents data for 1338 total participants across Nova Scotia (N S, n = 589), New Brunswick (N B, n = 257), Prince Edward Island (P E, n = 228), and Newfoundland and Labrador (N L, n = 257).
Key variables include:
* Care Aide certificate completion: 80.4 percent total (p = 0.122).
* Frequency of in-facility workshops: 47.9 percent never or rarely, 30.3 percent occasionally, and 21.8 percent frequently (p = 0.009). Significant differences noted for N B-N S and N L-N S.
* Frequency of outside workshops: 73.8 percent never or rarely (p = 0.003).
* Presence of a Clinical Educator: Highly variable by province (p < 0.001). N L reports 100 percent while N B reports only 6.1 percent.
* Number of homes worked: 94.2 percent work in one home (p = 0.269).
* Other jobs outside L T C homes: 9.2 percent total (p = 0.004).
* Total years worked as Care Aide: Mean of 9.6 years (S D 9.0, p = 0.002).
* Years worked on unit: Mean of 4.9 years (S D 6.1, p = 0.05).
* Hours worked in a 2-week period: Mean of 73.0 hours (S D 14.2, p < 0.001).
SD = standard deviation.
Used chi-square test for categorical variables and one-way ANOVA for continuous variables.
The post-hoc test was examined using Bonferroni correction for continuous outcomes. The paired province list represents those provinces with differences that are statistically significant (ex: NS-NB = Nova Scotia and New Brunswick have significantly different outcomes for this variable).
Comparing across provinces and ownership models, we note that a startlingly low proportion of care aides in NB have access to a Clinical Educator in their LTC home: only 6.1%. By comparison, 100% of care aides in NL have access to a Clinical Educator in their LTC home. Meanwhile, private homes have the lowest proportion of care aides that hold a care aide certification (71.0%); however, they also have a higher proportion of care aides that are accessing on-the-job training (Supplementary Tables).
Job satisfaction & intention to leave
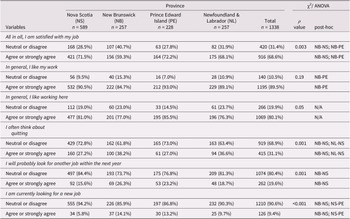
While most care aides (89.5%) report that “in general, they like their work,” a concerning one-third (31.1%) often think about quitting (Table 4).
Job satisfaction & intention to leave
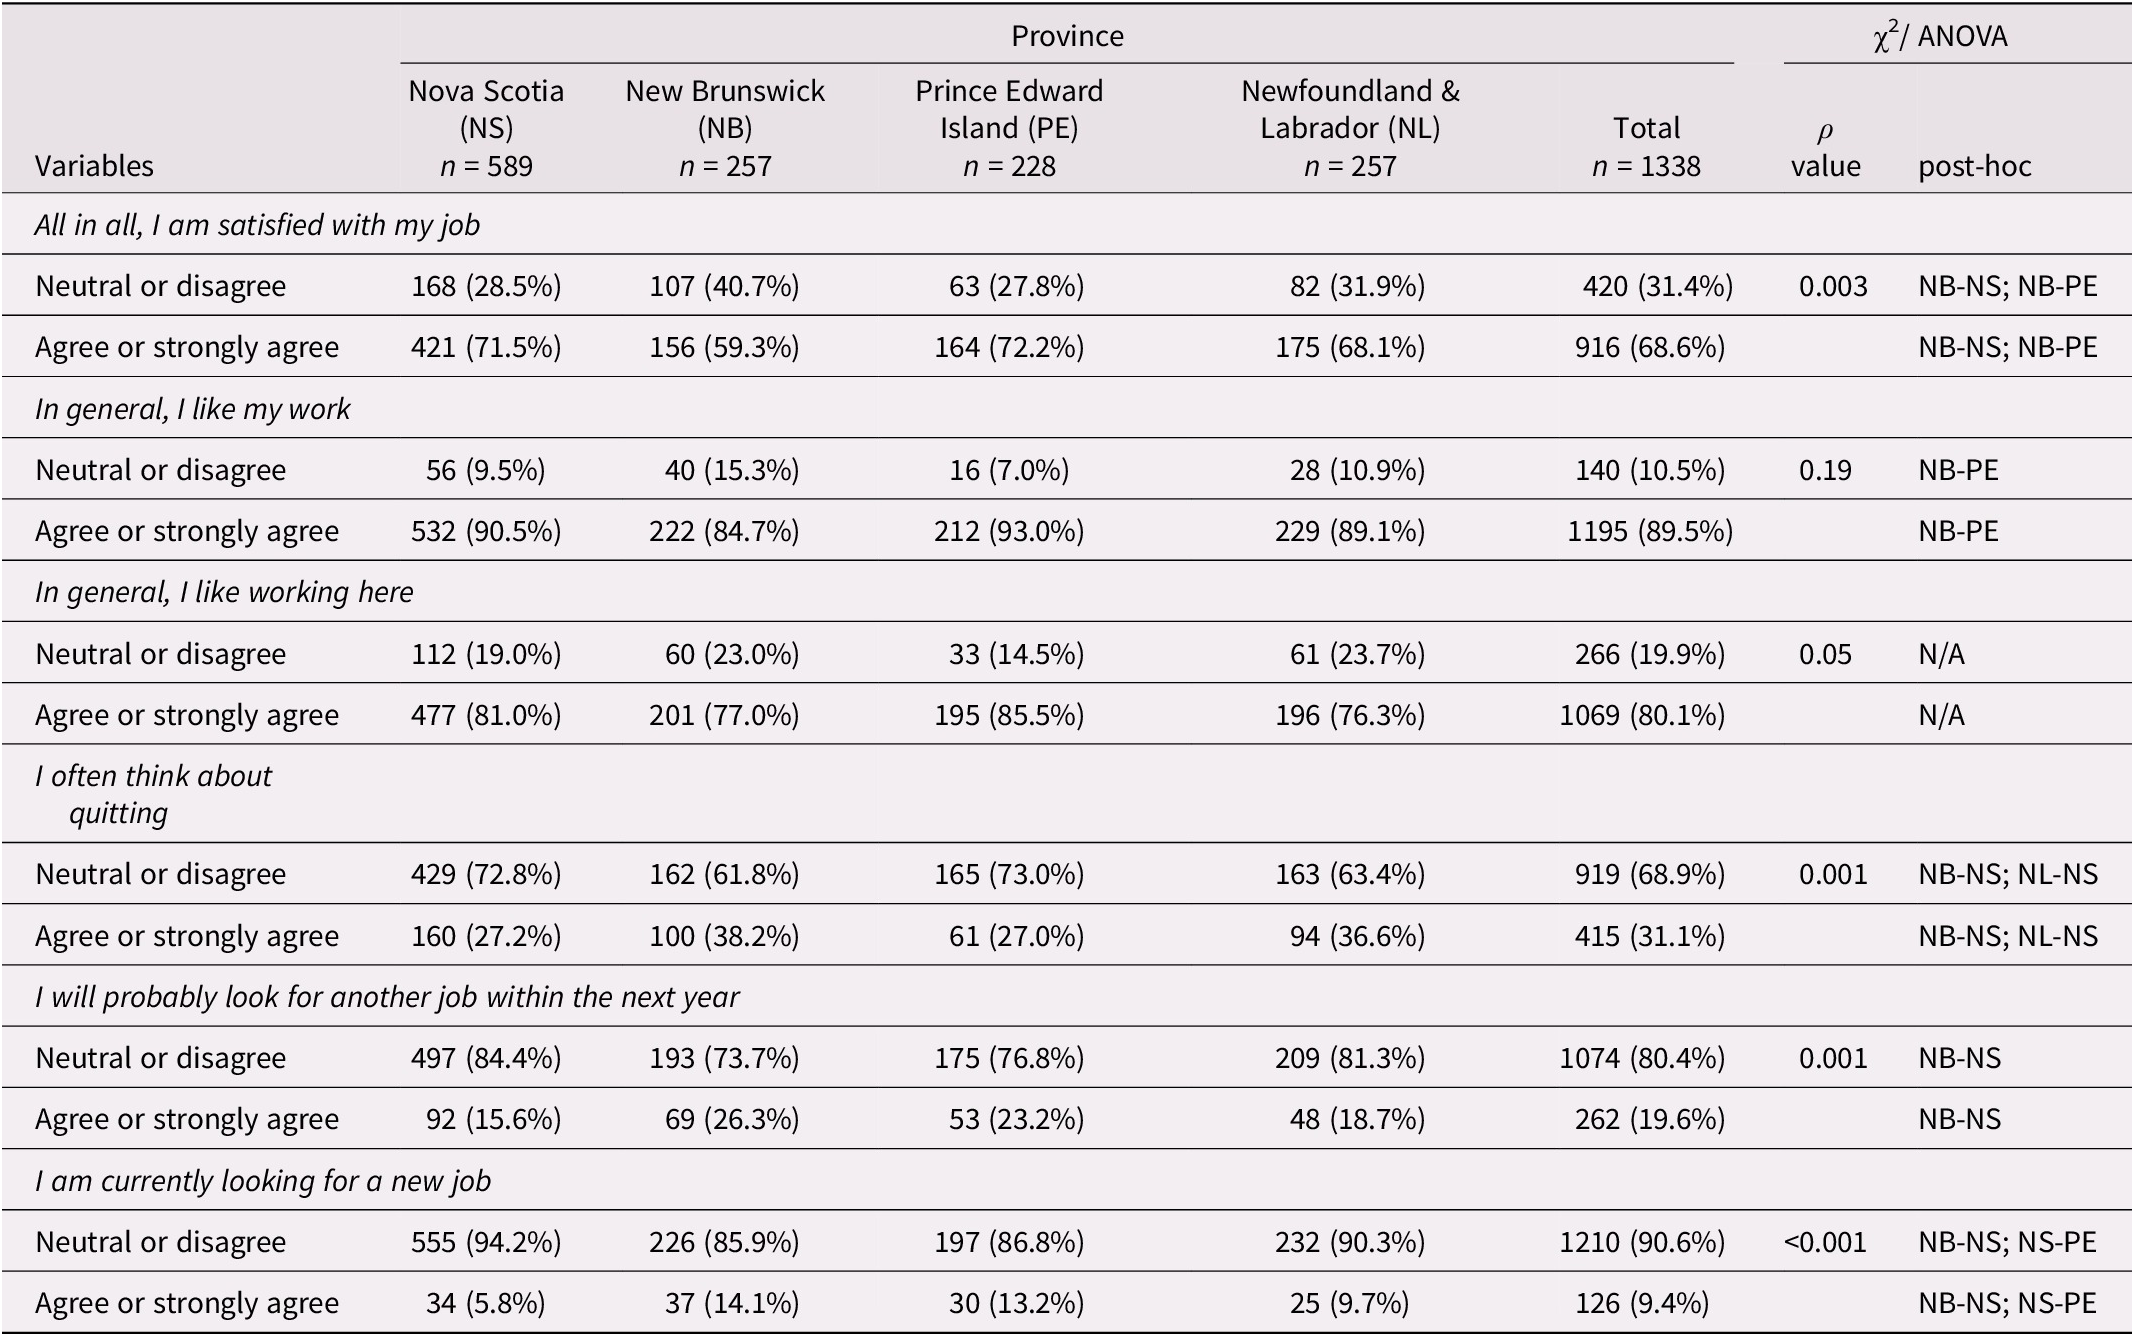
Table 4. Long description
A table with 8 columns: Variables, Nova Scotia (N S, n = 589), New Brunswick (N B, n = 257), Prince Edward Island (P E, n = 228), Newfoundland and Labrador (N L, n = 257), Total (n = 1338), Chi-squared or A N O V A rho value, and post-hoc results.
Key findings by variable:
* All in all, I am satisfied with my job: 68.6 percent total agree or strongly agree. N B has the lowest satisfaction at 59.3 percent. p value 0.003. Post-hoc: N B-N S and N B-P E.
* In general, I like my work: 89.5 percent total agree or strongly agree. p value 0.19. Post-hoc: N B-P E.
* In general, I like working here: 80.1 percent total agree or strongly agree. p value 0.05. Post-hoc: N/A.
* I often think about quitting: 31.1 percent total agree or strongly agree. N B (38.2 percent) and N L (36.6 percent) are higher than N S (27.2 percent). p value 0.001. Post-hoc: N B-N S and N L-N S.
* I will probably look for another job within the next year: 19.6 percent total agree or strongly agree. N B is highest at 26.3 percent. p value 0.001. Post-hoc: N B-N S.
* I am currently looking for a new job: 9.4 percent total agree or strongly agree. N S is lowest at 5.8 percent. p value less than 0.001. Post-hoc: N B-N S and N S-P E.
Used chi-square test for categorical variables and one-way ANOVA for continuous variables.
The post-hoc test was examined using Bonferroni correction for continuous outcomes. The paired province list represents those provinces with differences that are statistically significant (ex: NS-NB = Nova Scotia and New Brunswick have significantly different outcomes for this variable).
New Brunswick has the lowest job satisfaction scores and a higher proportion of care aides that often think about quitting (38.2%) or are looking for another job (14.1%). PEI has the highest job satisfaction scores among the provinces. Turning to ownership models, we find that public not-for-profit homes have the highest proportion of care aides that often think about quitting (37.9%) (Supplementary Tables).
Health
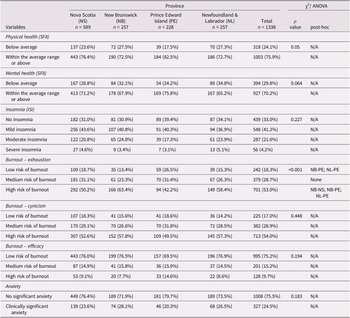
As outlined in Table 1, the metric used to assess the physical and mental health of care aides was a validated scale, which derives a health value between 1 and 100, of which 50 represents the absolute average for the general population; a value of under 40 is considered significantly below average (Ware et al., Reference Ware, Kosinski, Dewey and Gandek2001). Based on our research, we find that, across Atlantic Canada, close to a quarter of all care aides (24.1%) rank significantly below the general population average in terms of their physical health and even more (29.8%) fall significantly below average in terms of mental health. Further, the majority of care aides are at risk of burnout on two of the MBI subscales: exhaustion (53.0%) and cynicism (54.0%); however, they have strong efficacy, with only 9.7% at high risk of burnout associated with this subscale. Finally, a little over a quarter of all care aides (25.8%) suffer from moderate (21.6%) to severe (4.2%) insomnia, and a little under a quarter (24.5%) suffer from clinically significant anxiety (Table 5).
Health
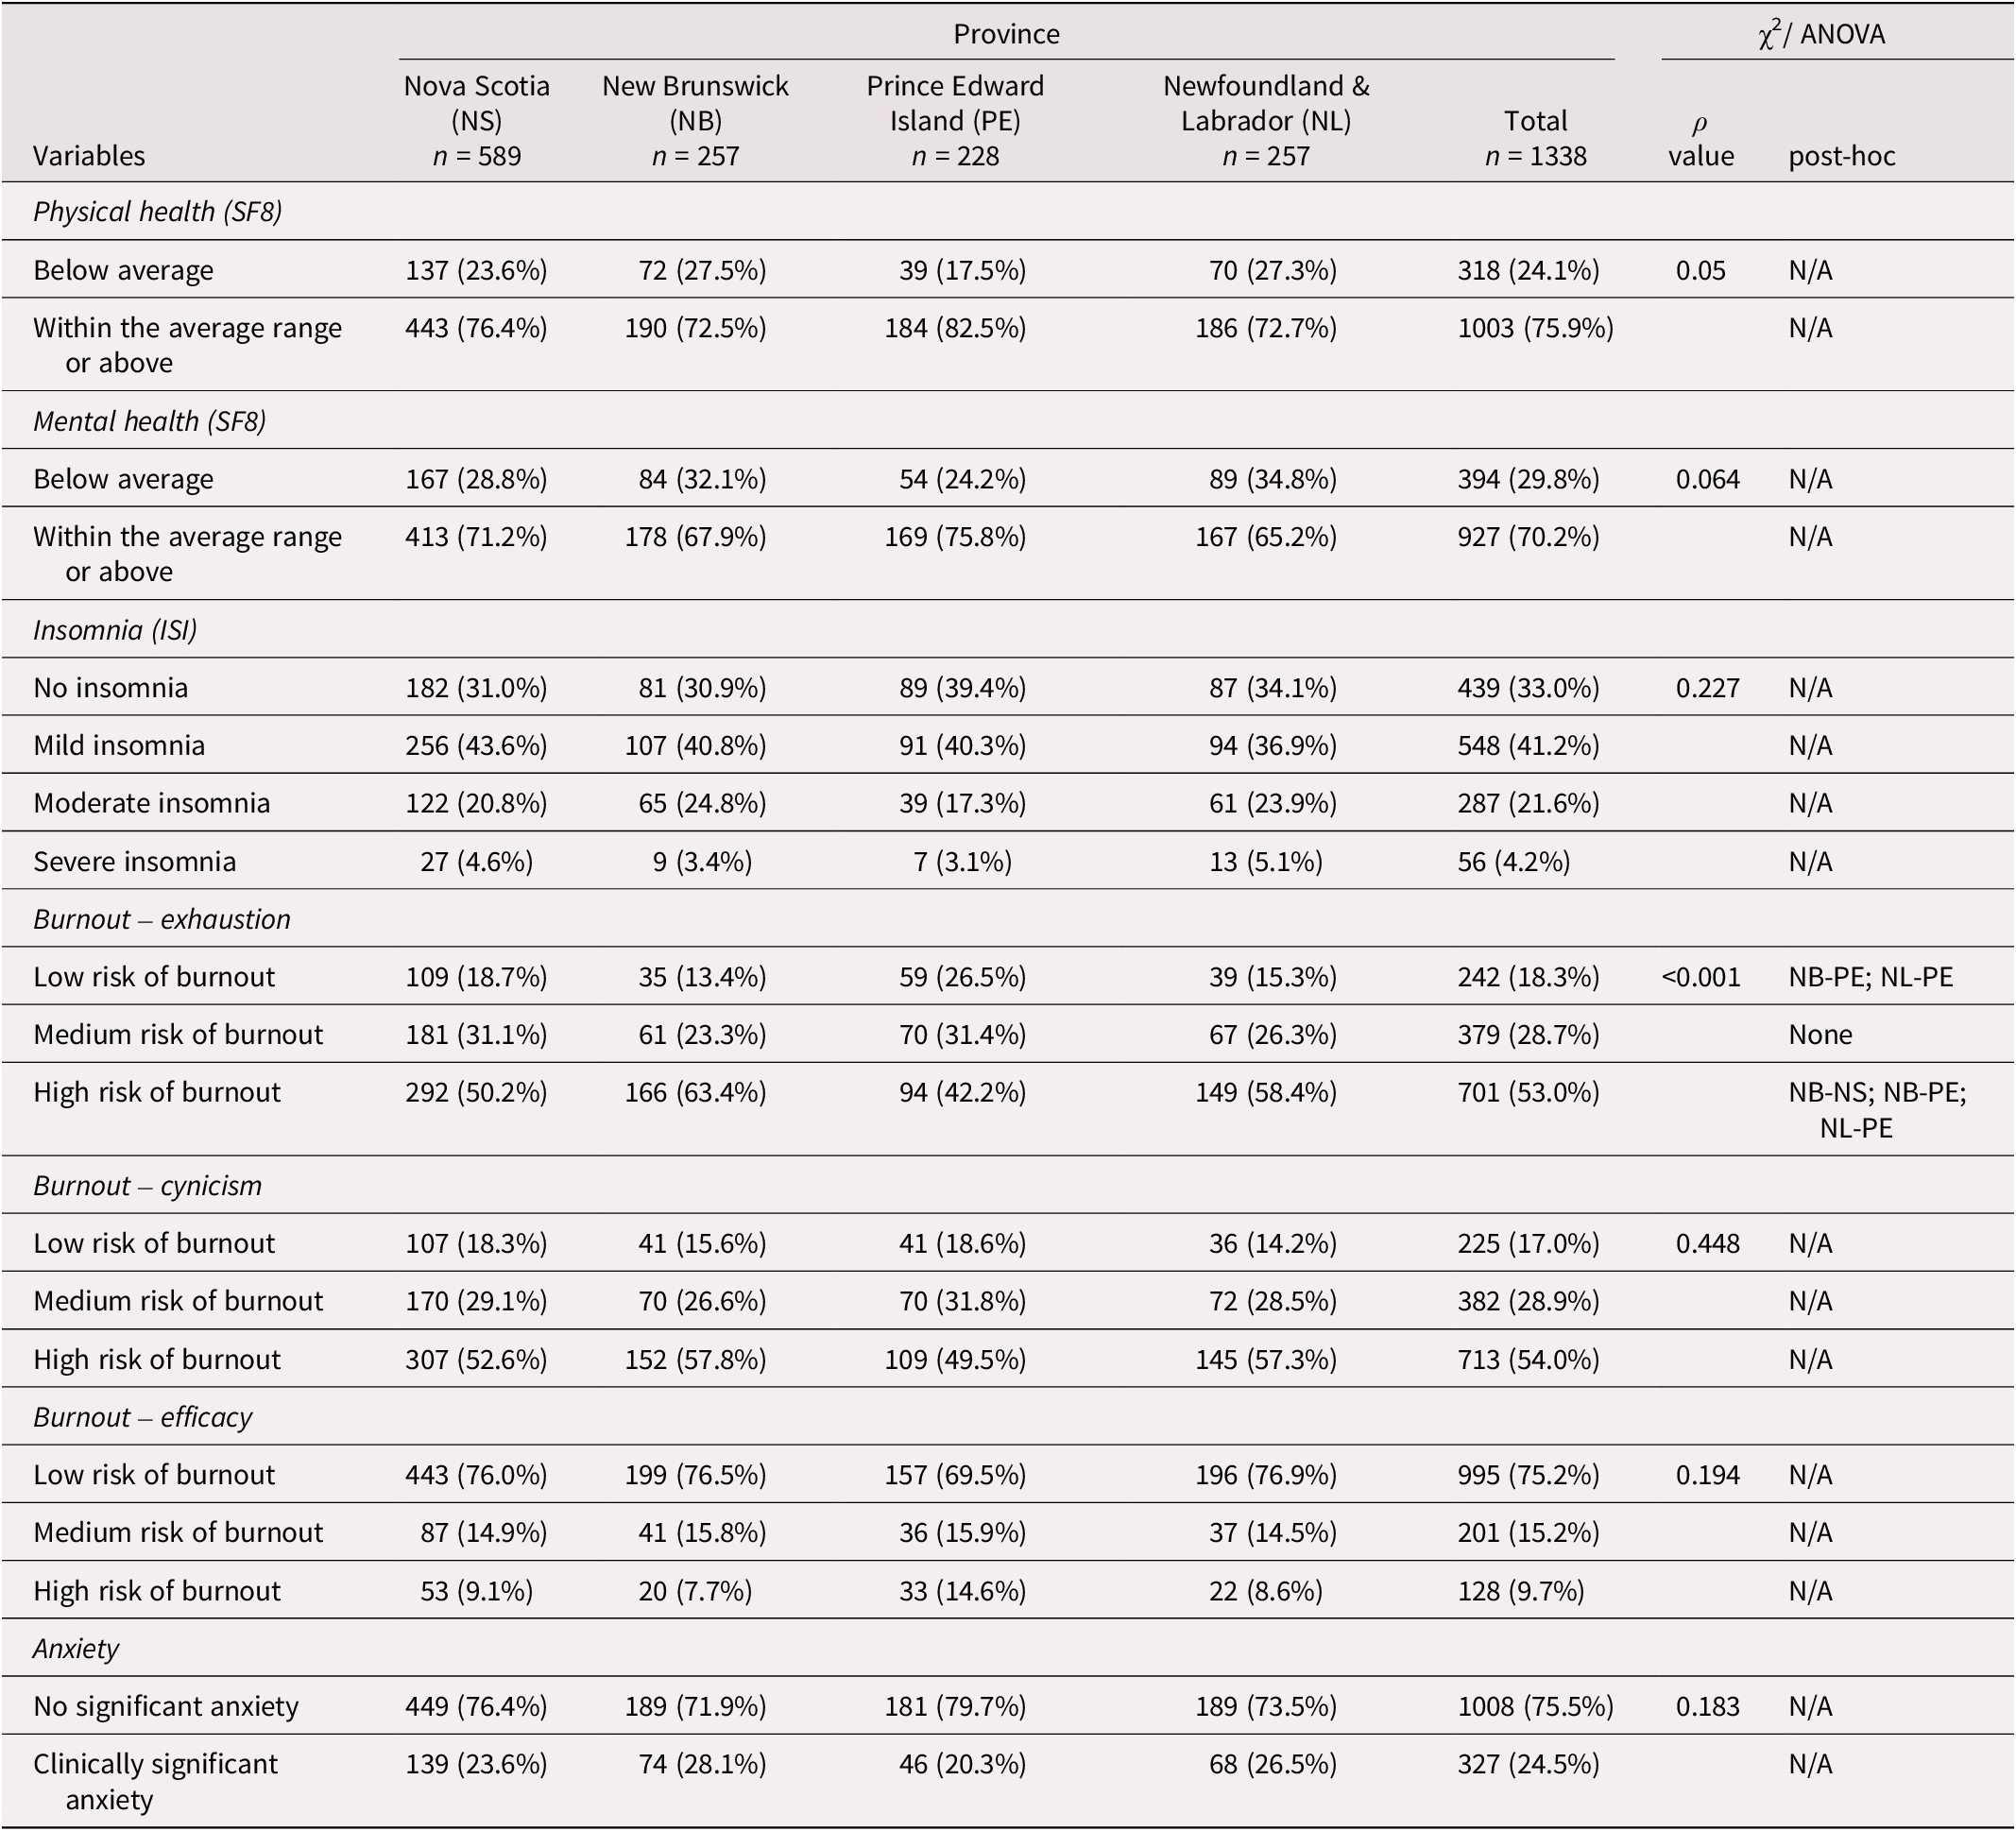
Table 5. Long description
The table presents health data for 1338 total participants across Nova Scotia N = 589, New Brunswick N = 257, Prince Edward Island N = 228, and Newfoundland and Labrador N = 257.
* Physical health S F 8: 24.1 percent of the total sample is below average, with P E having the lowest percentage at 17.5 percent. The p value is 0.05.
* Mental health S F 8: 29.8 percent of the total sample is below average, with N L having the highest percentage at 34.8 percent. The p value is 0.064.
* Insomnia I S I: 33.0 percent report no insomnia, 41.2 percent mild, 21.6 percent moderate, and 4.2 percent severe. The p value is 0.227.
* Burnout - exhaustion: 53.0 percent of the total sample is at high risk. Significant differences exist between N B and P E, and N L and P E. The p value is less than 0.001.
* Burnout - cynicism: 54.0 percent of the total sample is at high risk. The p value is 0.448.
* Burnout - efficacy: 75.2 percent of the total sample is at low risk of burnout. The p value is 0.194.
* Anxiety: 24.5 percent of the total sample reports clinically significant anxiety. The p value is 0.183.
Statistical columns include chi-square or A N O V A rho values and post-hoc results using Bonferroni correction.
Used chi-square test for categorical variables and one-way ANOVA for continuous variables.
The post-hoc test was examined using Bonferroni correction for continuous outcomes. The paired province list represents those provinces with differences that are statistically significant (ex: NS-NB = Nova Scotia and New Brunswick have significantly different outcomes for this variable).
We find that NB has the largest proportion of care aides (63.4%) at high risk of exhaustion-related burnout, and PEI has the lowest proportion (42.2%). Meanwhile, private homes also have the lowest rates of clinically significant anxiety (19.5%) compared to both public (26.3%) and voluntary homes (28.0%) (Supplementary Tables).
A closer look at health, job satisfaction and intention to leave
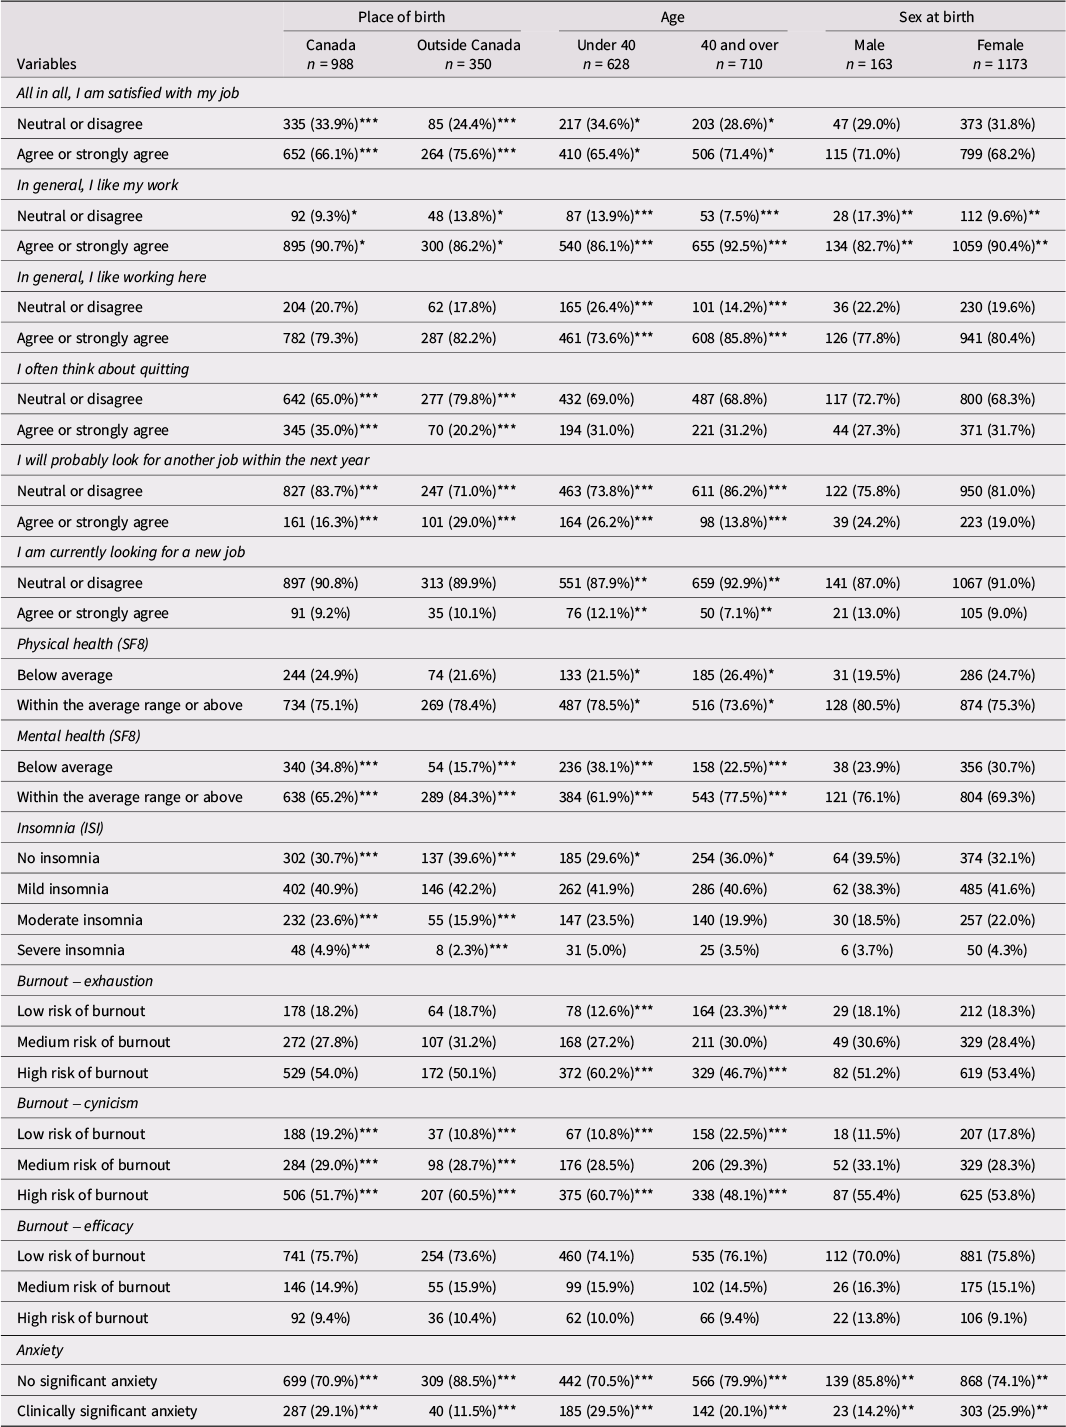
As an additional step in our stratification of results, we looked at the health indicators of care aides disaggregating according to some key demographic differences. In particular, we noted differences according to place of birth, age and gender (Table 6).
Health, job satisfaction and intention to leave across key demographic variables
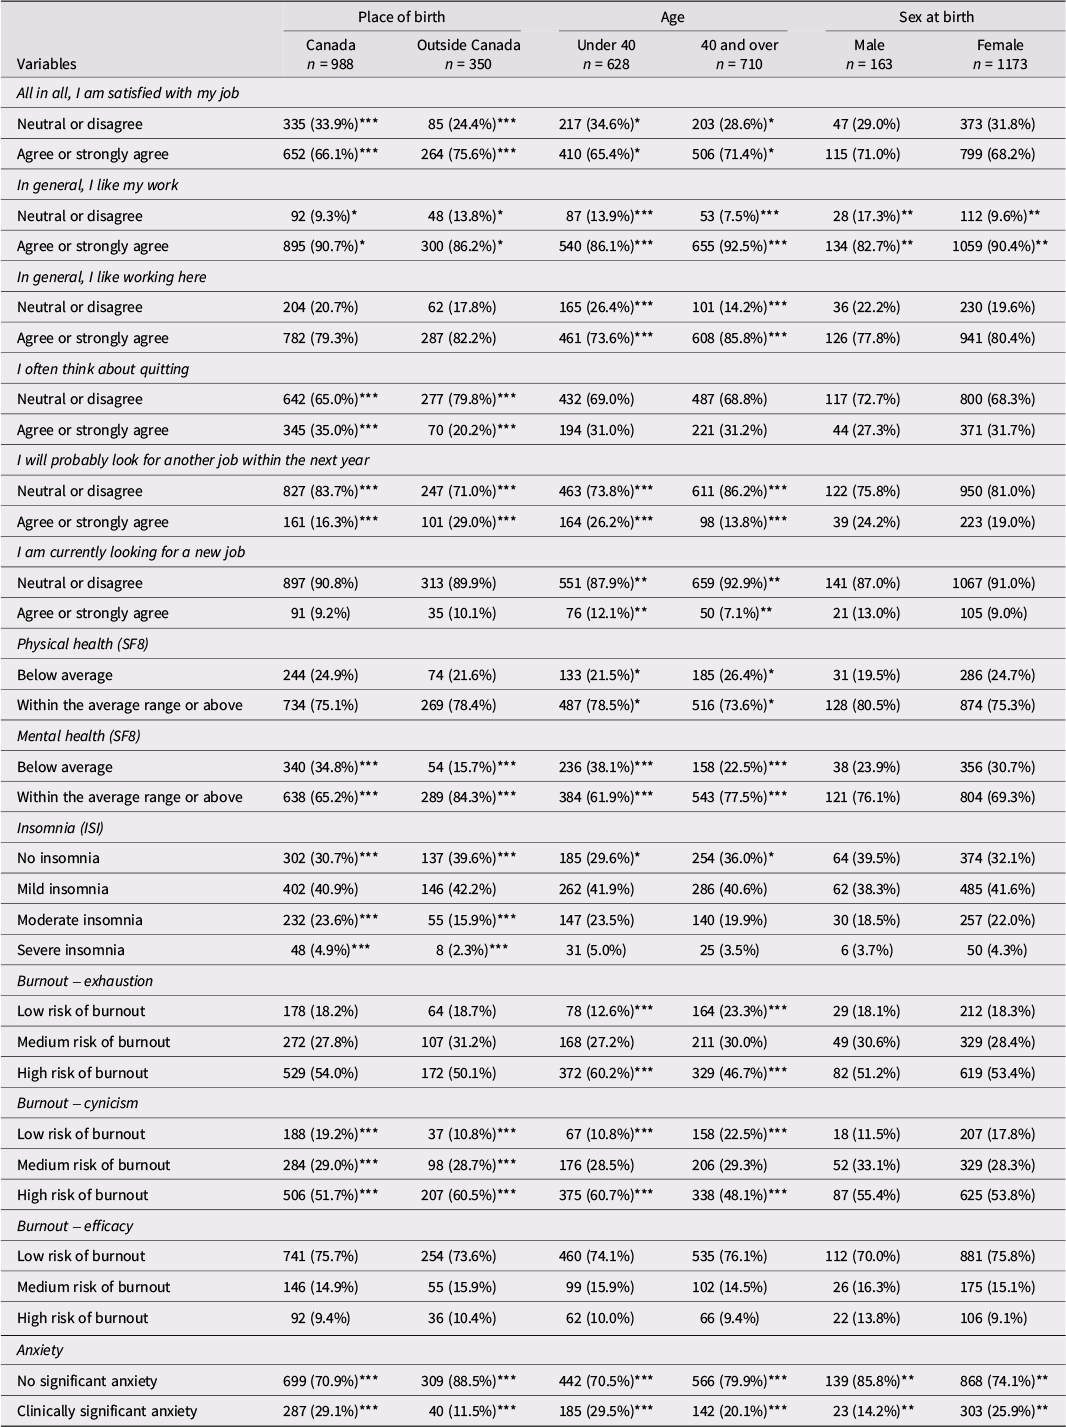
Table 6. Long description
The table is structured with demographic columns: Place of birth (Canada n = 988, Outside Canada n = 350), Age (Under 40 n = 628, 40 and over n = 710), and Sex at birth (Male n = 163, Female n = 1173).
Key findings include:
* Job Satisfaction: 75.6% of those born outside Canada agree or strongly agree they are satisfied, compared to 66.1% born in Canada.
* Intention to Leave: 29.0% of those born outside Canada agree they will probably look for another job within the next year, compared to 16.3% born in Canada. Younger staff (Under 40) are more likely to look for a new job (26.2%) than those 40 and over (13.8%).
* Mental Health (S F 8): 38.1% of those under 40 reported below average mental health, compared to 22.5% of those 40 and over.
* Burnout - Exhaustion: High risk of burnout is prevalent across all groups, peaking at 60.2% for those under 40.
* Anxiety: Clinically significant anxiety is higher in those born in Canada (29.1%) versus outside Canada (11.5%), and higher in females (25.9%) versus males (14.2%).
Statistical significance is indicated by asterisks: * p value < 0.05, ** p value < 0.01, *** p value < 0.001, based on chi-square tests.
*ρ value <0.05; ** ρ value <0.01; *** ρ value <0.001.
Used chi-square test to determine statistically significant differences.
Here, we see that care aides born outside of Canada are more satisfied with their job and fewer often think about quitting compared to care aides born in Canada. Additionally, care aides born outside of Canada reported having better mental health, lower anxiety and less insomnia, compared to care aides born in the country.
Comparing care aides that are under 40 years of age to those that are over, we found that younger care aides are less satisfied with their work and a higher proportion are looking for other jobs than older care aides. A higher percentage of younger care aides are at high risk of burnout on both the exhaustion and cynicism subscale; they also reported worse mental health and have higher anxiety levels than their older colleagues.
There were few statistically significant differences between male and female care aides; however, we note that a lower proportion of male care aides reported liking their work and a lower proportion suffer from clinically significant anxiety, compared to female care aides.
Discussion
Our findings provide the first comprehensive profile of the care aide workforce in Atlantic Canada’s LTC sector. While these findings are descriptive only (i.e., non-inferential), they nonetheless, help us answer the vital question: “Who is looking after Mom and Dad in Atlantic Canada?” A key distinction from other parts of Canada is that the vast majority of the Atlantic workforce is Canadian-born, whereas studies in urban Western Canada have found that a majority of care aides were born outside of Canada and in Ontario just over 40% were born abroad (Chamberlain et al., Reference Chamberlain, Hoben, Squires, Cummings, Norton and Estabrooks2019; Estabrooks et al., Reference Estabrooks, Squires, Carleton, Cummings and Norton2015b; Government of Ontario, 2020). Overall, these workers are primarily middle-aged women with almost a decade of experience in the sector. While this workforce appears to be strongly committed to their work, their dedication is undermined by significant personal and professional strain, with over half at high risk of burnout, nearly a third reporting mental health scores below the general population average, and one-in-three considering quitting their job. These findings point to a need for interventions to support these workers both with respect to their mental health and well-being and the retention of this critical workforce. Part of this problem may stem from healthcare worker shortages in the region, as perceived inadequacies in staffing have been linked to care aide burnout prior to and during the COVID-19 pandemic (Costello et al., Reference Costello, Walsh, Cooper and Livingston2019). This aligns with systemic and structural issues of staffing shortages, high vacancy rates, and recruitment challenges identified in both broader literature (Armstrong, Reference Armstrong, Armstrong, Armstrong and Choiniere2024) and specifically in recent reports on reviews of the LTC sector undertaken by the governments of all four Atlantic provinces (Minister’s Expert Advisory Panel, Keefe et al., Reference Keefe, Smith and Archibald2018; New Brunswick Seniors’ Advocates, 2024; Keefe et al., Reference Keefe, Mercer, O’Brien and Daye2025b; PEI Department of Health, 2021). These findings also mirror those found in other high-income countries, including countries throughout Europe, the UK and Australia; researchers point out that the care aide workforce is indeed highly feminized and that chronic shortages associated with workplace stress are highly concerning at a time when the aging population is set to steadily rise and, with it, the need for LTC services (Blake et al., Reference Blake, Lambert, Gregory, Ridge, Stadler, Figgett, Geddes, Towers, Rand, Palmer, Allan, Silarova and Brookes2024; Dubois et al., Reference Dubois, Leončikas, Molinuevo and Wilkens2020; Felder et al., Reference Felder, Bal, Ree, Sogstad, Stoddart, Ellis, Tibu, Vola, Cantarelli, Delgado-Saborit, Aparicio, Lahti, Kankaanpää, Wiig, Wallenburg and Lyng2026; Gil, Reference Gil2022).
On the other hand, our finding of high professional efficacy—a worker’s sense of achievement and competence—is consistent with the “unusually high” job efficacy reported among care aides in Western Canada (Estabrooks et al., Reference Estabrooks, Squires, Carleton, Cummings and Norton2015b). This may reflect the strong sense of commitment that to date has enabled care aides to remain resilient in spite of significant stress and burnout (Song et al., Reference Song, Keefe, Squires, deGraves, Duan, Cummings, Doupe, Hoben, Duynisveld, Norton, Poss and Estabrooks2024).
While similar studies conducted across the European Union and the UK have also found troubling metrics associated with quality of work life and intention to leave among care staff working in LTC homes, like our findings here reveal, care staff in these countries also feel competent and recognize the importance of their work (Blake et al., Reference Blake, Lambert, Gregory, Ridge, Stadler, Figgett, Geddes, Towers, Rand, Palmer, Allan, Silarova and Brookes2024; Dubois et al., Reference Dubois, Leončikas, Molinuevo and Wilkens2020).
Importantly, the overall averages for Atlantic Canada mask profound diversity in experience and outcomes across the region. The diversity we observed reflects deep-seated provincial differences in policy and system structure. Of particular note, NB’s care aides report the lowest job satisfaction and highest intention to leave; meanwhile, they also demonstrate significantly poor access to Clinical Educators. This finding is contextualized by provincial reports identifying NB’s LTC system as critically under-resourced and fragmented (New Brunswick Seniors’ Advocate, 2024). The apparent rarity of in-house learning support leaves direct care staff ill-equipped to manage evolving resident complexity, particularly in dementia care, which in turn affects their own wellbeing and that of residents. As research on professional networks shows, formal and informal advice from credible leaders is crucial for diffusing best practices (Cranley et al., Reference Cranley, Keefe, Taylor, Thompson, Beacom, Squires, Estabrooks, Dearing, Norton and Berta2019; Keefe et al., Reference Keefe, Cranley, Berta, Taylor, Beacom, McAfee, MacEachern, Boudreau, Hall, Thompson, Squires, Wagg and Estabrooks2021); without these structures, staff are left isolated and unsupported in a high-stress environment. While our findings show that all Atlantic provinces face challenges, the particularly poor staff outcomes in NB highlight the tangible cost of systemic under-investment in the workforce.
Likewise, we note considerable differences in outcomes based on place of birth and age. In particular, we find that foreign-born care aides report significantly better health outcomes than their Canadian-born counterparts. Although this may represent an important strength for the sector, this finding should also be interpreted with caution. While our sample’s proportion of foreign-born workers is lower than reported from Western Canada, especially urban centers (Chamberlain et al., Reference Chamberlain, Hoben, Squires, Cummings, Norton and Estabrooks2019; Estabrooks et al., Reference Estabrooks, Squires, Carleton, Cummings and Norton2015b), there is an emerging and increasing reliance on newcomers to fill essential roles within this sector (Harun & Walton-Roberts, Reference Harun and Walton-Roberts2022), a trend that will continue to change the dynamics of care in the region. This shift introduces new complexities to an already strained workplace; provincial LTC review reports acknowledge challenges with hiring foreign workers (Minister’s Expert Advisory Panel, Reference Keefe, Smith and Archibald2018) and instances of racism towards internationally educated staff (NL Expert Advisory Panel, 2025). The cultural and linguistic contrast between an increasingly diverse workforce and a resident population that is predominantly of White, Western European descent, as noted in Estabrooks et al. (Reference Estabrooks, Squires, Carleton, Cummings and Norton2015b), is a dynamic that will require careful management and culturally sensitive training to ensure high-quality, person-centered care. Following established best practices (Public Health Agency of Canada, 2022), research and policy formulation should include the application of an intersectional lens to expose and address issues associated with workplace inequities, power imbalances and marginalization.
Finally, we also find that younger care aides report faring worse on almost all health-related measures. This is consistent with some broader research on care aides (Costello et al., Reference Costello, Walsh, Cooper and Livingston2019) and suggests there may be important generational considerations associated with the work life experience of care aides in the region. It is possible that younger workers have had less time to develop the necessary coping mechanisms for a challenging work environment or that older workers have simply resigned themselves to working under duress (Ellis et al., Reference Ellis, Schroeder, Saba, Churruca, Long, Haver, Akerjordet, Ludlow, Bergerød, Nevantaus, Weenink, Gonzales, Spanos, Lyng, Haraldseid-Driftland, Lungu, Glette, Lahti and Tibu2025). It is difficult to surmise the drivers behind the age-related differences we are seeing here without further exploration into this trend; nevertheless, this overall finding represents a critical warning. The high turnover and recruitment difficulties highlighted in all Atlantic provincial reports—with some private homes in PEI, for instance, reporting annual turnover rates close to 100% for some LTC staff (PEI Department of Health, 2021)—point to the urgent need to support and retain this next generation of caregivers. The COVID-19 pandemic exacerbated pre-existing workforce fragilities, though it has also spurred a much-needed push for review, and hopefully, reform, across the region. Addressing sub-optimal workplace culture, low staff morale, structural issues and funding gaps identified in these reviews (NL Expert Advisory Panel, 2025; PEI Department of Health, 2021) is paramount to making LTC a viable and attractive career path for new workers.
Policy implications
Our findings, supported by a growing body of national research and regional reports, point to several key areas for policy intervention to support the LTC workforce and improve resident care. We recommend that provincial governments and LTC organizations in Atlantic Canada:
-
• Reflect on and address stark provincial disparities by collaborating on pan-Atlantic standards for care aide education, certification, and scope of practice. Critically, access to key supports like Clinical Educators—found to be a major deficit in some areas—could be mandated and funded to ensure staff are equipped to handle increasing resident complexity.
-
• A one-size-fits-all approach to human resources will not be adequate. Specific retention programs, including mentorship and clear career pathways, must be developed for younger workers who are currently at the highest risk of burnout. Meanwhile, older care aides face significantly different physical health risks than their younger counterparts and this should be considered within workplace policies and practices. Also, ethical recruitment and integration pathways are needed for the growing cohort of newcomer care aides to transition them from precarious work to stable, long-term careers.
-
• Effective workforce planning is impossible without good data. Reiterating the long-standing recommendations from Estabrooks et al. (Reference Estabrooks, Squires, Carleton, Cummings and Norton2015b), the implementation of mandatory provincial registries for care aides is a foundational step for tracking, planning, and ensuring quality and accountability in the sector, as well as, for future regulation. This is already occurring in NS but has not yet been implemented in the other Atlantic provinces.
-
• Tracking the experiences of residents and staff in the long-term care system is of paramount importance and other countries have begun to adopt measures to do so; for instance, the UK has implemented an annual “adult social care workforce survey,” which regularly tracks key metrics associated with the long-term care sector in the country. As the needs for long-term care increase across Canada, we could benefit from instituting a similar measure (Department of Health & Social Care, 2025).
-
• Provincial funding and regulatory frameworks must evolve beyond a primary focus on safety and security to actively promote a healthy work environment and resident quality of life. This should include ensuring staffing levels at minimum meet the recommended national standard of at least 4.1 hours of direct care per resident per day (Health Standards Organization, 2023) and that funding models enable organizations to invest in the well-being and professional development of their staff.
Limitations
This study has a number of limitations. The data are cross-sectional, which prevents us from inferring causality, and are based on self-reported measures. While our sample is large and spans all four provinces, it may not fully represent experiences in all settings, especially rural homes.
Also, our analysis for this study is primarily descriptive in nature. While it successfully paints a detailed picture of the LTC care aide workforce, as we intended, more robust statistical analysis is needed to formally test the associations between the work environment, policy contexts, and care aide wellbeing. Future research will employ regression modeling to explicitly examine how factors like ownership model, access to educational supports, and workplace characteristics are associated with outcomes such as burnout, job satisfaction and intention to leave.
Furthermore, we reiterate the need for longitudinal studies in Atlantic Canada to track workforce trends over time, similar to the follow-up work conducted in Western Canada (Chamberlain et al., Reference Chamberlain, Hoben, Squires, Cummings, Norton and Estabrooks2019). A comparative policy analysis, as modeled by Irwin et al. (Reference Irwin, Taylor and Keefe2023), is also needed to explicitly link specific provincial policies and care models to the divergent workforce outcomes found in our study. Finally, qualitative research would provide invaluable context for the stark provincial differences we observed, particularly in NB, and the unique challenges faced by younger and newcomer care aides.
Conclusion
The care aides looking after mom and dad in Atlantic Canada are an experienced and dedicated workforce whose intrinsic sense of purpose is being severely tested by systemic pressures. Our findings confirm that this workforce is struggling under the strain of high burnout and poor mental health, with experiences varying depending on their province, employer, age, and origin. While challenges like workforce shortages and increasing resident acuity are national issues, their manifestation in Atlantic Canada presents a unique and urgent call to action. Supporting this essential workforce through evidence-informed provincial policy, improved workplace supports, and targeted retention strategies is not merely a labour issue—it is a fundamental imperative for ensuring the quality of care and dignity of the region’s most vulnerable seniors.
Supplementary material
The supplementary material for this article can be found at http://doi.org/10.1017/S0714980826100853.
Acknowledgements
The authors have received funding from the Canadian Institute of Health Research (FRN 186055), Research Nova Scotia (RNS 2022-2407), Research New Brunswick, Newfoundland and Labrador Centre for Health Research, Health Prince Edward Island and Nova Scotia Health.


 Open access

