INTRODUCTION
Estuaries are zones of nutrient transformation at the interface of freshwater and marine environments (Nixon, Reference Nixon1995). The amount of freshwater discharge defines an estuary's type (Kimmerer, Reference Kimmerer2002) and generally this reaches a maximum in winter-to-spring in mid-latitude river systems (Malone et al., Reference Malone, Crocker, Pike and Wendler1988). Stratified estuaries develop when high discharge combines with low tides (Dyer, Reference Dyer1991; Ibaňez et al., Reference Ibaňez, Pont and Prat1997). This type of estuary is well-known in the Mediterranean and the eastern Adriatic. The Ombla Estuary, near the Croatian city of Dubrovnik, is such an estuary and the subject of this study.
The economic importance of estuaries rests in large part on their high productivity and habitat diversity: combined, they make estuaries excellent nurseries for ecologically and commercially valuable fish and shellfish (Steele, Reference Steele1974). Estuarine productivity is influenced by a host of factors, including irradiance, temperature, discharge rate, nutrient loading, grazing and watershed geomorphology (Day et al., Reference Day, Hall, Kemp and Yanez-Arancibia1989). The interplay of these factors produces spatially and temporally heterogeneous conditions for phytoplankton production, with distinct assemblages developing in sections of different physical–chemical properties (Cloern et al., Reference Cloern, Alpine, Cole, Wong, Arthur and Ball1983; Pennock & Sharp, Reference Pennock and Sharp1986; Viličić et al., Reference Viličić, Jasprica, Carić and Tropan1995a). Because of their characteristic circulation pattern, estuaries are sinks for dissolved inorganic nitrogen and phosphorus. They typically ‘filter’ nutrients before they reach coastal waters (Fisher et al., Reference Fisher, Harding, Stanley and Ward1988). When flow exceeds a system's filtering capacity, higher nutrient loads are delivered to an estuary's lower reaches and the adjacent coastal zone. Hydrology and nutrients control the biomass and composition of estuarine phytoplankton, although grazing occasionally becomes important (Lehman, Reference Lehman2007; Costa et al., Reference Costa, Huszar and Ovalle2009). The stoichiometry of available N, P and Si plays an important role in phytoplankton primary production in all systems (Smith, Reference Smith2006; Soetaert et al., Reference Soetaert, Middelburg, Heip, Meire, van Damme and Maris2006). A significant deviation from typical ratios is an indicator of nutrient-limitation (Dorth & Whitledge, Reference Dorth and Whitledge1992).
The present study was conducted in the highly stratified Ombla Estuary in southern Croatia. The balance of processes at the contact zone of the Ombla's karstic source water with Adriatic seawater, combined with increasing anthropogenic influence during the summer tourist season, make this an interesting study area. A case study of a phytoplankton bloom in the estuary has been reported (Viličić et al., Reference Viličić, Jasprica, Carić and Tropan1995a), but there yet are no comprehensive data on the Ombla's hydrography, phytoplankton, and zooplankton. This study thus addresses the distribution and seasonal patterns of hydrographic properties, nutrient stoichiometry and plankton along the estuary's longitudinal axis. Special attention is focused on the comparison between the plankton communities of this short, highly stratified estuary and those both in other parts of the Mediterranean and in other coastal temperate seas. It is hypothesized that, the renewal time in the Ombla Estuary is short and that algal blooms are unlikely to occur.
Study area
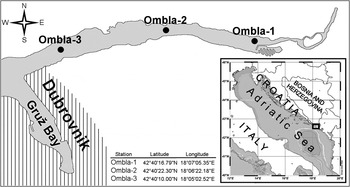
The Ombla originates from a karstic spring (Figure 1) on the eastern Adriatic coast, near the city of Dubrovnik. It is used locally as a water supply. The catchment area boundaries have not been determined but are estimated from water budget analysis to be 800–900 km2 (Bonacci, Reference Bonacci2001). Additional water resources are available from the perennial Zaton and Zavrelje Springs, and occasionally from the intermittent Slavljan Spring, all of which are on the south-western side of the Ombla catchment. An abnormally high rise of the groundwater level can decrease outflow of the Ombla Spring by forcing overflow from the main spring catchment into catchments of surrounding springs.
Geographical location of the Ombla Estuary and sampling sites.

The spring discharges at sea level forming the River Ombla and almost immediately flows into the sea to form a 4-km long highly-stratified estuary. Discharge averages 26 m3 s−1 and varies between 2.3 and 112 m3 s−1. The tidal range is up to 30 cm. The estuary's upper reach is about 6 m deep, while the lower reach is up to 25 m deep. The bulk of sewage water released from surrounding communities is discharged 3.7 km out towards the open sea, but sewage water occasionally is discharged directly into the estuary.
The Ombla Estuary has been recognized under the Croatian Law on Nature Protection as a significant national resource. Sustaining its biological and landscape diversity has become more challenging as the impact of human activities has increased, especially during the tourist season. Part of the value of the present study thus is in its contribution to baseline information that should prove useful in planning the Ombla's rational management.
MATERIALS AND METHODS
To estimate the rate of water exchange, a classic two-layer Pritchard-type circulation model has been assumed: that is, downstream flow in the top layer, upstream flow in the bottom layer, and vertical entrainment and mixing between top and bottom layers. By setting net salinity flux in the estuary to zero (Gordon et al., Reference Gordon, Boudreau, Mann, Ong, Silvert, Smith, Wattayakorn, Wulff and Yanagi1996), one can estimate bottom Q B and upper Q U transport rates as
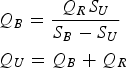
where Q R is river runoff and S U and S B are upper and bottom layer salinity, respectively.
Depths of the two layers (surface and bottom) and salinity variables S U and S B were computed by applying a step function on the measured vertical salinity profiles and averaging it over the estuary. River runoff Q R was measured daily, whereas daily salinities S U and S B were estimated by using linear interpolation in time between measured salinity profiles. Renewal times of the bottom and surface layers have been computed simply by dividing the volume of the bottom or surface layer of the estuary with the bottom Q B or surface Q U transport rate. Average bottom and surface layer velocities have been estimated by dividing Q B or Q U with the average upper or bottom layer cross-section area, respectively.
Data were collected during 17 cruises from November 1999 to November 2000 at three stations: Ombla 1, 6 m deep (sampling depths were at 0, 2, 4 and 6 m); Ombla 2, 15 m (0, 2, 4, 6, 10 and 15 m depth); and Ombla 3, 25 m (0, 2, 4, 6, 10, 15, 20 and 25 m depth). These are in the upper, the middle, and the outer estuary, respectively. Water samples were taken by 5-l Niskin bottles and sub-samples were taken for chemical analysis (Strickland & Parsons, Reference Strickland and Parsons1972; Ivančić & Degobbis, Reference Ivančić and Degobbis1984), chlorophyll-a concentrations (Chl a: Holm-Hansen et al., Reference Holm-Hansen, Lorenzen, Holmes and Strickland1965), and phytoplankton abundance and community structure (Utermöhl, Reference Utermöhl1958). Chemical variables included phosphate (PO4), several species of nitrogen—nitrate (NO3), nitrite (NO2), ammonium (NH4), and total inorganic nitrogen (TIN)—and silicate (SiO4). The TIN/PO4 ratio was calculated according to Redfield et al. (Reference Redfield, Ketchum, Richards and Hill1963). The methods of Rocha et al. (Reference Rocha, Galvão and Barbosa2002) and Neill (Reference Neill2005) were used to determine potentially limiting nutrients. Salinity was determined by argentometric titration (Grasshoff et al., Reference Grasshoff, Ehrhardt and Kremling1983). Dissolved oxygen was determined by the Winkler method and oxygen saturation (O2/O2′) was calculated from solubility of oxygen in seawater as a function of temperature and salinity (Weiss, Reference Weiss1970; UNESCO, 1973). Temperature was measured with an inverted thermometer. The euphotic depth was estimated as 2.5 times the 30-cm-diameter Secchi depth (Strickland, Reference Strickland1958).
Chl a was determined from 500 ml sub-samples filtered through Whatman GF/F glass-fibre filters and stored at −20°C for a period less than a month. Filtered samples were homogenized and extracted in 90% acetone for 24 hours at room temperature (Holm-Hansen et al., Reference Holm-Hansen, Lorenzen, Holmes and Strickland1965). Chl a was determined fluorometrically using a Turner TD-700 Laboratory Fluorometer (Sunnyvale, CA) calibrated with pure Chl a (Sigma).
Phytoplankton samples were preserved in 2% neutralized formalin and observed with an inverted microscope (Olympus IX-71) according to the Utermöhl method (Utermöhl, Reference Utermöhl1958). Sub-samples (25–50 ml) were settled for 24–48 hours in the counting chambers Wild Hydro-Bios (Kiel-Holtenau, Germany). Counting was carried out using phase contrast and bright field illumination. Counting of microphytoplankton cells (longer than 20 µm, MICRO) were performed on 1–2 transects along the counting chamber bottom at a magnifications of 400 × (1 transect) and 200 × (2 transects). In addition, the entire chamber was subsequently scanned at magnification of 100 × to obtain a more correct evaluation of rarer taxa. The minimum abundance that can be detected by this method is 20 cells l−1. Nanophytoplankton cells (2–20 µm, NANO) were counted in 30 randomly selected fields-of-view along the counting chamber at a magnification of 400 ×. NANO cells were not taxonomically identified. Results are expressed as number of cells per litre (abundance). Identification of individual cells was performed to the lowest possible taxonomic level, according to determination keys (e.g. Hustedt, Reference Hustedt1930; Cupp, Reference Cupp1943; Heimdal, Reference Heimdal and Tomas1993; Throndsen, Reference Throndsen and Tomas1993; Hasle & Syvertsen, Reference Hasle, Syvertsen and Tomas1996; Steidinger & Tangen, Reference Steidinger, Tangen and Tomas1996; Bérard-Therriault et al., Reference Bérard-Therriault, Poulin and Bossé1999; Horner, Reference Horner2002; Viličić, Reference Viličić2002). MICRO was ranked according to four categories: diatoms (Bacillariophyceae; BACI); dinoflagellates (Dinophyceae; DINO); silicoflagellates and coccolitophorids (Chrysophyceae, Dictyochales, and Prymnesiophyceae, Coccosphaerales; SILICO + COCCO); and filamentous cyanobacteria (Oscillatoria) and euglenophytes (Cyanophyceae, Nostocales, and Euglenophyceae; OTHERS). Among silicoflagellates and coccolithophorids, only taxa larger than 20 µm have been counted: Dictyocha fibula, Syracosphaera pulchra, Calyptrosphaera oblonga, Calciosolenia brasiliensis and Scyphosphaera apsteinii.
Microzooplankton (small zooplankton taxa) samples were collected using 5-l Niskin bottles and preserved in 2.5% formalin. Samples were settled in the laboratory for 72 hours (Kršinić, Reference Kršinić1980), until the original 5 l volume was reduced to 30 ml. The organisms then were counted and identified with an Olympus IX-71 microscope at magnifications of 100 × and 400 ×. Microzooplankton included: tintinnids (Tintinnina); non-loricate ciliates, including all other ciliates >20 µm; rotifers; copepod nauplii; copepod postnauplii, including copepodites of all copepod species and adult specimens of small copepods of the genera Oithona, Oncaea and Euterpina. According to the ICES Working Group on Zooplankton Ecology (ICES, 2007), adults of small copepods (smaller than 200 µm in size) of the genera Oithona, Oncaea and Euterpina were included in microzooplankton size-fraction. In this study, small adult copepods were included within the group of postnaupliar copepods.
Statistical analyses were performed for 68 samples from Ombla 1, 102 from Ombla 2, and 126 from Ombla 3. The number of data points for the surface layer was: Ombla 1, N = 30; Ombla 2, N = 36; and Ombla 3, N = 36. Below the pycnocline, the number of data points was: Ombla 1, N = 38; Ombla 2, N = 66; and Ombla 3, N = 90. Analysis of variance and the Student–Newman–Keuls multiple range test were performed to determine the significance of differences between stations and between layers. Correlations between parameters were determined with the Pearson product–moment correlation. All variables were logarithmically transformed [log (x + 1)] to improve correlation among the variables (Cassie, Reference Cassie1962). The Kolmogorov–Smirnov test was used for testing normality of the distribution. Analyses were performed with STATISTICA (StatSoft Inc., Tulsa, OK) and STATGRAPHICS: A statistical graphic system, Version 2.6 (STSC Inc., Maryland, USA).
RESULTS
Physical–chemical characteristics
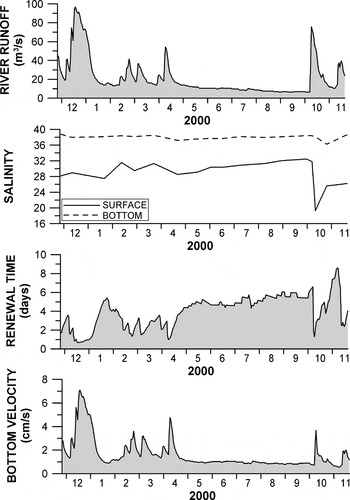
Time-series of river runoff and average salinities for the investigation period show extremely low runoff (6–12 m3 s−1) between May and September (Figure 2). Average bottom velocity, computed from the transport and volume of the estuary, ranges from 1 and 7 cm s−1; it is lowest during the period of low river runoff and largest during flood events, as in December 1999. Lower velocity and transport naturally result in a longer renewal time of the bottom layer, which is estimated at about 1–2 days during flood events and up to 8 days during the dry season. These average values have been obtained by assuming salt conservation over the entire estuary, which is not necessarily a valid assumption, especially for the outer estuary. These calculations nevertheless roughly quantify the dynamics of the estuary during periods of extreme freshwater discharge. Average surface velocity for the upper layer ranges between 15 and 80 cm s−1. The renewal time of the surface layer is estimated at about 1–2 hours during flood events and up to 8 hours during the dry season.
Time-series of river runoff, salinities, renewal time and velocity in the Ombla Estuary.

Transparency depth along the estuary varied between 3 m (October) and 18.5 m (February). Secchi disc transparency and euphotic layer depth extended to the bottom in the upper reach of the estuary at Ombla 1. The euphotic zone was 7.5 m at Ombla 2 and 10 m at Ombla 3. The lowest transparency occurred at the end of May and also at the end of August.
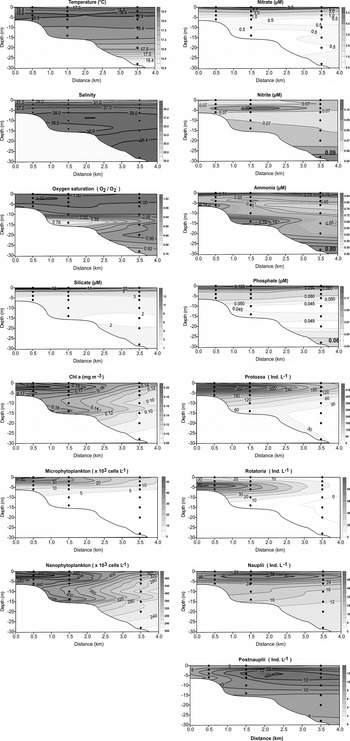
Distribution patterns along transect were identified using averages of chemical and biological parameters calculated for each sampling depth at each station (Figure 3). There were significant salinity differences (P < 0.05) along the longitudinal axis of the estuary (Figure 3), but not in temperature and oxygen saturation. The concentrations of SiO4, PO4, and NO3 decreased significantly (P < 0.05) in seaward direction, but there were no differences in either NO2 or NH4.
Distribution of physical–chemical parameters, chlorophyll-a concentrations, phytoplankton, and zooplankton along the Ombla Estuary (values for each depth are expressed as means based on all observations).

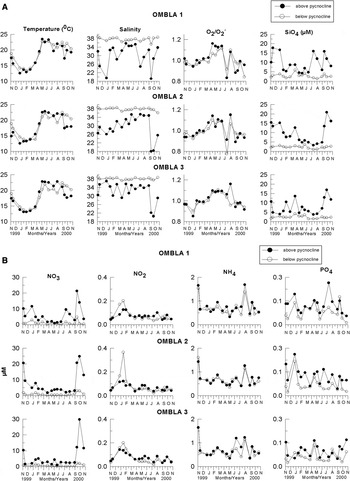
The steep pycnocline generated by salinity (r = 0.98, P < 0.001) occurred most often within the 2–4 m depth zone. Variations in the mean values of physical and chemical parameters above (surface layer) and below (bottom layer) the pycnocline are presented in Figure 4. No significant difference in temperature was found between surface and bottom layers. In fact, the vertical temperature structure was rather homogeneous through most of the year. The winter minimum temperature rose steadily from March to the end of May and then was more or less uniform until September. In October, the water column began to cool, especially in the upper layer. This led to inverse stratification with a temperature gradient of 1.35–2.5oC m−1. Salinity in the bottom layer was near constant throughout the year, with most values around 38. This suggests an influx of seawater in the entire estuary. Salinity in the surface layer differed significantly (P < 0.001) from that in the bottom layer, with the minimum salinity (11.89) in the surface layer at Ombla 1, the station closest to the estuary's source. Oxygen saturation of both layers indicated good aeration (range 0.77–1.17, average 1.01), with no significant difference between layers. The nutrient concentrations in the surface layer—especially SiO4 and NO3—oscillated much more than those in the bottom layer. High nitrate concentrations characterized the surface water during winter and autumn, periods when freshwater input is high. Seasonal variations in SiO4 (r = 0.71, P < 0.001) and PO4 (r = 0.39, P < 0.001) were similar to that of NO3. Significant differences (P < 0.001) in concentrations between layers at all stations were found for SiO4 and NO3. For PO4, these differences were more significant at the most seaward station, Ombla 3 (P < 0.001). The nutricline overlapped the halocline. There was no statistical difference in NO2 and NH4 between layers. NO3 accounted for the highest fraction of TIN (average (avg) 76%, standard deviation (STD) 18.23) in the surface layer, followed by NH4 (avg 23%, STD 19.23). In the bottom layer, the proportions were as follows: NO3 (avg 40%, STD 22.50) and NH4 (avg 54%, STD 22.10). NO2 was always negligible.
Monthly variations of physical–chemical parameters (averages for the layers above and below the pycnocline) in the Ombla Estuary.

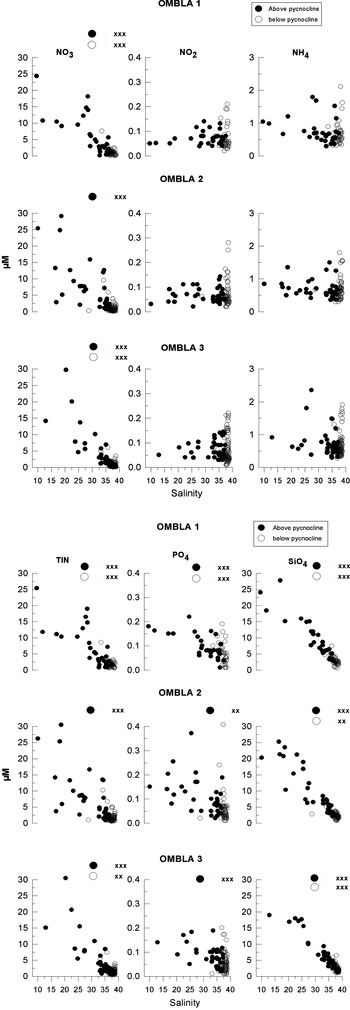
Figure 7 illustrates the relationship between nutrients and salinity above and below the pycnocline. Nitrate and silicate follow an inverse pattern with salinity and are higher in surface waters. Phosphate shows the same behaviour above the pycnocline. PO4 below the pycnocline, as well as NO2 and NH4 in both layers, has a different pattern, with concentrations sometimes higher at higher salinity. Surface nitrate (r = −0.75, P < 0.001), dissolved silicate (r = −0.91, P < 0.001), and reactive phosphate (r = −0.55, P < 0.001) were inversely correlated with salinity, which indicates input of these essential nutrients with Ombla source water.
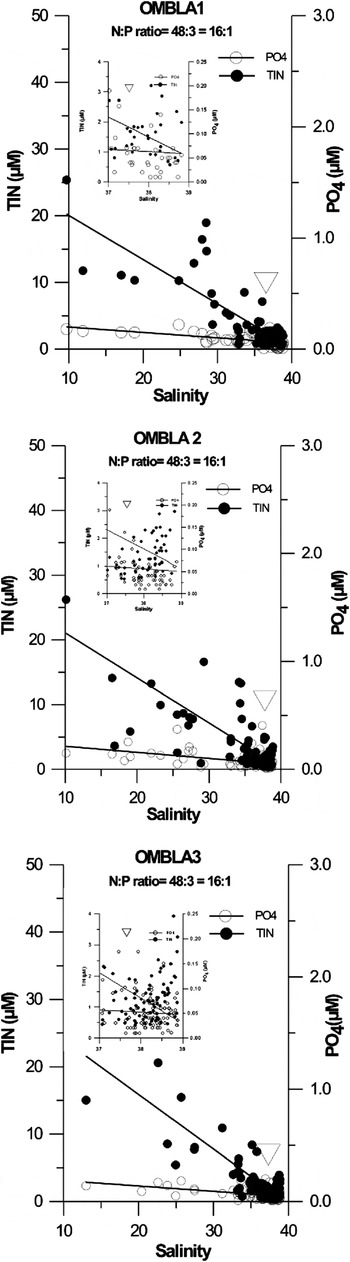
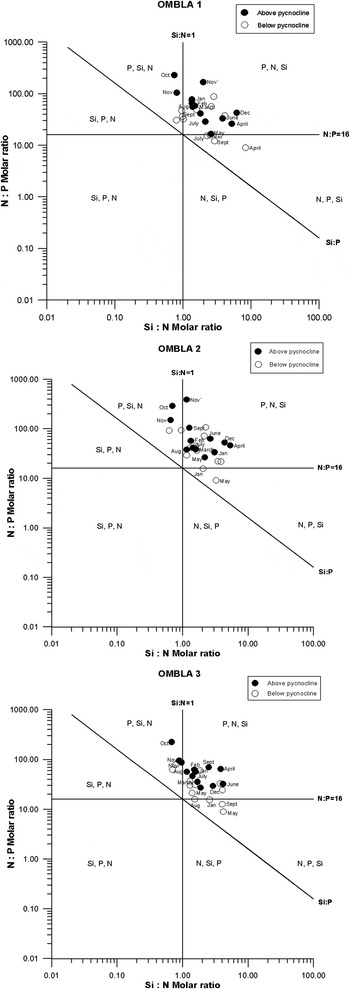
Changes in nutrient supply are often reflected in their ratios. The Redfield ratio (TIN/PO4) values were appropriate (Klausmeier et al., Reference Klausmeier, Litchman, Daufresne and Levin2004) for phytoplankton growth from April to August, and means were as follows: 27 (Ombla 1), 31 (Ombla 2) and 38 (Ombla 3). The Redfield ratio increased throughout the estuary, almost due to decreased PO4 concentrations (<0.01 µM), suggesting greater potential for P limitation of phytoplankton growth. The method of determining the limiting nutrient for phytoplankton growth in estuarine waters at any salinity is based on overlaid graphs of nutrients (TIN and PO4) versus salinity (Neill, Reference Neill2005). This method indicates that PO4 is the limiting nutrient throughout the Ombla, except sporadically, for the higher salinities. So at Ombla 1, where either P and N may become equally limiting at salinity ≥ 38.8 (the trendlines tend to converge at salinity ≥ 38.8), or at Ombla 3 when TIN may become limiting at salinity ≥38.5 (the trendlines for N and P intersect at salinity ≥ 38.5) (Figure 8). The method of Rocha et al. (Reference Rocha, Galvão and Barbosa2002), which considers the molar quotients of potentially limiting nutrients, suggests that P limitation is most likely. Only in some cases below the pycnocline is N limitation indicated, while there was no sign of Si limitation (Figure 9).
Phytoplankton
There was a significant seawards decrease in phytoplankton abundance and biomass (Chl a) (P < 0.05) along the estuary (Figure 3). There was a correlation among Chl a, MICRO, and NANO (P < 0.001). There was no difference in MICRO and NANO between surface and bottom layers at Ombla 1, but there was at Ombla 2 for MICRO (P < 0.001) and at Ombla 3 for MICRO (P < 0.001) and NANO (P < 0.05). Correlations of MICRO and NANO with temperature (P < 0.001), as well as with oxygen (P < 0.01), were found in both layers, but only NANO (P < 0.01) correlated with NH4. All of these correlations were positive.
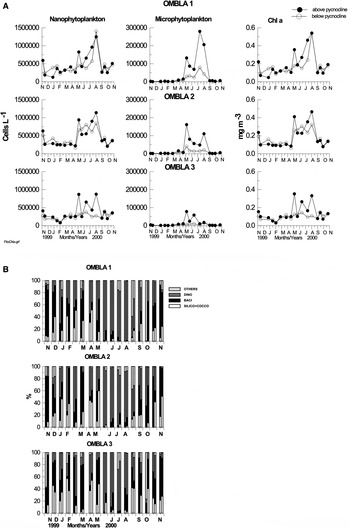
Seasonal distribution of Chl a was in agremeent with those of NANO and MICRO abundances (Figure 5A). Three peaks of Chl a and NANO were noted: November 1999, the end of May 2000 and the end of August 2000. However, there were two MICRO peaks, the first at the end of May and a second at the end of August. The MICRO first peak was mostly of Prorocentrum triestinum and Scrippsiella trochoidea; the second, of Syracosphaera pulchra, Eutreptiella lanowii and Scrippsiella trochoidea.
Monthly distribution of microphytoplakton (MICRO) and nanophytoplankton (NANO) abundances, and chlorophyll-a concentrations (Chl a) (averages for the layers above and below pycnocline; (A) and the relative contribution of taxonomic groups to microphytoplankton (diatoms = BACI; dinoflagellates = DINO; silicoflagellates and coccolitophorids = SILICO + COCCO; filamentous cyanobacteria and euglenophytes = OTHERS; (B) in the Ombla Estuary.

Diatoms dominated MICRO up to March and in November 2000 (Figure 5B). They correlated positively with temperature (P < 0.001) in both layers, and positively with salinity (P < 0.01) and oxygen (P < 0.001), but negatively with NO3 (P < 0.05) and SiO4 (P < 0.05) only above the pycnocline. Diatoms (>102 cells l−1) included Nitzschia longissima, Chaetoceros spp., Pleurosigma angulatum, Thalassionema nitzschioides, Cocconeis scutellum, Diploneis bombus and Licmophora flabellata. The most abundant (>103 cells l−1) were N. longissima and Chaetoceros spp. Dinoflagellates dominated MICRO from the end of May to August. They correlated positively with temperature (P < 0.001) in both layers, and negatively with salinity (P < 0.001) and positively with PO4 (P < 0.05) only below the pycnocline. The most abundant dinoflagellates were Prorocentrum triestinum (8.0 × 10⁴–1.1 × 10⁵ cells l−1), Scrippsiella trochoidea (3.2 × 10⁴–1.5 × 10⁵ cells l−1), Prorocentrum micans (4.2 × 10³–2.0 × 10⁴ cells l−1) and Gonyaulax sp. (2.1 × 10³–6.3 × 10³ cells l−1). Silicoflagellates and coccolithophorids generally were represented during winter–spring and correlated negatively with salinity (P < 0.001) and positively with PO4 (P < 0.01) only below the pycnocline. The group OTHERS was composed only of Eutreptiella lanowii and Oscillatoria sp. E. lanowii was the most abundant from June to September (maximim 1.2 × 10⁴ cells l−1). Oscillatoria sp. was only found in November 1999 and October 2000 (maximum 4.6 × 10³ cells l−1). This group correlated positively with temperature (P < 0.05) in both layers, with NH4 (P < 0.01) above the pycnocline, and with PO4 (P < 0.05) below the pycnocline.
Zooplankton
Ciliated protozoans and rotatorians significantly decreased (P < 0.05) seawards (Figure 3), but there were no statistically significant differences for nauplii or postnaupliar copepods. Neither were there differences for any group between upper and lower layers at Ombla 1 and Ombla 2; but there were differences for the total number of ciliates (P < 0.001) and copepod nauplii (P < 0.05) at Ombla 3. All zooplankton groups correlated with temperature (P < 0.001) in both layers, but only nauplii (P < 0.001) and postnaupliar copepods (P < 0.001) correlated with salinity.
For MICRO and NANO, there were correlations for ciliated protozoans (P < 0.001) and rotatorians (P < 0.01) in both layers, and for nauplii (P < 0.001) only in the bottom layer. A correlation among NANO and postnaupliar copepods (P < 0.05) was found in the upper layer. All of these correlations were positive.
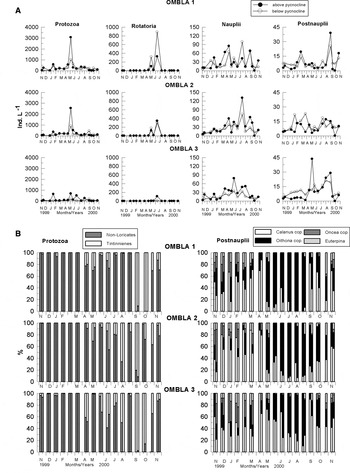
A peak of protozoans (Figure 6A) occurred at the end of May, with a maximum of 3428 ind l−1 at 2 m at Ombla 2. Non-loricate ciliates dominated throughout most of the year, except in September and October, when the tintinnid Codonellopsis schabi reached 560 ind l−1 (Figure 6B). The contribution of tintinnids to total density increased along the track from Ombla 1 to Ombla 3. There were two peaks of rotatorians (Figure 6A), the first at the end of May (maximum, 330 ind l−1) and the second in July, with a Synchaeta neapolitana maximum of 1170 ind l−1.
Monthly distribution of zooplankton abundance (averages for the layers above and below the pycnocline, A), and the relative contribution of taxa (B) in the Ombla Estuary.

There were nauplii peaks (Figure 6A) at the beginning of May and August, in September at Ombla 1 and Ombla 2, and in June and August at Ombla 3. The maximum, 204 ind l−1, was found in August at 2 m at Ombla 2. Two peaks of postnaupliar copepods (Figure 6A) were recorded at Ombla 1 (March and September) and Ombla 3 (end May and September). Postnaupliar copepods (Figure 6B) were in both layers until May and then from September, with the highest percentage being calanoid copepodites. Postnaupliar oithonids dominated from May to the end of August, but their contribution decreased from Ombla 1 to Ombla 3. The bulk of the population consisted of copepodites and adults of Oithona nana.
DISCUSSION
Winter-to-spring maxima in freshwater discharge characterize mid-latitude river systems (Malone et al., Reference Malone, Crocker, Pike and Wendler1988). In the Ombla Estuary, the highest runoff occurred in December 1999. Runoff was unusually low between May and September as a result of an extremely dry spring and summer. The relatively short renewal time of the Ombla Estuary is similar to that of the Zrmanja (Olujić et al., Reference Olujić, Mihanović, Carić, Gržetić and Ozhan2007), farther up the Croatian coast. It also is similar to renewal times in the Douro (Vieira & Bordalo, Reference Vieira and Bordalo2000), Minho, Mondego and Ria Formosa Estuaries of Portugal (Saraiva et al., Reference Saraiva, Pina, Martins and Santos2007); the Rhine Estuary in The Netherlands (Lemaire et al., Reference Lemaire, Abril, De Wit and Etcheber2002); and the Yura Estuary in Japan (Kasai et al., Reference Kasai, Kurikawa, Ueno, Robert and Yamashita2010). No algal blooms have been recorded in the Ombla Estuary, likely because estuaries with short renewal times generally are subject to less pronounced algae blooms (Braunschweig et al., Reference Braunschweig, Martins, Chambel and Neves2003). The renewal time of the Ombla Estuary did increase with decreasing freshwater inflow, but apparently not enough to support a bloom. The influence of freshwater on nutrients in the Ombla Estuary is evident in the correlation between salinity and nutrients (Figure 7). The River Ombla enriches the estuary with NO3, SiO4 and some amount of PO4. Most of the NO2 and NH4, and part of the PO4, are produced in the estuary itself by plankton excretion, decomposition of organic matter and anthropogenic influences. The literature has highlighted the importance of impact of freshwater flows on the concentration of nutrients, especially nitrate and silicate (Mallin et al., Reference Mallin, Paerl and Rudek1991; Gobler et al., Reference Gobler, Cullison, Koch, Harder and Krause2005; Glé et al., Reference Glé, Del Amo, Sautour, Laborde and Chardy2008; Zhou et al., Reference Zhou, Shen and Yu2008; Ho et al., Reference Ho, Xu, Yin, Jiang, Yuan, He, Anderson, Lee and Harrison2010). NH4, PO4 and NO2 are products of microbiological regeneration in the Ebro (Spanish Mediterranean coast), Zrmanja and Krka Estuaries (Sierra et al., Reference Sierra, Sánchez-Arcilla, González Del Río, Flos, Movellán, Mösso, Martínez, Rodilla, Falcoand and Romero2002; Cetinić et al., Reference Cetinić, Viličić, Burić and Olujić2006; Burić et al., Reference Burić, Cetinić, Viličić, Caput Mihalić, Carić and Olujić2007). Nutrient concentrations in the Ombla Estuary were within the same range as in oligotrophic estuaries (Gržetić, Reference Gržetić1990; Nedwell et al., Reference Nedwell, Dong, Sage and Underwoodl2002; Burić et al., Reference Burić, Viličić, Cetinić, Caput, Carić and Olujić2005; Cetinić et al., Reference Cetinić, Viličić, Burić and Olujić2006; Dong et al., Reference Dong, Nedwell and Stott2006).
Nutrient concentrations versus salinity at the Ombla Estuary stations. Significant correlation (xP < 0.05; xxP < 0.01, xxxP < 0.001) of nutrients with salinity are given for the layer above (•) and below (○) pycnocline.

Overlaid nutrients versus salinity graphs for total inorganic nitrogen versus salinity and PO4 versus salinity in the Ombla Estuary. The scales on the vertical axes are set at the Redfield ratio of N:P = 16:1 and therefore, the lower trendline denotes the limiting nutrient.

Si:N:P [SiO4: (NO3 + NO2 + NH4): PO4] molar ratios in the Ombla Estuary. Molar quotients between in situ concentrations of potentially limiting nutrients are delimited by Si:N = 1, N:P = 16, and Si:P = 16 lines. Lines define six different areas within the plot, each characterized by a potentially limiting nutrient in order of priority (Rocha et al., Reference Rocha, Galvão and Barbosa2002). All months above pycnocline are marked, while below pycnocline only the months when N limitation occurred.

Under normal flow conditions, estuaries act as filters that reduce downstream nutrient concentrations through biological activity (Christian et al., Reference Christian, Boyer and Stanley1991). During the low-flow season (May–September in the Ombla Estuary), dissolved nutrients are assimilated by the phytoplankton in the upper estuary, reducing NO3, PO4, and SiO4—especially in the surface layer—as water flows to the lower estuary. Increased flow reduces this nutrient filtering capacity. This is particularly apparent in October 2000, when higher flow led to a substantial enrichment of nutrients in the lower estuary.
Nutrient half-saturation constants are available for coastal phytoplankton populations and they are ~1–2 µM for nitrate, 0.1–0.5 µM for phosphate, and for coastal diatom populations 1–2 µM silicate (Fisher et al., Reference Fisher, Harding, Stanley and Ward1988; Kohl & Niklisch, Reference Kohl and Niklisch1988; Sommer, Reference Sommer1991). In the Ombla Estuary, phosphate, generally lower than 0.1 µM, was the first nutrient to drop below its half-saturation constant. At salinities greater than 38, nitrate also was sometimes below its reported half-saturation constant. Nevertheless, in spite of nitrate depletion, nitrogen limitation was rare during this study because of the relatively high ammonium levels. In the coastal waters of the Gulf of Mexico phytoplankton that are influenced by Mississippi River discharge have been found to be well adapted to pulses of nitrate. During periods of low flow, when surface nitrate was greatly reduced, phytoplankton productivity depended greatly on in situ ammonium regeneration (Bode & Dorch, 1996; Sin et al., Reference Sin, Wetzel and Anderson2000). The concentration of dissolved silica in the Ombla Estuary was above the half-saturation typically reported for coastal diatoms, so silicate depletion was not noted.
Analysis of nutrient stoichiometry can indicate potential N, P, or Si limitation of phytoplankton growth. The results in the Ombla Estuary indicate the possible limitation of PO4 throughout the estuary, except at high salinities when TIN limitation was more likely. This agrees with the ‘classic’ assumption of P limitation in freshwater and N limitation in seawater (Creswell et al., Reference Creswell, Karasack, Johnson and Shayler2001). A spatial shift in nutrient limitation is common in estuaries. For example, in the Pearl River Estuary (China) in summer, nutrient limitation shifted from P limitation in the estuary to the N limitation in the oceanic waters (Yin et al., Reference Yin, Quian, Wu, Chen, Huang, Song and Jian2001). In the Ria de Aveiro Estuary (Portugal), the extent by which P is limiting tends to diminish with increasing salinity (Lopes et al., Reference Lopes, Lillebo, Dias, Pereira, Vale and Duarte2007). On the contrary, the N:P ratios at the seaward end of the estuary of the River Colne (England) were much higher, suggesting greater potential for P limitation of phytoplankton production (Kocum et al., Reference Kocum, Nedwell and Underwood2002). The Si:N:P molar ratios and Si concentrations in the Ombla Estuary indicated no seasonal depletion in dissolved silica. This is consistent with results for the Ria de Aveiro Estuary (Portugal) (Lopes et al., Reference Lopes, Lillebo, Dias, Pereira, Vale and Duarte2007). Si depletion has been noted in other temperate estuaries, the Guadiana Estuary (south-western Iberia) and the San Francisco Estuary (Rocha et al., Reference Rocha, Galvão and Barbosa2002; Kimmerer, Reference Kimmerer2005; Domingues et al., Reference Domingues, Barbosa and Galvão2005). Nedwell et al. (Reference Nedwell, Dong, Sage and Underwoodl2002) concluded from N:P, N:Si, P:Si ratios that most UK estuaries were more likely P- than N- or Si-limited.
In the present study, seasonal dynamic of Chl a was in agremeent with those of phytoplankton abundance, particularly NANO, and Chl a can in fact be considered as a proxy of phytoplankton abundance. A clear relationship between Chl a and phytoplankton abundance has already been identified in the South Adriatic coastal area (Jasprica & Carić, Reference Jasprica and Carić1997). Phytoplankton abundance and Chl a in the Ombla Estuary varied spatially—both horizontally and vertically—and seasonally. Abundance and biomass was higher during seasons of low flushing. Phytoplankton was mostly composed of marine species, which is similar to the situation in other eastern Adriatic estuaries, such as the Krka Estuary (Cetinić et al., Reference Cetinić, Viličić, Burić and Olujić2006) and the Zrmanja Estuary (Burić et al., Reference Burić, Viličić, Cetinić, Caput, Carić and Olujić2005).
Microphytoplankton cells abundance reached seasonal maxima when the water column was vertically stable. Dinoflagellates and diatoms generally were the major MICRO components, with diatoms dominating in winter–early spring when MICRO abundance was low, turnover time reduced, river runoff high (up to 80 m3 s−1), and both surface and bottom velocities (80 cm s−1 and 7 cm s−1) high. That period also had low temperature and salinity, but high NO3, NH4, and SiO4. Diatom abundances in the surface layer were roughly twice those in the bottom layer at all stations. Diatoms commonly are favoured when NO3 is high (Bode & Dortch, Reference Bode and Dortch1996), as generally is the case in the coastal southern Adriatic (Jasprica & Carić, Reference Jasprica, Carić, Jahn, Kociolek, Witkowski and Compère2001). A high contribution of diatoms during high inflow and high NO3 was also recorded in the eastern Adriatic estuaries (Burić et al., Reference Burić, Viličić, Cetinić, Caput, Carić and Olujić2005; Cetinić et al., Reference Cetinić, Viličić, Burić and Olujić2006). Diatoms are the only phytoplankton group that can survive high turbidity and low retention times (Lionard et al., Reference Lionard, Muylaert, Hanoutti, Maris, Tackx and Vyverman2008). In many temperate estuaries and coastal areas, diatom abundance usually decreases in summer owing to Si- or N-limitation (Domingues & Galvao, Reference Domingues and Galvão2007). The decrease of diatoms in the Ombla Estuary was not related either to N- or Si-depletion (explained above). We found correlation between the densities of microphytoplankton and microzooplankton. Therefore, the decrease of diatoms was most probably caused by grazing activity, as was the case in the Guadiana Estuary (Chícharo et al., Reference Chícharo, Chícharo and Ben-Hamadou2006). Grazing pressure, rising temperature, and stable density conditions are probably the main factors that caused the replacement of diatoms by dinoflagellates in the Ombla Estuary. The summer phytoplankton throughout Chesapeake Bay was dominated by dinoflagellates in the higher salinity regions (Marshall et al., Reference Marshall, Burchardt and Lacouture2005). Dinoflagellates were dominant in mid to late summer in Babadillimani Bight, north-eastern Mediterranean coast (Polat & Piner, Reference Polat and Piner2002), in the north-east of Scotland (Bresnan et al., Reference Bresnan, Hay, Hughes, Fraser, Rasmussen, Webster, Slesser, Dunn and Heath2009), and in the Bay of Tunis (Daly Yahia-Kéfi et al., Reference Daly Yahia-Kéfi, Souissi, Gómez and Daly Yahia2005). They generally are more stenohaline than diatoms (Daly Yahia-Kéfi et al., Reference Daly Yahia-Kéfi, Souissi, Gómez and Daly Yahia2005). Dinoflagellates exhibit a more diversified trophic behaviour than diatoms because they are able to carry on their metabolic activities both autotrophically and heterotrophically. Thus, unlike diatoms, they are not as tightly coupled to ambient nutrient levels. Indeed, the most abundant dinoflagellates in the Ombla Estuary, Prorocentrum triestinum, Scrippsiella trochoidea and Prorocentrum micans are mixotrophic (Jeong et al., Reference Jeong, Yoo, Park, Song, Kim, Lee, Kim and Yih2005).
Despite that euglenophytes have been used as biological indicators of organic pollution in seawater (Stonik & Selina, Reference Stonik and Selina2001; Šolić et al., Reference Šolić, Krstulović, Kušpilić, Ninčević Gladan, Bojanić, Šestanović, Šantić and Ordulj2010), we could not relate occurring Eutreptiella lanowii with the sewage water input due to its relatively low abundance and lack of detailed information on discharges into the estuary.
Zooplankton in the Ombla Estuary is mostly composed of marine estuarine–neritic species. This is similar to the situation in the Krka Estuary (Vidjak et al., Reference Vidjak, Bojanić, Kušpilić, Grbec, Ninčević-Gladan, Matijević and Brautović2009). The influence of open Adriatic seawater was evident along the estuary by the presence of the tintinnnids Eutintinus fraknoi, Rhabdonella spiralis, Epiplocylis undella and Epiplocylis acuminate. The small copepod Oncea zernovi, usually found in the open sea, also was found in the Ombla Estuary. This species previously has been encountered only sporadically locally, notably in Gruž Bay, an arm of the lower Ombla Estuary that serves as Dubrovnik's cruise ship terminal; and farther up the Croatian coast in Mali Ston Bay, where it reaches very high densities (Kršinić et al., Reference Kršinić, Viličić, Jasprica, Carić and Mikuš1991). The abundance of ciliated protozoans and rotatorians decreases along the estuary. This is consistent with the distribution of their food—phytoplankton, bacteria and detrital floc. Although not measured in the present study, it is reasonable to assume that detritus and bacteria are present in greater abundance in the upper estuary (Ombla 1 and 2) because of the freshwater input and sewage released from surrounding settlements.
Ciliates throughout were controlled by temperature, food supply and micrometazoan grazing. Non-loricate ciliates reached a maximum in May, particularly at Ombla 1 and 2. This correlates with higher abundance of MICRO and NANO. Furthermore, lower grazing pressure on phytoplankton by post-naupliar copepods in May, owing to their lower abundance at Ombla 1 and 2, makes this uneaten material availaible for ciliates. Loricate ciliates dominated the ciliated protozaoan community in September and October, mostly owing to the high abundance of the tinitinnid Codonellopsis schabi. This species also was found in high numbers in the aforementioned Gruž Bay in September 1979 (Kršinić et al., Reference Kršinić, Viličić, Jasprica, Carić and Mikuš1991) and in Kaštela Bay (middle-eastern Adriatic), in September 1998 (Bojanić et al., Reference Bojanić, Šolić, Krstulović, Šestanović, Marasović and Ninčević2005). Codonellopsis schabi occured in the temperature range of 21.4–28.4°C and salinity of 36.5–38.4 (Kršinić et al., Reference Kršinić, Viličić, Jasprica, Carić and Mikuš1991). This species is a good indicator of water with a high load of organic detritus and bacteria, in which it acts somewhat as a purifier (Kršinić et al., Reference Kršinić, Viličić, Jasprica, Carić and Mikuš1991). Remineralization of the suspended labile organic matter remaining after the seasonal decrease of phyto- and zooplankton populations in September has been shown to involve an increase in attached bacteria and ciliates (Viličić et al., Reference Viličić, Kršinić, Carić, Jasprica, Bobanović-Ćolić and Mikuš1995b).
Seasonal dynamics of naupliar and post-naupliar copepod stages in the Ombla Estuary was governed by temperature, salinity, and available food. Highest abundance was in the warmer part of the year and contemporary with minimal river runoff and higher salinity. The summer maximum of nauplii and postnauplii also can be understood to be a result of high grazing pressure on NANO and MICRO. This is likely responsible for the reduction in diatoms. The small omnivorous copepod Oithona nana occurred at the same time, as was also evident in Gruž Bay (Kršinić et al., Reference Kršinić, Viličić, Jasprica, Carić and Mikuš1991) and the Krka Estuary (Vidjak et al., Reference Vidjak, Bojanić, Kušpilić, Grbec, Ninčević-Gladan, Matijević and Brautović2009). Owing to its wide tolerance to temperature and salinity and its opportunistic diet (Williams & Muxagata, Reference Williams and Muxagata2006) O. nana is well adapted to utilize food resources in stratified environments.
Winter conditions in the Ombla Estuary were mostly unfavourable for plankton development. In general, planktonic populations in the Ombla Estuary are controlled by the usual factors: river runoff, temperature, salinity, renewal time, nutrient concentrations and grazing. The influence of open Adriatic seawater was evident along the estuary. Because of its geographical setting and flow patterns, the Ombla Estuary is sufficiently isolated to be studied as a well-defined estuarine system. As noted by Cloern & Jassby (Reference Cloern and Jassby2010), these results contribute to the next step of comparative analyses: identification of the dominant processes and time-scales that determine the patterns of plankton variability in this estuary.
ACKNOWLEDGEMENTS
This research was supported by the Ministry of Science, Education and Sports of the Republic of Croatia, under projects 0001001 and 275-0000000-3186. We thank two anonymous referees and the Executive Editor for their helpful comments. Many thanks also to Dr Nick Staresinic (Galveston, USA) for helpful comments and improving the English language of this paper. The authors thank Rade Garić for designing the figure of the study area.