Implications
Our work contributes knowledge as to how to implement artificial insemination in a large-scale sheep breeding scheme undergoing multivariate selection. It also focuses on how different variables that are important for genetic gain and rate of inbreeding interact, and contributes to an understanding of genetic principles. The results will be utilised in Norwegian sheep breeding, but they are also relevant for sheep populations with similar structure as in Norway.
Introduction
Key elements in the breeding scheme for sheep in Norway, established through the course of the 1960s, include: the selection of half-year-old ram lambs on pedigree and own performance; selection of rams on progeny test results in ram circles; and selection of ewes on estimated breeding values. In the ram circles, the selected unproven ram lambs (test rams) are moved between the flocks participating in the circle, mating all ewes in heat, except those mated to proven rams (elite rams), that is, the elite ewes. The main purpose of the elite matings is to produce test rams for the next generation. The elite rams have traditionally been shifted among ram circles within a county, between the mating seasons. However, in later years, the movements of live sheep over any county border have no longer been allowed due to veterinary restrictions on live animal contact between flocks (allowed when moving rams to stations where they are utilised through artificial insemination).
In the last decade, artificial vaginal insemination (AI) of sheep in Norway has become more common (e.g. Paulenz et al., Reference Paulenz, Soderquist, Ådnøy, Fossen and Andersen Berg2003 and Reference Paulenz, Ådnøy and Söderquist2007). This relatively simple AI technique has made it easier for the farmer to inseminate his/her own ewes. By the use of AI with sheep, more accurate estimation of breeding values, intensified selection among progeny-tested rams and decreased generation interval between sires and progeny should also result, as it did with dairy cattle (Skjervold and Langholz, Reference Skjervold and Langholz1964). Thus, changing a breeding programme towards enlarged use of AI should increase the possibilities to advance genetic gain. However, more use of AI will most likely also increase the rate of inbreeding.
The aim of this study was to evaluate strategies for the use of AI in test and elite rams in breeding programmes (ram circles) both within and across counties, as a means to accelerate genetic improvement, given the constraints on inbreeding.
Methods and assumptions
A breeding population with about 120 000 ewes was stochastically simulated, generating individual genotypes for a total of 10 traits, as well as the inbreeding coefficients (traits: no. of lambs born at 1 year, 2 years and 3 years of age, ewe fleece weight, weaning weight (individual and maternal effect), carcass weight, carcass and fat grade, and lamb fleece weight).
Three nested breeding schemes were compared: a scheme where both young test rams and elite rams are used in AI across all flocks in the country (AI scheme); a scheme with test rams in natural mating (NM) in ram circles and elite rams (from one and a half years of age) in AI (NMAI2 scheme); and a scheme where, in addition to test rams, the youngest elite rams (one and a half years of age) are also used in natural mating in ram circles, while older elite rams are used in AI (NMAI1 scheme). In addition, a scheme where both test and elite rams are used in natural mating, allowing for the exchange of elite rams between flocks within the county (NM scheme), was simulated as a control. The scheme represents the breeding scheme in Norway until the mid-1990s, and served as a basis for comparison with the three nested breeding schemes. In the first three schemes, and for the same parameters (genetic gain and inbreeding), the best combination of percent ewes used to elite rams v. test rams, number of ewes inseminated to elite rams and number of ewes inseminated/mated per test ram was investigated.
Stochastic simulation
Counties, ram circles and flocks
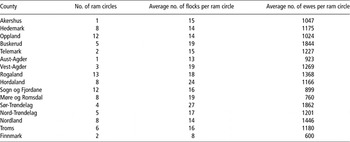
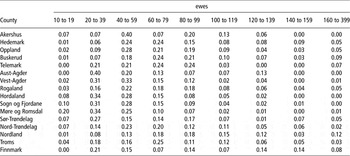
For each simulated replicate, the structure mimicked for the number of ram circles within counties and number of flocks within circles was that for Norway in 2002 (Appendix 1, however only giving the average values for the number of flocks per ram circle in a county). For each county, flock sizes were determined by first assigning flock size on a group basis, drawing a random number and utilising the cumulative distribution function of flock sizes in the respective county in the year 2002. Flock sizes were categorised into 10 groups, that is, in the range 10 to 19 ewes, 20 to 39 ewes, 40 to 59 ewes, 60 to 79 ewes, etc. up until 159 ewes, and between 160 and 399 ewes, as derived from Appendix 2. The exact size within the drawn group was then found by multiplying a uniform random number by the number of ewes in the group and taking the integer value. With this approach, the population size was constant throughout one replicate of the simulation.
Age distribution of animals
The base population had an age distribution of ewes and rams that were randomly assigned from the cumulative distribution functions that can be derived from Appendix 3.
True and predicted breeding values
The traits simulated were all the nine traits that have made up the aggregate breeding value, in addition to the individual effect of weaning weight (economic values and genetic parameters given by Eikje et al., Reference Eikje, Ådnøy and Klemetsdal2008). True breeding values and BLUP breeding values were approximated as in Eikje et al. (Reference Eikje, Schaeffer, Ådnøy, Klemetsdal and Ødegård2010), and selection was on a selection index (SI), the sum over the breeding goal traits for the predicted breeding value for each trait weighted by their respective economic weight.
Very briefly, the method of Eikje et al. (Reference Eikje, Schaeffer, Ådnøy, Klemetsdal and Ødegård2010) samples multivariate breeding values sequentially, for each selection candidate, by utilising the true breeding values of the selection candidate (as conventionally simulated stochastically), its sire and dam, as well as the multivariate distribution of true and predicted breeding values (of the same animals). This distribution relies on the prediction error (co)variance, derived from individual mixed model equations, utilising information on the animal itself with progeny and its parents with progeny.
Culling
Each year adult ewes were culled at random; the cumulative probability of being culled in each age class, as a proportion of all ewe lambs selected as replacements, is given in Appendix 4.
In the NM scheme, adult rams were only culled based on the SI. In the NMAI and AI schemes, AI rams were culled if they were older than 5 years, if not culled at a lower age based on the SI.
In addition, at mating, ewes were culled if they did not conceive after two oestrus cycles (only 50% were culled for ewes of age half year). Conception rates assumed for natural mating and AI were 92.5% (Lyngset and Lyngset, Reference Lyngset and Lyngset1967) and 70%, respectively (Wallin, Reference Wallin2006).
Selection
Selection of ewe lambs and approval of test rams followed how it has been performed in Norway, based on the following criterion (score):  , where SI are the selection indexes of the sire and dam of the selection candidate during the preceding year, wwi is the weaning weight of the i-th selection candidate and
 is the average weaning weight in the f-th flock. The i-th animal weaning weight was generated as: wwi = μ + tbvi + tbvmd + ei, where μ is the population mean (given by Eikje et al., Reference Eikje, Ådnøy and Klemetsdal2008), tbvi is the true breeding value for individual effect on the weaning weight of animal i, tbvmd is the effect of the maternal true breeding value of the dam and ei is the environmental effect. Environmental effects were generated by multiplying a vector of the random standard normal deviates by the Cholesky decomposed environmental (co)variance matrix. The highest ranking lambs, based on the parents’ SIs and the weaning weight deviation, were given a probability of being eligible for a selection of 0.75, that is, that the practice of independent selection for mainly wool quality traits and conformation was accounted for (Norsk Sau og Geit, 2009).
Selection of ewe lambs was within the flock, to replace culled ewes. Selection of ram lambs was either within the circle, or within the country (AI scheme). Lambs not selected for breeding were slaughtered.
The selection criterion for elite ewes (greater than or equal to one and a half years of age) was the SI of the animals. According to established practice, ewe lambs were always ranked behind adult ewes. In addition, elite rams were selected on the basis of the SI, but in NMAI1, the AI rams were selected on the basis of the SI in the preceding year (assuming that a long quarantine at AI stations, as well as few days between index calculation and mating, does not allow selection on the most updated index).
Mating
Elite rams in AI mated the best elite ewes, at random, while, eventually, elite rams in natural mating mated the next best elite ewes similarly. Finally, test rams were allocated at random to the remaining ewes.
In the NM scheme, ewes that did not conceive after first mating were mated to the same or another ram of the same category the second time. In the NMAI schemes, ewes that were inseminated and did not conceive were mated naturally to an elite ram if this category of ram was available, or else to a test ram. In the NMAI schemes, otherwise, the same practice was followed as in the NM scheme. In the AI scheme, ewes that did not conceive were mated naturally to the best ram lambs available in the flock. In this case, the maximum number of ewes mated naturally to each ram lamb was 40. These ram lambs were assumed to be slaughtered at the end of the breeding season.
To control inbreeding depression, matings where the expected inbreeding of progeny would exceed 3.1% were not allowed. However, after five unsuccessful attempts to find a ram where the inbreeding of the progeny was below the limit, the mating was accepted.
Lambing
Phenotypes for the number of lambs born were needed for replacement purposes. For 1-, 2- and 3-year-old ewes, assignment of phenotypic values as a category, for the i-th animal in each of these first three age-classes, j-th class, was based on thresholds (t), that is, to category h when thj < tbvij + eij ⩽ thj + 1, on the standard normal distribution obtained from a transformation of the proportion of ewes in each lambing category (i.e. number of lambs born) in 2002 (Appendix 5). For older ewes, phenotypes for the number of lambs born were simulated as follows: genotypes as for 3-year-olds and the environmental effect from the environmental standard deviation of the number of lambs born at 3 years of age, that is, by assuming that the environmental correlation to the number of lambs born at lower ages (1-, 2- and 3-year-olds) was zero. This is likely from the genetic parameters of Eikje et al. (Reference Eikje, Ådnøy and Klemetsdal2008). A random half of the lambs born was assigned to each sex, for which only the fractions given in Appendix 6 were randomly assigned to survive until weaning.
Replicates and cycles within replicates
Owing to the considerable size of the populations simulated, each alternative investigated within the scheme (i.e. a combination of elite mating percentage (EM%), number of ewes mated/inseminated to each test ram (TNMn/TAIn), and number of ewes inseminated to each elite ram (EAIn)) was replicated only 10 times. Each replicate was run for 20 cycles (years) and results for genetic gain were calculated from the last 15 cycles of selection, while for rate of inbreeding the last eight cycles were used.
Initially, genetic gain in aggregate genotype per year, for each replicate, was calculated as the sum of the products between the regression coefficients of true breeding values of each character on year and the respective economic value. These values were averaged and used for comparison purposes (ΔG). The significance of differences in results between alternatives was calculated by means of Student’s t-test.
To calculate the rate of inbreeding per generation (ΔF), the following formula was used:
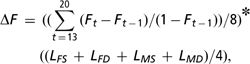
Ft is the average inbreeding coefficient in year t and LFS, LFD, LMS and LMD are generation intervals of sire to son, sire to daughter, dam to son and dam to daughter, respectively. Alternatives were sought that maximised the average genetic gain of the aggregate genotype, for a predicted rate of inbreeding of 0.8% or less per generation, corresponding with the recommendation of 0.5% to 1% per generation of Bijma (Reference Bijma2000).
Schemes
NM scheme; based on natural mating only
Ram lambs half year of age (test rams) were selected and progeny tested within ram circles. Proven rams (elite rams) were ranked and selected across circles within the county and randomly assigned to each circle in the county.
NMAI schemes; based on both natural mating and AI
Two alternatives for use of rams were considered:
NMAI1: half-year-old test rams were ranked, selected and used for natural mating within circles. Elite rams, one and a half years old, were ranked and selected across circles within the county, randomly assigned to circles and utilised by natural mating. By means of AI, elite rams, two and a half years and older, were selected and used across all circles in the county.
NMAI2: Only young test rams were used for natural mating within circles, while elite rams one and a half years and older were selected and used by AI across all circles in the country.
AI scheme; based on AI only
Both young test rams and elite rams were assumed to be selected and used in AI, with full overlap among all flocks and counties across the entire country.
Alternatives simulated
In the NM scheme, the percentage of ewes (elite ewes) mated to elite rams (elite mating, EM%) was 35, as given by Eikje et al. (Reference Eikje, Ådnøy and Klemetsdal2008). The average number of ewes mated to each test ram (TNMn) was 40, while the number of ewes mated to elite rams (ENMn) was 85 (in accordance with averages in the Norwegian Sheep Recording Scheme in 1995).
In the NMAI and AI schemes, the following alternatives were simulated:
(a) EM%: 10, 30 and 50. In NMAI1, one and a half-year-old elite rams mated 10% of the ewes in the circle by natural mating (at least two elite rams per circle). Thus, in this scheme, the alternative with an EM% of 10 was not simulated.
(b) TNMn: 10, 20, 30, 40 and 50, and in AI (TAIn): 100, 200, 300, 400 and 500.
(c) Average number of ewes inseminated to each elite ram (EAIn): 300, 500, 700, 900 and 1100.
In NMAI1, one-and-a-half-year-old elite rams were mated to a maximum of 100 ewes each.
An overview of the schemes and alternatives are given in Table 1. Note that, for the 120 000 ewes assumed, and a given EM%, the number of the elite and test rams will vary with the values assumed for TNMn/TAIn and EAIn.
Schemes based on natural mating only (NM), on natural mating and artificial insemination (NMAI) and on artificial insemination only (AI), with alternatives simulated for the percentage of the 120 000 ewes mated to elite rams (EM%), number of ewes mated naturally to each test ram/elite ram (TNMn/ENMn) and number of ewes inseminated to a test ram/elite ram (TAIn/EAIn)

Details for use of rams when ewes do not conceive in first oestrus cycle are given in the text.
1Used within ram circle.
2Used on the national level.
3Elite rams greater than or equal to one and a half years of age.
4Elite rams one and a half years of age that mated naturally, while elite rams two and a half years to 5 years of age were used in AI.
5Minimum two rams per circle, mated 10% of the ewes.
6Elite rams in AI, one and a half years to 5 years of age.
Results
NM scheme
The simulated genetic progress in aggregate genotype, in the scheme simulated as a control, based on natural mating, was 17.85 Norwegian kroner (NOK) per ewe per year. The rate of inbreeding was 1.71% per generation.
NMAI schemes
In NMAI1, the largest genetic gain (22.52 NOK) for rate of inbreeding that did not exceed 0.8% per generation (0.78%) was for EM% = 30, EAIn = 900 and TNMn = 40.
For NMAI2, the best alternative was for EM% = 30, EAIn = 700 and TNMn = 50, resulting in genetic gain of 25.45 NOK per ewe per year, and at an inbreeding rate of 0.70% per generation. In both NMAI1 and NMAI2, small differences existed between the best alternatives (results not given).
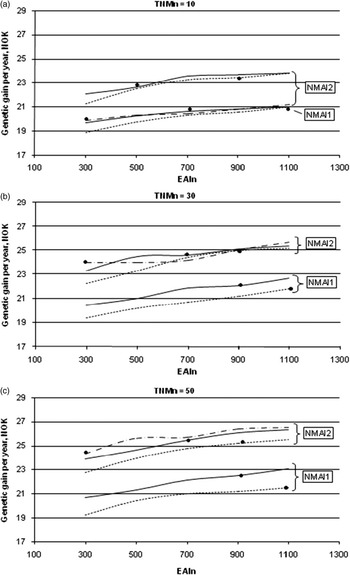
The annual genetic response in NMAI1 and NMAI2 for varying EM%, for increasing the number of ewes inseminated by each elite ram (EAIn), and each test ram mating either 10, 30 or 50 ewes (TNMn) is given in Figure 1. In both schemes, the genetic response was generally consistently larger for EM% = 30 than for EM% = 50 (for all EAIn and TNMn alternatives, but only small differences for large EAIn and small TNMn). Consequently, 50% elite mating becomes less inferior as the number of test rams increases. In NMAI2, an EM% of 10 did only compete in gain for TNMn values of 30 and 50 (consistently lower gain for TNMn = 10 and consistently larger gain for TNMn = 50). Generally, NMAI2 resulted in larger gain than NMAI1.
Annual genetic gain in NOK in schemes NMAI1 and NMAI2 (see Table 1 for schemes) for varying EM% (– - – - - 10% elite mating —— 30% elite mating - - - - - - 50% elite mating) and increasing number of ewes inseminated to each elite ram (EAIn), and test rams mating (a) 10 ewes (TNMn = 10), (b) 30 ewes or (c) 50 ewes. Dots indicate the largest EAIn resulting in ΔF ⩽ 0.8% per generation.
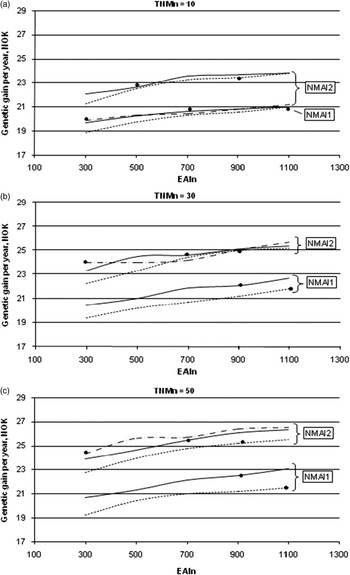
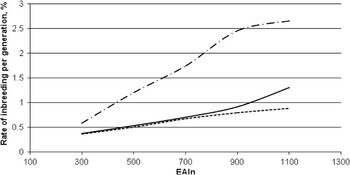
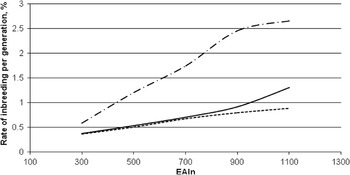
In both NMAI1 and NMAI2, the largest gain was produced for the lowest EM% (30% and 10%, respectively), and for the largest EAIn (fewer elite rams) and TNMn values (1100 and 50, respectively). These alternatives reduce the number of sires used in AI and thus result in the highest rates of inbreeding, as shown in Figure 2 for NMAI2 with TNMn = 50 (ΔF is highest here for EM% = 10 and EAIn = 1100). Consequently, an acceptable ΔF can only be reached for a restricted EAIn, for which the maximum values (in different schemes, EM% and TNMn values) are indicated in Figure 1 (as dots). The highest acceptable point (ΔF ⩽ 0.8) is that of Figure 1c), for NMAI2, with an EM% of 30, EAIn = 700 and TNMn = 50, resulting in a gain of 25.45 per year (the preferred alternative).
Rate of inbreeding in scheme NMAI2 (see Table 1 for scheme) for varying EM% (– - – - - 10% elite mating ——30% elite mating - - - - - - 50% elite mating) and for increasing number of ewes inseminated to each elite ram (EAIn), and test rams mating 50 ewes each.
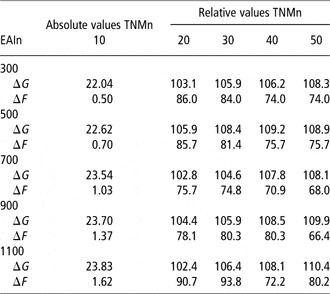
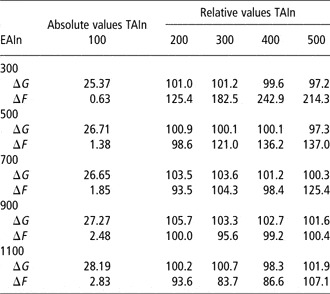
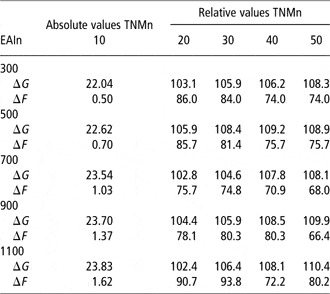
For the preferred EM% with NMAI2 (30%, but correspondingly for 50%, results not shown) and for all values of EAIn, the genetic gain and rate of inbreeding are given for increasing TNMn values in Table 2. Gain increases for reduced ΔF when enlarging TNMn from 10 to 50 (for all EAIn values). For TNMn of 50, ΔG was 1.09 and ΔF 0.73 of that with TNMn of 10.
Absolute and relative values for annual genetic gain (ΔG, in NOK) and rate of inbreeding (ΔF, % per generation) in scheme NMAI2 (see Table 1 for scheme) for 30% elite mating (EM%) and for increasing number of ewes inseminated/mated to each elite ram (EAIn)/test ram (TNMn)
AI scheme
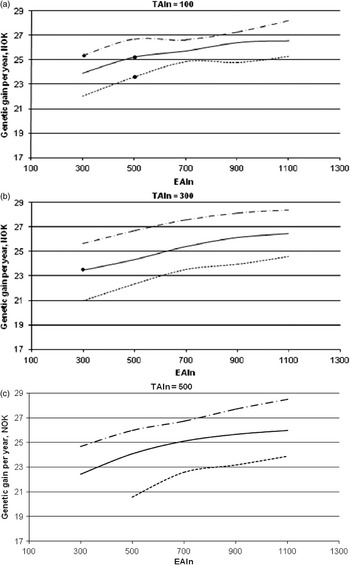
Generally, in this scheme, more inbreeding was generated than in the NMAI-schemes as only 10 alternatives had ΔF ⩽ 0.8. A rather large variation in gain existed between schemes. Highest gain restricted for inbreeding was obtained when EM% = 10, EAIn = 300 ewes and TAIn = 200 ewes, resulting in 25.63 NOK per ewe per year (ΔF = 0.79), rather similar to what was obtained with NMAI2. However, without any restriction on the rate of inbreeding, genetic gain is generally considerably higher for the AI scheme (Figures 1 and 3).
With the use of test rams in AI, the number of ewes inseminated per test ram increases beyond the maximum of 50 used in NMAI2. Thus, it is logical that the results for gain were again in favour of an EM% of 10 (Figure 3), as they were previously with NMAI2 for the largest TNMn-value.
Annual genetic gain in NOK in the AI-scheme (see Table 1 for the scheme) for varying EM% (– - – - - 10% elite mating —— 30% elite mating - - - - - - 50% elite mating) and increasing number of ewes inseminated to each elite ram (EAIn), and test rams inseminating (a) 100 ewes (TAIn = 100), (b) 300 ewes or (c) 500 ewes. Dots indicate the largest EAIn resulting in ΔF ⩽ 0.8% per generation. No dots on lines indicate that ΔF > 0.8%.

As with NMAI2, an EM% of 10 produced the highest ΔF (results not shown), but the restriction on EAIn again resulted in ΔF below the maximum allowed (ΔF ⩽ 0.8, indicated by dots in Figure 3).
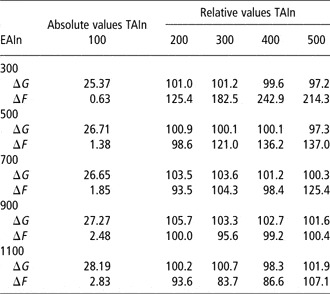
For an EM% of 10 and also for a percentage of 30 (can be an option in practice as it reduces the number of test rams considerably, results not shown) larger TAIn values considerably increased ΔF with only very little improvement of annual genetic gain (Table 3).
Absolute and relative values for annual genetic gain (ΔG, in NOK) and rate of inbreeding (ΔF, % per generation) in scheme AI (see Table 1 for scheme) for 10% elite mating (EM%) and for increasing number of ewes inseminated to each elite ram (EAIn)/test ram (TAIn)
Schemes maximising genetic gain only
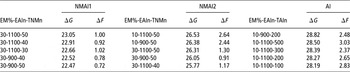
When considering only maximum genetic gain, the top five alternatives in each scheme are given in Table 4, jointly with the rates of inbreeding. The enlarged genetic gain was obtained from an increased number of ewes inseminated to elite rams (AI scheme and NMAI1 scheme) and additionally from a smaller EM% (NMAI2 scheme). For the five alternatives in Table 4, average ΔF was almost twice as high for NMAI2 as for NMAI1, and on average three times as high for the AI scheme. The best alternatives with respect to genetic gain, with a restriction on the rate of inbreeding, in the NMAI1, NMAI2 and AI schemes, were 97.8%, 95.9% and 88.9%, respectively, of that without a restriction on ΔF.
Annual gain in aggregate genotype (ΔG, in NOK) and rate of inbreeding (ΔF, % per generation) for the top five EM%-EAIn-TNMn/TAIn alternatives, in three breeding schemes
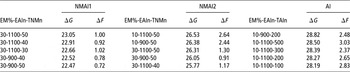
Abbreviations are given in Table 1.
Discussion
The results show that more comprehensive progeny testing of rams, made possible by use of AI, will have the potential of increasing genetic gain in Norwegian sheep breeding. If not restricting the rate of inbreeding, a scheme based only on AI (AI scheme) is here shown to improve genetic gain by more than 60% compared to a scheme based solely on natural mating (NM scheme, acting as a control). However, restricting the rate of inbreeding to 0.8% per generation, a scheme with young test rams used less intensively, that is, in natural mating, and the elite rams used through AI (NMAI2), will give similar or even better results than the AI scheme, now about 40% relative to the NM scheme. If elite rams are used in natural mating during the first year and in AI from two and a half to 5 years of age (NMAI1), the improvement is about 25% relative to the NM scheme.
One should be aware that the realised genetic gain for these breeding schemes may be less than those simulated, for example, because of the lack of willingness of sheep farmers to carry out the breeding programme completely according to plan. For instance, the realised genetic gain in the Norwegian sheep breeding scheme was about 11 NOK per ewe per year for the years 1993 to 2002 (Eikje et al., Reference Eikje, Ådnøy and Klemetsdal2008), which is about 62% of genetic gain in the simulated scheme based on natural mating only. Still, in a breeding scheme with some use of AI, one might have the opportunity to realise more of the potential gain, as the decisions mainly will be taken centrally, for example, in selection of elite rams for use in AI. Thus, more of the optimised gain should be realised in the AI scheme (test and elite rams are used in AI), and more in the NMAI schemes for alternatives with a higher EM% than optimum (30%).
The AI scheme reduces the risk of transmission of diseases across flocks the most (provided that the diseases are not spread by semen). However, to prevent inbreeding from increasing too fast with this scheme, a rather high number of AI rams are needed, which might be impractical and costly (for the optimum, approximately 560 rams are needed and currently a capacity of 500 exists). With an assumed non-return rate of 70%, extensive use of AI will also lead to extended mating and lambing seasons. If this is considered a disadvantage, a relatively low elite mating percentage, in schemes that combine natural mating with test rams, and AI with elite rams, might be more practical. The same is true if, with AI, the daily work with heat testing and insemination is more time consuming than with natural mating. About 0.2 fewer lambs born per ewe inseminated compared to ewes mated naturally (Wallin et al., Reference Wallin, Boman and Blichfeldt2007), not accounted for in the simulations, may also favour a scheme where AI is used on a limited number of ewes. In addition, there will be costs connected with AI (e.g. the extra cost of buying rams, etc.) that have to be covered, for example, through the semen price.
If an elite mating percentage as low as 10 is chosen, in a scheme where only elite rams are used in AI, in NMAI2, relatively few ewes should be inseminated to each elite ram, to keep the rate of inbreeding under control. Further, a fairly high number of ewes should be mated to each test ram to keep genetic gain as large as possible (Figure 1). However, the largest genetic gain in this scheme (NMAI2), with a restriction on the rate of inbreeding, was obtained with an elite mating percentage of 30, in combination with an intermediate number of ewes inseminated to each elite ram (700), comparable with 52 elite rams, and a high number of ewes mated to each test ram. However, if mating on average 50 ewes per young test ram and, in addition, mating those ewes returning to heat after being inseminated is too extreme for young rams, there will only be an insignificant loss in genetic gain by reducing the number of ewes mated per test ram from 50 to 40 (result not shown). If first-year elite rams are used in natural mating (mating 10% of the ewes), some more ewes (900) can be inseminated by each elite ram due to the rate of inbreeding being reduced from the use of ‘local’ elite rams in natural mating, at one and a half years of age (Figure 1). The number of AI rams required in this scheme (NMAI1) is then approximately halved (27 sires) relative to that in NMAI2.
An inference was drawn by choosing alternatives that resulted in the largest gain for an acceptable rate of inbreeding. The alternatives can be decided on or before the breeding programme commences and are as such static selection rules. These rules might have been improved somewhat by implementing optimal contribution selection in the simulation (Meuwissen, Reference Meuwissen1997).
In the AI- and NMAI2-schemes, the preferred ΔF is reached by increasing the number of elite sires, and in NMAI1 from a number of ‘local’ elite rams. Replacement is mainly from elite sires, and increasing their number confirms the Quinton and Smith (Reference Quinton and Smith1995) result that an increased number of sires selected will reduce the rate of inbreeding efficiently (on average, a reduced relationship among them). As shown in NMAI2, the rate of inbreeding decreases as more ewes are mated to each test ram, that is, when the number of test rams decreases (for a given elite mating percentage and number of elite rams; Table 2). With larger progeny groups of test rams, the predicted breeding values will be less regressed towards the average. Consequently, as a group, these test rams have a higher probability of being selected as elite rams, with a bigger turnover of elite rams at the AI station (indicated by a gradually shorter generation interval between sire and offspring for increasing progeny groups of test rams). This broadens the genetic base by balancing the progeny per sire. The results observed in Table 3 for the AI scheme, that the rate of inbreeding increases with the enlarged number of ewes per test ram, reflect the increased relationship between test rams, and again confirm the Quinton and Smith (Reference Quinton and Smith1995) result.
In the simulations, elite rams are inseminated to the same number of ewes. However, in practice, an uneven number of ewes per elite ram will result. Therefore, in addition to these static rules, there will be a need for implementation of optimum contribution methodolgy to control the rate of inbreeding in practice.
Inference on risk of a breeding scheme can be drawn not only from the rate of inbreeding, but also from the variation in the rate of gain (Meuwissen, Reference Meuwissen1991; Meuwissen and Woolliams, Reference Meuwissen and Woolliams1994). For the four best alternatives in the NMAI2-scheme and in the AI-scheme, the coefficent of variation was in the range 0.91% to 2.04% and 1.77% to 2.49%, respectively, well below a coefficent of variation of 5% to 10% over a 10-year period of selection, suggested as an upper acceptable level by Nicholas (Reference Nicholas1989).
The use of AI implies genetic ties. A sufficient amount of ties is needed for an unbiased and precise separation of fixed and random effects (Kennedy and Trus, Reference Kennedy and Trus1993). In the simulation, correction for fixed effects was assumed to be perfect. Note that for sire referencing schemes, Miraei Ashtiani and James (Reference Miraei Ashtiani and James1991 and Reference Miraei Ashtiani and James1992) and Lewis and Simm (Reference Lewis and Simm2000) have found it advantageous to mate 30% and 45% of the ewes to reference sires, in line with the result observed here for the NMAI2 scheme (EM% = 30 to 50 (Figure 1)).
Our results depend on the genetic parameters and the economic values, for which they are normally assumed to be insensitive (for genetic parameters, see Sales and Hill (Reference Sales and Hill1976); for economic values, see Smith (Reference Smith1983)). Another assumption was the same genetic mean in different flocks. If this assumption does not hold, the active breeding population will be less than that simulated (120 000 ewes). Whether the same recommendations can be advised in this situation remains to be explored.
Further investigations should, in addition to examining the effect of the size of the breeding population on genetic gain and the rate of inbreeding, take into account the costs of breeding work, and also include the time lag in the transition of genetic gain from the breeding core to the remaining population.
Conclusion
Given that the possible practical challenges can be solved in the investigated breeding schemes, the scheme where young test rams are used in natural mating in ram circles and all elite rams are used in AI across all flocks in the country (NMAI2) is recommended. This scheme has only slightly more rams at the AI station relative to the scheme where also the youngest elite rams are used in natural mating (NMAI1), for a larger genetic gain. The AI scheme only results in marginally more gain than the NMAI2 scheme, for a large increase in the number of rams at the AI station.
Appendix 1
Number of ram circles per county in Norway in 2002, with average number of flocks and average number of ewes per ram circle
Appendix 2
Proportions of flocks in ram circles with varying flock size per county in Norway in 2002
Appendix 3
Proportion of ewes and elite rams in different age classes in ram circles in Norway in the year 2002

Appendix 4
Proportion of ewes culled in each age class, of those recruited at half year of age, in ram circles in Norway in 2002

Appendix 5
Proportions of ewes by age with increasing number of lambs born in ram circles in Norway in 2002

Appendix 6
Proportions of lambs surviving until weaning in ram circles in Norway in 2002