

Introduction
Demography has recently re-emerged as a growing research area within archaeology. The results of this research have been two-fold. Much progress has been made in refining and developing archaeological demographic methods, aided by the increased availability and precision of radiometric dates, as well as a growing body of comparative demographic data derived from ancient and modern genetics (e.g. Downey et al. Reference Downey, Bocaege, Kerig, Edinborough and Shennan2014; Porčič & Nikolić Reference Porčič and Nikolić2016; Shennan et al. Reference Shennan, Downey and Timpson2013). Concurrently, theoretical approaches to demography within archaeology have moved away from the Malthusian/Boserupian framework which dominated in the 1960s–70s to incorporate cultural evolutionary approaches, in which demography―through its impact on social learning, the retention of cultural traits, and the rate of new innovations―is a key variable in processes of social and artefactual change (e.g. Henrich Reference Henrich2004; Powell et al. Reference Powell, Shennan and Thomas2009; Shennan Reference Shennan2002). Demography is so important to current archaeological research agendas that, in a recent article outlining the 25 most pressing ‘grand challenges’ for the discipline in the twenty-first century, six had a demographic basis, ranging from the need to understand the evolution of social group sizes to the demographic processes that drive urbanism (Kintigh et al. Reference Kintigh, Altschul and Beaudry2014).
While the relationship between demographic and socio-cultural change is high on many research agendas, less attention has been paid to the causes of demographic change in the past. Furthermore, where these have been considered, the focus has been on broad climatic and environmental variables, rather than social factors and individual behaviours (Hull Reference Hull, Sassaman and Holly2011). This is unsurprising, given the coarse-grained nature of much archaeological demographic data and the emphasis on long-term demographic trends. However, a result of this is that archaeologists (myself included) have largely overlooked one key element of their research: the importance of women to the demographic regimes of small-scale societies, and how, as a result, archaeological demography is intrinsically concerned with women. Using demographic principles as a starting point, in this paper I discuss how archaeological demographic studies can serve as a means of rectifying the often implicit androcentric biases in archaeological interpretation, and be used as a tool for the study of gender in the past―defined here as ‘the expression of social practices and beliefs about sexual difference’ (Gilchrist Reference Gilchrist1999, x). My focus will be on prehistory, although the principles discussed are not specific to any time period or region. The overall aims of this paper are to provide the theoretical and biological background to the relevance of archaeological demography to gender archaeology, to outline how gender archaeology practitioners can engage with the results of archaeological demographic research, and to explain what is gained from this engagement.
Women's role in the demography of small-scale societies
The starting point for the use of archaeological demography as a tool for gender archaeology is understanding both the basis of demography and the different demographic roles, and relative demographic importance, of men and women.
All demographic change ultimately results from variation in one or more of the three processes of fertility, mortality and migration. For example, populations can change in size only if there is an imbalance between the number of births (fertility) and the number of deaths (mortality) (this is termed ‘natural increase’) and/or between the number of people moving in to the population and the number of people moving out (this is termed ‘net migration’). While the physical movement of people is an important demographic variable, in the relatively small and closed populations typical of much of the past, long-term variation (i.e. over multiple human generations) in rates of natural increase, rather than in net migration, would have been the primary cause of changes in overall population size (Hinde Reference Hinde, Macbeth and Collinson2002, 33).
The number and relative frequencies of births and deaths drive population change, but not all births and deaths have an equal impact. This is because men and women participate differently in demographic regimes and some members of a population are more important demographically than others. The effects of these are particularly pronounced in small-scale natural fertility populations (‘natural fertility’ refers to the absence of both modern contraceptives and adjustments to reproductive behaviour in view of a target family size: Wood Reference Wood1990, 212–13). This concept is best explained with an example: compare the demographic impact on a small-scale, natural fertility population of the death of a 60-year-old man and the death of a woman in her 20s. The death of the 60-year-old man would directly subtract one member from the population and may adversely affect the lives (including the continued survival) of any dependents for whom he is responsible or provides. He is unlikely to have any more children, although it remains a possibility. Overall, this death would have very little effect on the size of a small population and is unlikely to have any long-term repercussions. In contrast, the death of the woman in her 20s would have a much more sustained impact. In extant small-scale societies, most women in their 20s have at least one child. If that child were still being breastfed, it would almost certainly die with its mother, and even the survival of older children can be at risk. In this case, the death has directly subtracted multiple members from the population. In addition, as the woman is only in her 20s and is biologically able to have children for up to 20 more years, the population has also lost any subsequent children she was very likely to have, as well as the potential future children of any of her earlier children who did not survive into adulthood, her death thus having indirect effects with long-term implications for the population.
An excellent example of the contrast between the importance of men and women can be seen in the demographic consequences of raids and warfare in small-scale societies. Simulations based on demographic data from Hadza hunter-gatherers in Tanzania show rapid population decreases if only 10 per cent of the women aged 15–45 are removed (taken away or killed) from the population every year. Occasional raids once a decade which remove 22 per cent of women and children are sufficient to render the population stationary. In contrast, the loss of only men has little direct effect (Blurton Jones Reference Blurton Jones2016, 221–3). In short, in determining population size and growth, female fertility and mortality, along with the mortality of infants and children, are the key factors, with the fertility and mortality of men playing a much lesser role. Women are the drivers of population change, and their behaviour and other aspects of their lives are important determinants of both their fertility and infant and child mortality.
While the scenarios outlined above derive from studies of extant small-scale societies, these principles apply equally to past populations. This is because of the uniformitarian nature of demography (Howell Reference Howell1976). At least as far as a common biology is shared (i.e. for all Homo sapiens populations), we can assume that the basic processes relating to fertility and mortality are similar, that they respond to variations in the social and natural environment in the same way, and that these similarities act as constraints and impose limits on demographic behaviours. Recognition of the central role of women to demographic change provides the basis for the relevance of archaeological demography to gender archaeology.
Gender, sex and reproduction in archaeological theory
The field of gender archaeology initially grew out of the recognition of the implicit (if not necessarily always explicit) absence of women from much archaeological interpretation and representation (Conkey & Spector Reference Conkey and Spector1984). Over 30 years later, this continues to be the case in many areas of archaeological research, particularly in early prehistory (Bolger Reference Bolger and Nelson2006; Reference Bolger and Bolger2013; Conkey Reference Conkey and Bolger2013). This absence can be explained through the twin issues of the perceived invisibility and the unimportance of women.
The issue of visibility refers to the long-standing default position that the archaeological record is the product of men and is formed primarily as a result of male behaviours (Conkey & Gero Reference Conkey and Gero1997). While the presence of men is assumed, in contrast, women must be proven as active contributors to life in the past (e.g. Fleming Reference Fleming2006, 275). The search for the ‘proof’ of women relies on the gender attribution of artefacts and activities, the burial record (i.e. grave goods associated with clearly sexed individuals), or perceived limitations which restrict possible roles and social behaviours (Brumfiel Reference Brumfiel and Nelson2006, 37–43). The behaviours attributed to women in many archaeological contexts contribute to the pattern of invisible women, with ‘female activities’ largely restricted to domestic settings and ‘female artefacts’ predominantly manufactured from soft materials which leave fewer archaeological traces (Owen Reference Owen2005, 36–7). In addition, the types of artefacts and activities attributed to women are frequently considered unimportant compared to those which by default are classified as male. For example, when women are acknowledged as possible manufacturers of lithic artefacts, they are often limited to expedient, unskilled technologies, rather than the highly skilled technologies that result in formal retouched tools (Arthur Reference Arthur2010; Finlay Reference Finlay and Bolger2013; Gero Reference Gero, Gero and Conkey1991).
There are many problems with gendering activities and artefacts, including the ethnocentric assumptions on which such attributions are often based (Dobres Reference Dobres, Meade and Wiesner-Hanks2004). In particular, these attributions lend themselves to a ‘natural’ or essentialist perspective on gender roles in the past, emphasizing the supposed universality of gender traits (Conkey & Spector Reference Conkey and Spector1984). If women's roles are seen to be difficult to reconstruct, unimportant, restricted by biology and broadly static, both chronologically and geographically, they cannot―unlike men―be viewed as productive agents in the archaeological record, responsible for the material we excavate and for the changes and developments in past societies (Wylie Reference Wylie, Gero and Conkey1991, 34). Nevertheless, such attributions continue to be made. Archaeological demography as a tool for the study of women and gender in the past obviates many of these problems. Nonetheless, using demographic principles as a framework for incorporating women into archaeological interpretations requires caveats, particularly regarding how this approach aligns with gender theory, both in archaeology and in allied disciplines.
Firstly, the implicit focus is on women's reproductive role: an approach which appears at odds with most research in gender archaeology. The focus on biological differences between men and women, and the prominence accorded to women's role in childbirth and childrearing, are hallmarks of earlier androcentric studies (Conkey & Spector Reference Conkey and Spector1984; Joyce Reference Joyce2008, 8–10). Differences in biology and reproductive roles were used to justify interpretations of the past in which men were active social agents and women were passive biological agents. This position is implicit in the few studies which exist on fertility in prehistoric societies, which use women's demographic roles either to focus on men's control over women, or set up a dichotomy between the ‘dependent female’ and ‘provisioning male’ (e.g. Bentley Reference Bentley and Wright1996; Mussi Reference Mussi and Roebroeks2007). However, regardless of its misuse in earlier androcentric studies, reproduction is an important and unavoidable part of the lives of women in natural fertility populations and, on this basis alone, should not be neglected (Whitehouse Reference Whitehouse, Hamilton, Whitehouse and Wright2007, 34–6).
Secondly, the use of demographic data, in common with other forms of archaeological data which have a biological basis (e.g. osteological contexts), is particularly susceptible to the ‘binary binds’ (Ghisleni et al. Reference Ghisleni, Jordan and Fioccoprile2016) of interpretation typical of second-wave gender research. There are two binaries: one that stems from the notion that there are only two sexes (male/female) and one from a nature/culture distinction between ‘sex’ and ‘gender’, with sex being a biological certainty and gender a cultural construction. These two binaries converge on a two-sex, two-gender model (Joyce Reference Joyce2008, 18) in which sex becomes a proxy for gender. More recent third-wave research has criticized both binaries, arguing against their heteronormative assumptions and static views of gender. Indeed, much third-wave gender research in archaeology and allied disciplines is explicitly concerned with moving beyond these binaries, emphasizing the fluidity of gender, sex and gender as a continuum of possibilities, and taking an increasingly intersectional view of gender in which the role of factors such as age, sexuality and social class in constructing identity are also considered (Aimers & Rutecki Reference Aimers and Rutecki2016; Geller Reference Geller2009; Ghisleni et al. Reference Ghisleni, Jordan and Fioccoprile2016; Stratton Reference Stratton2016). As part of this plurality, there has been a clear move away from a focus on the study of women to the study of men, women and multiple genders (Bolger Reference Bolger and Bolger2013).
Without ignoring both these theoretical advances and their legitimate criticisms of a simplified approach to the study of women and gender in the past, a case can still be made for a focus on women's roles, as well as adherence to the binaries of second-wave approaches, providing we are cognisant of their limitations. While there is a growing consensus among gender archaeologists that we have moved beyond the issue of the visibility of women in archaeological interpretations (e.g. Bolger Reference Bolger and Bolger2013, 8–9; Joyce Reference Joyce2008, 114), I am less convinced that this can be said of all periods, particularly early prehistory (see discussion below).
It is important to remember that the study of women is not the same as the study of gender (Whitehouse Reference Whitehouse, Hamilton, Whitehouse and Wright2007). While the demographic approach advocated here is primarily concerned with the archaeological visibility of women and the importance of women to demographic processes, this does not mean that any demographic study, archaeological or otherwise, automatically informs on gender on a societal level (Riley Reference Riley1998; Reference Riley1999). However, gender can be examined from demographic studies. Many features of women's lives are affected by wider societal gender ideas and practices, including their rights, employment and well-being; factors which have clear import to demographic variables, including fertility and mortality (Riley Reference Riley, Poston and Micklin2005). Similarly, while a demographic approach takes fertility as its starting point, it does not restrict the study of women's behaviours and actions to their biological choices, nor only offer insight into women as a biological category: both biology and culture are integral to demographic processes (Roth Reference Roth2004; Sear et al. Reference Sear, Lawson, Kaplan and Shenk2016).
The primary limitation of this approach is its propagation of a binary two-sex, two-gender model which may not necessarily reflect the full remit of gender relations in all past societies, and which, furthermore, presents a limited view of ‘women’ as those who are fertile and of childbearing age. Nonetheless, I do not argue that gender is limited to these two categories, or that biological sex is always an accurate proxy for gender; just that male and female reproductive roles are generally recognized within gender systems in some way. It is my contention that these caveats are outweighed by the methodological approach to gender archaeology which this demographic framework provides; a useful addition to a field characterized by long-standing tensions between a growing body of theory and a limited methodological toolkit (Hill Reference Hill1998).
A framework for inferring women and gender from archaeological demographic studies
Archaeological demography uses proxies, including summed probability distributions of 14C dates (SPDRD), settlement sizes and numbers of archaeological sites, to document long-term chronological and geographical trends in relative population size, density and growth (Chamberlain Reference Chamberlain2006; for an example, see Figure 2, this paper).Footnote 1 As women are the drivers of population change in small-scale societies, it follows that the long-term patterns we see in archaeological demographic studies are documenting changes in the demographic behaviour of women. Taking this one step further, these patterns can also be viewed as records of shifts in gender and social relations which are either a cause or consequence of these demographic changes. In this sense, demographic patterns become an archaeologically visible material aspect of women's behaviour and of gender in the past.
The key difficulty is reconciling the chronological scales of individual human behaviour and long-term trends. The fundamental time-scale of population dynamics is generational (20–30 years), which is impossible to document with the chronological resolution offered by the archaeological record. In addition, information about the specific processes of fertility, mortality and migration is lacking. However, knowing the exact rates of change in these demographic variables is less important than recognizing the directionality and the magnitude of the changes which the uniformitarian nature of demography tells us must lie behind long-term population growth and size patterns. We can infer change in women's social and demographic behaviours from patterns of collective population change. To do this, we need to understand the relationships between women's behaviour and variation in the most important demographic variables: fertility and infant and child mortality.
Demographic studies of contemporary small-scale natural fertility populations provide an excellent database for understanding these relationships. Underpinning many of these studies is the importance of women's energetics to fertility and infant mortality. Among contemporary small-scale populations, women's energetics is studied largely within the paradigm of human behavioural ecology (specifically evolutionary demography and life history theory), often focusing on the (conscious or unconscious) ways in which women adjust their behaviour to maximize their reproductive success (‘fitness’)Footnote 2 (e.g. Blurton Jones Reference Blurton Jones2016; Hill & Hurtado Reference Hill and Hurtado1996). Here, I am less concerned with the notion of fitness-increasing behaviour, or whether any choices were intentional or not. Rather, I wish to draw attention to the interplay between biology, the social and demographic behaviour of women, and population outcomes.
Women's energy, behaviour and demographic outcomes
The starting point of this interplay is understanding how women's energy influences fertility and juvenile mortality in natural fertility populations. The basic principle is that reproduction is energetically expensive and places strong energetic demands on a woman, both to support the pregnancy and then to support the subsequent lactation required to feed the child (Butte & King Reference Butte and King2005). In essence, while a woman is pregnant and breastfeeding, she is ‘metabolizing for two’ (i.e. for both herself and the foetus, and then, following the birth, the child: Ellison Reference Ellison2001, 94). Each successful pregnancy requires an estimated additional 50,000 calories above normal metabolic requirements, with breastfeeding alone requiring an additional 500–1000 calories of energy per day (Frisch Reference Frisch2002, 8–9). In natural fertility populations, the energetic constraints of having a child can be severe: among the Ju/’hoansi (!Kung) of Botswana, fertile women are likely to be either pregnant or lactating at almost all times during their childbearing years (Howell Reference Howell2010, 38). In short, energy plays a key role in a woman's reproductive function (see Ellison Reference Ellison2001 for an account of the exact physiological and hormonal mechanisms behind this) and reproductive function responds (within limits) to conditions of the social and natural environment (Jasienka Reference Jasienka2003).Footnote 3 The relationship between women's energy and reproductive function impacts fertility by affecting the probability of a pregnancy occurring (the rate of conception) and the time between successive pregnancies (through its effect on the length of the period of lactational amenorrhea or temporary infertility due to breastfeeding), and impacts infant mortality by influencing infant birth weight.
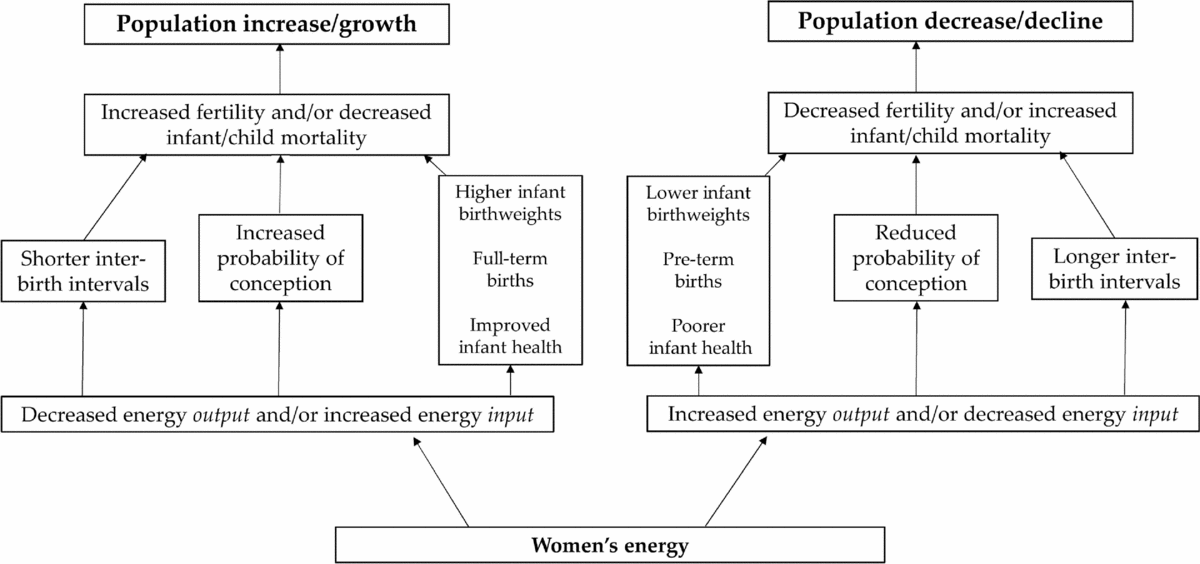
This allows us to make some simplified predictions about the relationships between energy intake, energy expenditure and fertility and infant/child mortality in natural fertility populations (Figure 1). Higher levels of energy expenditure of women should correlate with lower fertility and reductions in energy expenditure with higher fertility. Data from recent hunter-gatherer populations support this correlation, when energy expenditure is measured both in terms of residential mobility and activity or workload levels (e.g. Binford & Chasko Reference Binford, Chasko and Zubrow1976; Marlowe Reference Marlowe2001; Page et al. Reference Page, Viguier and Dyble2016; Pennington Reference Pennington, Panter-Brick, Layton and Rowley-Conwy2001; Roth Reference Roth1985; cf. Early & Headland Reference Early and Headland1998). Similarly, increased energy input should correlate with increased fertility and decreased energy input with decreased fertility. Several studies of foragers support this link using resource abundance measures, including environmental data and women's body weight,Footnote 4as proxies for energy input (e.g. Blurton Jones Reference Blurton Jones2016, 121, but see 329; Helle & Helama Reference Helle and Helama2007; Hill & Hurtado Reference Hill and Hurtado1996, 348; Marlowe Reference Marlowe2001; Page et al. Reference Page, Viguier and Dyble2016). However, the relative importance of energy expenditure and input to fertility can be difficult to untangle: for example, the low fertility rate of the Ju/’hoansi (in comparison with other natural fertility populations) has been attributed to both women's workload constraints (Bentley Reference Bentley1985; Blurton Jones Reference Blurton Jones1987; Hames & Draper Reference Hames and Draper2004) and limited calorie intake (Howell Reference Howell1979, ch. 10; Wilmsen Reference Wilmsen1982).
Schematic of the simplified relationships between women's energy, fertility, infant mortality and population growth/decline.

While the relationship between women's energy and infant mortality is a product of overall energy balance, it is most often examined with regard to the effect of maternal diet and nutrition. As a rule, underweight or energy-deprived mothers have babies born at lower birth weights (Frisch Reference Frisch1994, 115). Worldwide, low birth weight is a major predictor of infant mortality (United Nations Children's Fund and World Health Organisation 2004). Low birth weights are also more common among pre-term infants (babies born before 37 weeks of pregnancy), a factor which is also linked to low energy availability (Ellison Reference Ellison2003, 346; see also Dunsworth et al. Reference Dunsworth, Warrener, Deacon, Ellison and Pontzer2012). A good example of this connection between maternal and child health is seen among the Pumé of Venezuela. Here, infant mortality rates of the Savannah (hunter-gatherer) Pumé and the river (horticultural) Pumé were significantly different (rates of 346 and 132 per 1000 live births, respectively), despite similar access to modern medical care (Kramer & Greaves Reference Kramer and Greaves2007). The researchers attribute the reduced infant mortality rate of the river Pumé to the effect of greater overall maternal body mass and lack of periods of nutritional stress and weight loss, caused by a more reliable food supply.
In sum, the relationship between women's energy and reproduction affects three key biological processes that influence fertility and infant mortality, and ultimately population growth and size. While the mechanisms through which the relationships between women's energy, fertility, and infant mortality operate are primarily physiological, we should not underestimate the role of behaviour and culture. Sear et al. (Reference Sear, Lawson, Kaplan and Shenk2016) provide an excellent summary of this balance between behaviour and biology in their discussion of the decisions which affect how many children a woman has (total fertility). While sufficient energy reserves are required for a woman to have a child successfully, total fertility is the product of both her physiological condition and multiple interrelated decisions. Assuming a woman is both biologically able and wishes to have children, these decisions include: when to have the first child, when to stop having children, the ideal gap between children, when to partner and with whom, and whether to break off a partnership (and possibly to re-partner). Furthermore, these decisions do not occur in a vacuum, but are influenced by factors such as social norms surrounding reproduction and family structure, as well as more individual factors such as upbringing and behaviour of friends and family. Certain behavioural decisions (for example, whether or not to have children and when) admittedly represent less distinct choices in natural fertility societies than they do when effective contraception is available. Nonetheless, even in natural fertility societies, women are constrained by biology in their demographic choices, not controlled by it. Both biology and culture are crucial to demography and we cannot explain or analyse demographic data without taking both into account (Roth Reference Roth2004).
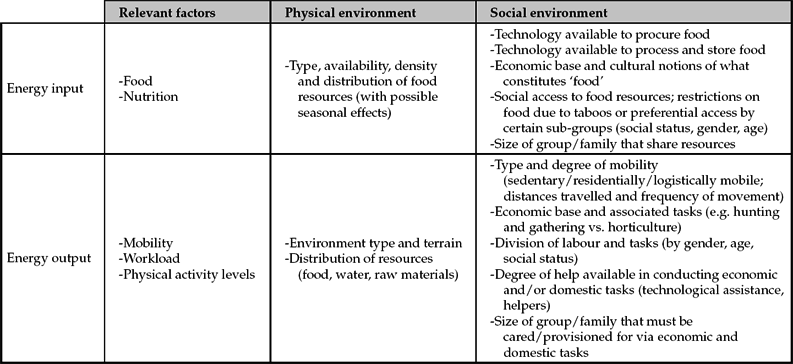
Crucially, even while women's energy is demographically important due to its physiological effects, the relevant mechanisms are responsive to behaviours which affect both energy intake and expenditure (Dufour & Sauther Reference Dufour and Sauther2002). The quantity and quality of available food resources (energy intake) and the mobility and workload patterns (energy expenditure) of women are both constrained and influenced by their social and physical environment. As discussed above, these environments, in turn, affect women's behaviours and decisions, which further influence the number of children women have and the survival rate of these children. Table 1 provides examples of cultural factors which influence women's energy availability and resultant fertility/infant mortality.
Examples of key features of the social and physical environment which influence women's energy availability.

These cultural factors can often combine with physiology to intensify directional demographic changes. A good example of this is Kramer and McMillan's (Reference Kramer and McMillan2006) study of longitudinal fertility changes among the Xculoc Maya, a group of subsistence maize farmers from the Yucatan peninsula. The introduction of a water-pump and mill in the 1970s increased women's labour efficiency, reducing the time spent in economic activities and, as a result, reducing energy expenditure. The Xculoc Maya women chose to reallocate their new-found spare time to less strenuous leisure activities, resulting in further reductions in energy expenditure. Concurrently, the introduction of this labour-saving technology reduced the importance of the economic contribution of women. This, in turn, led to women being encouraged to leave home and marry at a younger age. The combination of these physiological and cultural changes led to a drop in the average age of first birth, a common predictor of overall total fertility in natural fertility populations. This was indeed the case among the Xculoc women, where following this first early birth, the effect of these cultural and technological changes was an increased probability of conception at all ages and higher overall completed fertility (number of children).
This example also serves to remind us that cultural and societal norms affect many of the variables listed in Table 1, determining such factors as who performs which tasks, how living arrangements are structured, and who gains access to critical dietary resources. It is here that gender becomes important. Many features of the social environment are gendered, and their examination is not linked to the exclusive study of women, but also the interaction and relationships between different groups. Spielmann (Reference Spielmann1989), for example, highlights how social food taboos on women at key reproductive stages (e.g. menarche, pregnancy) as well as differential access to food resources between women and men in multiple hunter-gatherer societies, contribute to nutritional stress among women, with knock-on effects for fertility and infant mortality. Marlowe's (Reference Marlowe2001) study of hunter-gatherers showed that increased male provisioning to diet increased overall female fertility, either through allowing for earlier weaning of children, or through permitting women to spend less energy by reducing their overall foraging workload. Shennan (Reference Shennan2002, ch. 7) has suggested that this relationship would likely influence the choice of partners by women in small-scale societies; we could hypothesize that if this were the case, this would lead to or further entrench gendered divisions of labour or food-getting tasks in a sort of feedback loop.
The extent to which energetics explains any demographic patterns depends on the importance of this constraint on the local population. Specific social practices, such as the frequency and duration of marriage and the availability of suitable marriage partners, explain much fertility variation among modern-day contracepting societies (Sear et al. Reference Sear, Lawson, Kaplan and Shenk2016, 5), and are also key considerations in ethnographic natural fertility societies (e.g. Panter-Brick Reference Panter-Brick, Morbeck, Galloway and Zihlman1997, 235). However, based on comparisons with recent populations, it seems safe to assume that energetics played a fundamental demographic role in the past (e.g. Kelly Reference Kelly2013, 213), and that women were aware of the connection between their energetic status and reproductive outcomes. Furthermore, from an archaeological perspective, a focus on energetics has the additional advantage that many of the associated behaviours, such as mobility and diet, are directly inferable from the archaeological record.
Application to archaeological contexts
The relationships between women's energy and fertility (and to a lesser extent, infant and child mortality) have been fundamental in archaeological explanations of demographic change associated with the transition from hunting and gathering to farming, frequently referred to as the Neolithic Demographic Transition (NDT) (Bocquet-Appel Reference Bocquet-Appel2002; Reference Bocquet-Appel, Bocquet-Appel and Bar-Yosef2008; Reference Bocquet-Appel2011). Archaeological evidence, including summed probability distributions of radiocarbon dates, skeletal assemblages, and changing site sizes, documents a marked increase in world population growth and size driven by an increase in fertility (e.g. Downey et al. Reference Downey, Bocaege, Kerig, Edinborough and Shennan2014), followed by a subsequent increase in mortality and morbidity (poor health) (e.g. Bocquet-Appel & Bar Yosef Reference Bocquet-Appel, Bar-Yosef, Bocquet-Appel and Bar-Yosef2008). This shift from a hunter-gatherer economy to an agriculture economy is characterized by shifts in mobility and technology, as well as subsistence; variables which have been proposed as both the cause of the initial increase in fertility, and the later increase in mortality (Lambert Reference Lambert2009) (see Shennan Reference Shennan2018 for a comprehensive archaeological treatment of evolutionary demography and the NDT).
Following the principles described above, proponents of the NDT argue that sedentism permitted the initial fertility increase, with decreased mobility and the concomitant reduced need to carry children while moving camp reducing women's energy expenditure. The adoption of agriculture added to this shift in women's workload and nutrition, providing an increase in calorie-rich foods and a food resource which potentially permitted earlier infant weaning, leading to short birth intervals between children; two factors which likely further contributed to fertility increases (Bocquet-Appel Reference Bocquet-Appel, Bocquet-Appel and Bar-Yosef2008). Concurrently, sedentism and increased population density reduced health through facilitating the spread of bacteria and pathogens, increasing mortality rates (Cohen Reference Cohen, Bocquet-Appel and Bar-Yosef2008). Results of recent ethnographic fieldwork about the Agta of the Philippines (a hunter-gatherer population whose groups vary in their degree of sedentism and practice of cultivation) provide compelling evidence in support of this NDT scenario (Page et al. Reference Page, Viguier and Dyble2016).
Demography, women and gender in the Upper Palaeolithic
The Neolithic Demographic Transition has to date been the research area where the intersection between demography and women's energy has been most thoroughly explored. In the Pleistocene, this intersection has also been examined in terms of wider trends in hominin evolution (e.g. Aiello & Key Reference Aiello and Key2002; Snodgrass & Leonard Reference Snodgrass and Leonard2009). However, specific references to women's lives and behaviours, and especially gender, are limited (Peterson Reference Peterson2010, 254; for a discussion on gender in early agricultural societies based on non-archaeological data, see Hansen et al. Reference Hansen, Jensen and Skovsgaard2015). While there is some conjecture involved, one of the main advantages of this demographic approach is that it forms a useful tool in instances where the data required to examine gender through more conventional archaeological methods are lacking. Using data from the Upper Palaeolithic (c. 40,000–12,000 cal. bp) of southwestern France, here I provide a brief demonstration of interpretation.
The Palaeolithic has long been recognized as particularly susceptible to androcentric interpretations (Conkey & Spector Reference Conkey and Spector1984, 6). More so than any other period, women are still implicitly (if not explicitly) absent from much archaeological interpretation and representation, and gender is frequently ignored in discussions of Palaeolithic society. This can partly be explained by the coarse resolution of many Palaeolithic sites and contexts, which discourages the broader consideration of individuals and agency (Conkey Reference Conkey, Gero and Conkey1991, 57–8; Dobres Reference Dobres1995). The neglect of women and gender is also compounded by several other features of the record, and long-standing assumptions about the nature of Palaeolithic life, including: an impoverished material culture and burial record (which largely prevents the application of some of the more nuanced approaches to gender developed in later periods); persistent ‘Man the Hunter’ narratives of subsistence and social organization (Conkey Reference Conkey and Bolger2013; Hager Reference Hager and Hager1997; Zihlman Reference Zihlman and Hager1997; Reference Zihlman and Bolger2013); and assumptions that men were the primary manufacturers of both the stone tools which dominate the record (Arthur Reference Arthur2010; Brumbach & Jarvenpa Reference Brumbach, Jarvenpa and Nelson2006; Finlay Reference Finlay and Bolger2013; Gero Reference Gero, Gero and Conkey1991) and the impressive parietal and portable art of the Upper Palaeolithic (Fritz et al. Reference Fritz, Tosello and Conkey2016, 1310–1316; Gifford-Gonzalez Reference Gifford-Gonzalez1993, 37; McCoid & McDermott Reference McCoid and McDermott1996). The question has also been raised as to whether gender as a symbolic and cultural concept could have existed in earlier Palaeolithic archaic hominin societies (Balme & Bowdler Reference Balme and Bowdler2006; Conkey & Gero Reference Conkey and Gero1997, 418; Dobres Reference Dobres, Meade and Wiesner-Hanks2004).
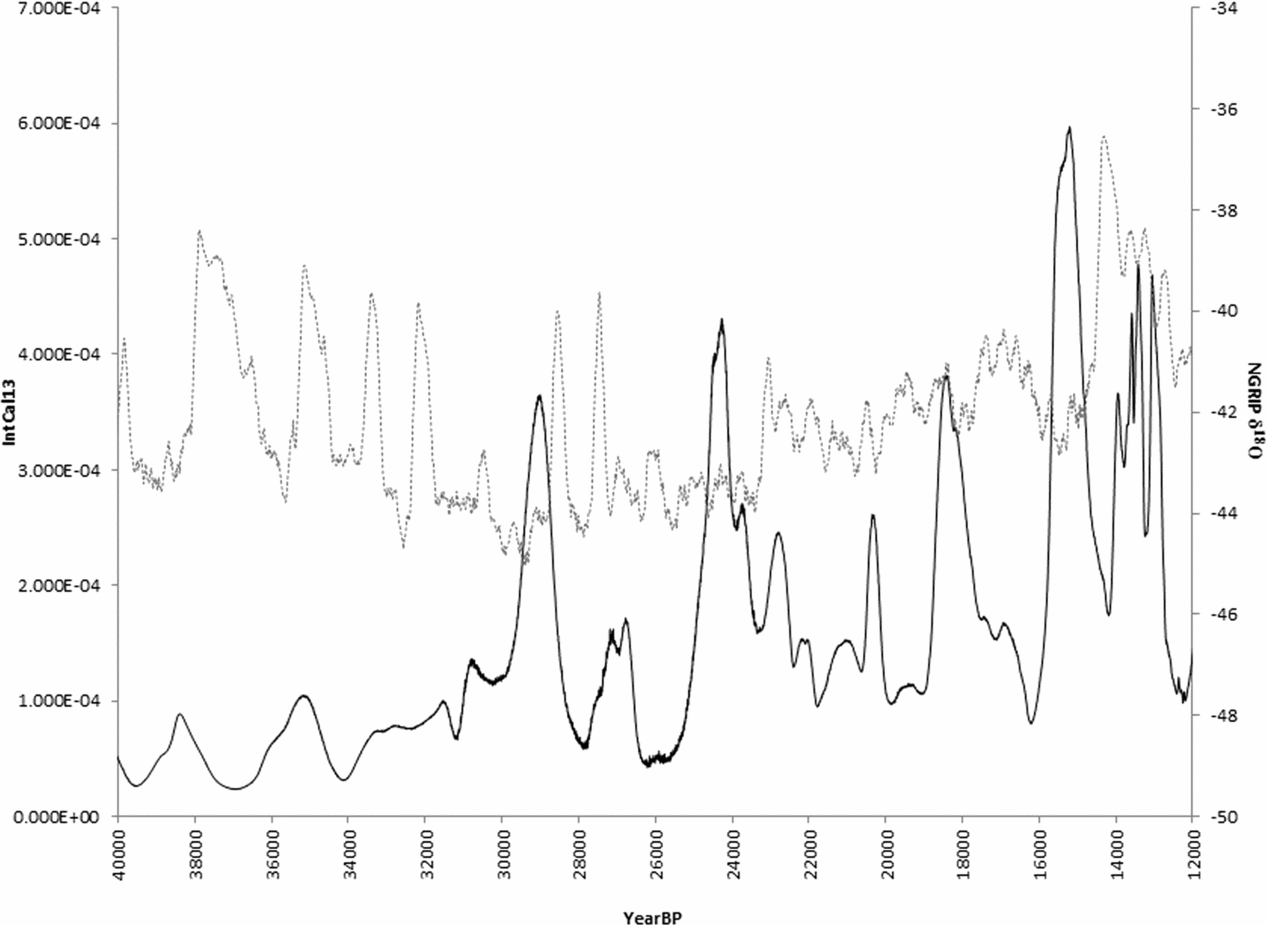
Figure 2 presents the results of an archaeological demographic study of the population history of the Upper Palaeolithic hunter-gatherer populations of southwestern France (French & Collins Reference French and Collins2015), using summed probability distributions of radiocarbon dates (SPDRD) as a demographic proxy and comparing this distribution to the global temperature variations documented in the NGRIP ice core (Andersen et al. Reference Andersen, Svensson and Johnsen2006). The use of radiocarbon dates as a demographic proxy in archaeology was pioneered by Rick (Reference Rick1987), and has been subsequently developed into a popular and robust method for analysing long-term demographic trends.
Demographic fluctuations of relative population size during the Upper Palaeolithic of southwestern France. Population fluctuations are indicated by a summed probability distribution of radiocarbon dates from the region calibrated with IntCal 13 (solid line). These are compared with the NGRIP δ18O curve (dotted line, smoothed with a moving average filter with 200-year window). (Figure from French & Collins Reference French and Collins2015, fig. 8. See French & Collins Reference French and Collins2015 for details of the methodology.)

The premise of the method is straightforward: because more people produce more datable material (i.e. cultural carbon), relative temporal changes in the frequency and distribution of 14C dates should reflect corresponding proportional variations in past population sizes and densities, with peaks indicating periods of increased relative population and troughs indicating periods of decreased population. However, there are well-documented biases which can intervene with the above assumption, and past behaviours could have altered the simple correlation between number of people and the strength of the 14C signature (Williams Reference Williams2012). There were several ways in which the effects of bias were tested and accounted for in the distribution presented in Figure 2. Firstly, site-specific Bayesian models and outlier analysis were used to ‘correct’ the effect of unreliable or erroneous dates on the pattern produced. Secondly, the probability distributions calculated for each date were normalized through averaging within sites to prevent well-dated sites being over-represented and driving the resultant distribution. A simulated dataset was also created to test against the resultant SPDRD to ensure that the signal produced was not simply a reflection of the radiocarbon calibration curve. The effect of time-transgressive taphonomic loss of quantities of datable material is harder to assess, but in this case the data suggest that taphonomic bias had little effect on the overall radiocarbon date distribution (see French & Collins Reference French and Collins2015 and supplementary material for a detailed discussion). As with much palaeodemographic research using SPDRDs, the main source of uncertainty is the possible influence of chronological changes in mobility/land-use strategy on the shape of the distribution (e.g. Attenbrow Reference Attenbrow2006; Naudinot et al. Reference Naudinot, Tomasso, Tozzi and Peresani2014). While this possibility cannot be excluded, the broad correspondence between the shape of the SPDRD and the chronological distribution of another common palaeodemographic proxy (archaeological site counts) strengthens the interpretation of relative demographic change as the cause of the observed pattern (French Reference French2015; French & Collins Reference French and Collins2015).
The demographic pattern documented in Figure 2 is highly variable, showing numerous peaks and troughs in relative population size over the course of the Upper Palaeolithic in Southwestern France. While migration may also play a role (a point to which we will return), in keeping with demographic theory, it is assumed that long-term fluctuations are primarily driven by changing patterns of fertility and/or mortality, of which infant and child mortality would have the biggest impact. Following the assumptions outlined above, Figure 2 therefore presents a long-term record of changes in women's demographic behaviour. The most important initial benefit of this approach is that it automatically prevents us from falling into the common trap of viewing women's behaviour (and following that, gender roles and relations) as inherently static (Wylie Reference Wylie, Gero and Conkey1991, 34).
What do we know about the lives of women and of gender relations in the Upper Palaeolithic in southwestern France? We will focus on the later part of the sequence: the Magdalenian and Azilian, which covers the period from after the last glacial maximum to the end of the Pleistocene. Very few studies move beyond the general assumptions described above which characterize the Palaeolithic as a whole: that men hunt, while women gather, that men made stone tools and women manufactured or worked with perishable items (nets, traps, furs). Even those works which explicitly examine or critique these assumptions often still ultimately rely on the gendering of artefacts or activities to inform on women in the Magdalenian (e.g. Keeley Reference Keeley, Zubrow, Audouze and Enloe2010; Owen Reference Owen2005; see Conkey Reference Conkey, Gero and Conkey1991, for a counter-example). Rare examples of skeletal remains and other direct biological markers provide ‘snapshots’ of women's lives during the period. For example, the rich set of grave goods found with the skeleton of a Magdalenian woman at the site of Saint-Germain-la-Rivière has been interpreted as indicating a privileged social status (Vanhaeren & d'Errico Reference Vanhaeren and d'Errico2005). Measurements of hand stencils and finger flutings on cave walls provide direct evidence of women as producers of some of the famous late glacial art in the region (Snow Reference Snow2006; Van Gelder & Sharpe Reference Van Gelder and Sharpe2009).
There are two main problems with the above examples. Firstly, they are either too generic in their envisioning of women and gender relations to tell us anything about these variables in the Magdalenian of southwestern France, or they are too specific and tied to one individual or site. Secondly, they still work on the assumption that we require ‘proof’ of the presence of women in the archaeological record (in a way that is not required of men) in order to say anything about their lives. The demographic data presented in Figure 2 obviates these problems.
As is the case throughout the Upper Palaeolithic sequence, population size fluctuates considerably throughout the Magdalenian and Azilian. Given that this period spans many thousands of years, as well as many climatic and cultural shifts, this is unsurprising. Let us focus specifically on the period of population growth ~19,000 cal. bp, culminating in the peak documented ~18,000 cal. bp. Examining this peak in its wider archaeological context allows us to hypothesize about the changes in women's lives and in gender relations, which either brought about, or reflect, this demographic change.
The climatic and environmental context is an excellent starting point as resource availability and distribution affect variables relevant to both energy input and energy output, such as food and mobility (Table 1). The population growth ~19,000–18,000 cal. bp occurred during the early stages of Heinrich event 1 and Greenland Stadial 2, although at a finer scale it notably correlates with a period of warming within this cold phase (Figure 2). This relative (if slight) improvement might be important, due to the link between increased fertility and increased resource abundance, for which temperature can act as a reasonable proxy. At a broad scale, climatic conditions also affect forager mobility, with increased residential mobility often acting as a buffering response against resource uncertainty and decreased productivity which can be caused by climatic cooling (Grove Reference Grove2009). In this instance, relative warming may have led to a reduction of residential mobility of Magdalenian women (and hence a reduction in energy expenditure and resultant fertility increases). However, we need to be careful not to read too much into this scenario: comparisons of the relationship between prevailing climatic conditions and population across the complete Upper Palaeolithic sequence shown in Figure 2 revealed a negative (and counter-intuitive) relationship between population and temperature (French & Collins Reference French and Collins2015), and the relative impact of temperature increases on local environments is difficult to assess. Other variables which affect women's energy should be considered.
Results of a recent dating programme suggest that the period ~19,000–18,000 cal. bp corresponds with the start of the Middle Magdalenian in the region (Barshay-Szmidt et al. Reference Barshay-Szmidt, Costamagno and Henry-Gambier2016; cf. French & Collins Reference French and Collins2015). Several technological and economic changes are reported for this period, including the increased standardization of lithic tool kits, increased distances of lithic raw material transfer, increases in the intensity of bone and antler working, a change in hafting type, and the appearance of spear throwers (Langlais et al. Reference Langlais, Caux, Delvigne, Gourc, Normand and Sánchez de la Torre2016; Langley et al. Reference Langley, Pétillon, Christensen and Langley2016; Pétillon Reference Pétillon2016). In the neighbouring region of the Pyrenees, Langlais (Reference Langlais2011) has interpreted these changes as reflecting the increased sedentism of nomadic groups. He contrasts the standardization of Middle Magdalenian lithics with the more flexible technological strategy seen in the Lower Magdalenian which was designed to minimize risk of tool failure among more mobile populations. Langlais also suggests that lithic production has been divided into two technological domains: one for hunting tools and one for what he terms ‘domestic’ tools, and that the increase in lithic raw material transfer suggests changes in the territorial organization of local groups.
Many elements of this evidence could account for the changes in women's energy which lie behind the demographic pattern. Increased sedentism would decrease women's energy expenditure, contributing to fertility increases and population growth. Wider exchange networks might improve economic security, limiting the negative demographic impact of food shortages both on fertility and indirectly on infant/child survival rates. The addition of the spear thrower into the technological repertoire, and the possible distinction between hunting tools and those for other purposes, might have improved the hunting yield available to group members and/or reduced the effort spent in hunting.Footnote 5 More speculatively, one could posit a scenario whereby women became primarily responsible for the manufacture of the bone and antler tools; an economic activity which requires less physical exertion than hunting and gathering, and for which the intensification of use and production broadly coincides with the demographic peak documented.
This brief example illustrates the ways in which demographic data, used in conjunction with data on classic archaeological variables such as economy, subsistence and mobility, can serve as a tool to study women and gender in the past. While some of the specifics of the, admittedly simplistic, scenarios outlined above are often difficult to prove, they are firmly grounded in biological principles and permit informed theorization about the changes in women's lives which would manifest in demographic outcomes. Furthermore, this demographic approach has moved the discussion of women's roles and gender immediately beyond the standard Palaeolithic interpretations, allowing for the consideration of a wider range of possibilities.
A few caveats are noteworthy here. The first is that interpretation in these terms relies firstly on the accuracy and reliability of the demographic reconstruction. In small populations, such as those which characterized early prehistory, stochastic or random variation is also an important factor in population fluctuations, although in the long term these are likely to be smoothed out. The second is the effect of factors other than those related to women's energy on the demographic patterns seen. In terms of the effect of social choices and behaviours, such as changes in marriage practices, we are left in the familiar archaeological scenario of being unable to test such hypotheses with the available data. Nonetheless, these social variables might be particularly profitably included in the analysis in instances where the results of archaeological demographic studies show a period of relative population change, but no concomitant changes in the more archaeologically visible variables related to changes in women's energy (such as mobility, activities, climate, subsistence) which would support the interpretation of the demographic pattern along these lines.
A more problematic source of equifinality of interpretation is the effect of migration on patterns of relative population size. The possibility that changes in migration rather than natural increase are the cause of population fluctuations is particularly pertinent for southwestern France as this region acted as a population refugium during the last glacial maximum, and could well have functioned in a similar manner during other Late Pleistocene cold stages (French & Collins Reference French and Collins2015). However, testing these alternatives is difficult and the relevant variables of fertility, mortality and migration are often not directly measurable from the archaeological record. For example, even where large skeletal assemblages are available from which age-at-death distributions can be created, the calculation of mortality rates in archaeological contexts is fraught with difficulties (Meindl & Russell Reference Meindl and Russell1998). We are on a slightly firmer footing with fertility. As the birth rate has a stronger effect on population age structure than the death rate (Sattenspiel & Harpending Reference Sattenspiel and Harpending1983), the ratio of adult to child burials can act as a broad proxy for fertility measures (Bocquet-Appel & Masset Reference Bocquet-Appel and Masset1982; McFadden & Oxenham Reference McFadden and Oxenham2018). Incontrovertible evidence of large-scale migration into an area might include the sudden and widespread appearance of novel material and behavioural forms, and/or biological or genetic evidence for incoming groups who differ from those seen in the region before (for example, with regard to isotopic signatures, haplogroups, etc.). The archaeological signature of a migration out of a region is less clear, but could include the abandonment of settlements, a reduction in cemetery size, or the absence of specific social groups in skeletal assemblages (e.g. Baitzel & Goldstein Reference Baitzel and Goldstein2016; Burmeister Reference Burmeister2000; Furholt Reference Furholt2018; Price et al. Reference Price, Burton and Bentley2002). In any event, no direct data on fertility, mortality, or migration are available for the current case study, and are likely to be sparse across much of prehistory, at least until the establishment of more permanent settlements and attendant cemeteries. This is particularly unfortunate, as it is these early stages of human prehistory which arguably have the most restricted view of women in the past, and have the most to gain from the interpretative approach advocated here. The inability to distinguish between net increase and net migration as a cause of population patterns is seen across many palaeodemographic studies (e.g. Porčič & Nikolić Reference Porčič and Nikolić2016). Until this can be resolved, I suggest that in most archaeological contexts the null hypothesis should be changes in fertility and/or infant and child mortality as the primary cause of the population change, given that in the long term (i.e. over centuries or more) ‘natural increase almost invariably dominates net migration’ (Hinde Reference Hinde, Macbeth and Collinson2002, 33).
Conclusion: demography and gender
Archaeological demography is a research area which has much to offer the study of women and gender in the past. The long-term patterns of population change documented through archaeological demographic research are the outcome of multiple individual demographic decisions and processes, driven by changes in female fertility and infant and juvenile mortality. Changes in the number of children that women in small-scale natural fertility population have, and the survival of these children, are strongly linked with both the lives and behaviour of women and gender relations and practices in the societies in which they live. As such, correlations between demographic events and changes in other variables, including settlement patterns, diet, mobility and environment, should be interpreted with explicit reference to the shifts in the social, economic, or political lives of women which either brought about or reflect this demographic change, and which can, properly contextualized, inform on gender relations in the past. While this is arguably quite a broad research strategy, as an addition to the gender archaeology toolkit, archaeological demography has two clear advantages: it does not rely on questionable notions of gender attribution of artefacts or activities derived from ethnographic comparisons, and it allows for the consideration of gender and women's roles in periods or regions where other lines of evidence (such as mortuary remains) are lacking. The adoption of this approach would also benefit archaeological demography, a field whose interpretative focus often ignores social factors in the explanation of demographic change and is dominated by economic models of carrying capacity and environmental constraints (although I am not advocating for the irrelevance of these variables, nor suggesting that they be abandoned to concentrate solely on women's behaviour).
One of the biggest challenges with this line of enquiry is chronology. It is often difficult to demonstrate correlations between demographic shifts and shifts in behaviours and/or environment, let alone be in a position to distinguish between cause and effect. While this challenge is more surmountable in later contexts than in the Palaeolithic example discussed here, it still poses unfortunate limits on the analysis of the relationships between demographic change, women's lives and gender relations in the past. The uniformitarian nature of demographic processes nonetheless allows for the development of plausible inferences grounded in demographic and biological theory. Furthermore, what we lose in our understanding of the exact mechanisms of cause/effect we gain in the exploration of longer-term trends. At this early stage of the pursuit of this line of enquiry this seems like an acceptable compromise, especially in light of the very static view of women's behaviour and gendered practices which continues to characterize much prehistory.
Explicitly linking individual reproductive behaviours, and the social environment in which they occurred, with the visible results of long-term population change is also an important methodological consideration. One promising approach is the use of agent-based modelling, as employed by Read (Reference Read2003) in his simulation of decision making, birth spacing and marriage rules among !Kung San women. Another relevant development is the improvement of techniques to reconstruct breastfeeding and weaning practices (and, from there, infer the fertility variable of inter-birth intervals) from osteological remains in archaeological contexts (King et al. Reference King, Millard, Gröcke, Standen, Arriaza and Halcrow2017; Tsutaya & Yoneda Reference Tsutaya and Yoneda2015). The more frequent use of SPDRDs explicitly to measure population growth rates, rather than just changes in relative size/density (e.g. Brown Reference Brown2017; Kelly et al. Reference Kelly, Surovell, Shuman and Smith2013; Zahid et al. Reference Zahid, Robinson and Kelly2016), is also a welcome development; the relationship between changes in fertility/mortality rates and population growth being more direct than the relationship between these variables and population size. Finally, the increased engagement by archaeological demographers with evolutionary demography and life-history theory (as promoted by Shennan Reference Shennan2018) is a vital step towards the development of further methodologies examining the crucial link between reproductive behaviours, culture, and long-term demographic trends.
Women are the drivers of demographic change and are therefore intrinsic to the results of demographic research. The uniformitarian nature of demographic processes means that archaeological demographic data a priori invoke women in their analysis. Furthermore, the dynamic nature of demographic processes and the archaeological focus on regional population change prevent the assumption that women's roles in the past were static, or that gender relations and practices were the same in all past societies. Through explicitly acknowledging the fundamental role women play in demographic regimes, archaeological demography can help move us away from simply ‘finding’ women; restoring them to their rightful place as obvious and active contributors to both past societies and the resultant archaeological record, and providing a framework in which gender can be examined within a growing area of mainstream archaeological enquiry.
Acknowledgements
This research is part of the project ‘The Palaeolithic of Europe: A Demographic and Social Prehistory’ funded by a Leverhulme Trust Early Career Fellowship (grant number: ECF-2016-128) held at University College London. A version of this paper was presented at the 2017 meetings of the Society for American Archaeology in Vancouver. Many thanks to Christina Collins, Sheila Kohring, Dominic Walker and two anonymous reviewers for helpful comments on earlier drafts. Special thanks are owed to John Robb for long discussions on many of the ideas presented in this paper, as well as specific critiques which have substantially improved the manuscript.