Introduction
Nitrogen (N) accumulation during the crop growth period (from early growth stages, to canopy closure) is driven by soil N, while at subsequent growth stages, most of the N in new leaves comes from the lower leaves as a consequence of canopy senesce. Several non-destructive diagnostic tools have been used to determine plant N status, such as SPAD (Minolta crop, Ramsey, NJ) and GreenSeeker (Trimble Navigation Ltd. Sunnyvale, CA, USA) (Peng et al., 1996; Zhu et al., 2008).
Previous studies have used the SPAD readings to predict chlorophyll content or plant N status of several crop species including rice (Oryza sativa) and winter wheat (Triticum aestivum) (Bürling et al., Reference Bürling, Hunsche and Noga2011). However, several factors such as plant growth stage, cultivar, specific leaf weight, leaf thickness, leaf position on the plant, measurement location on a leaf as well as environmental stresses and solar radiation (Yuan et al., 2016) could significantly affect chlorophyll meter readings. For irrigated rice, the presence of water in the field may affect the performance of the GreenSeeker sensor. It has been found that spectral reflectance decreased with increased water depth in paddy fields (Kanke et al., Reference Kanke, Tubaña, Dalen and Harrell2016), and the influence of water was more significant at early growth stages of rice (Shikada and Miyakita, Reference Shikada and Miyakita1992). In a recent study, Kanke et al., also evaluated the performance of the GreenSeeker sensor for estimating rice biomass and yield at different view angles. Correlation between NDVI values at late-tillering stage divided by thermal units were used for in-season N requirements in rice (Chen et al., 2011).
SPAD and NDVI values have been widely used as the standard estimators of crop N status. Chl a newly developed parameter established by Gitelson et al. (Reference Gitelson, Viña, Ciganda, Rundquist and Arkebauer2005) might provide a better estimation of crop N status and chlorophyll concentration in rice canopy during the growing season because it is obtained by multiplying SPAD values of upper leaves and the green leaf area index (LAI). The Chl index was derived by relating analytically obtained leaf chlorophyll content to the model [(R750–800/R710–730)–1], where R750–800 and R710–730 are reflectance in the near infra-red (NIR) and red edge ranges, respectively. Additionally, the study established the close relationships between the model [(RNIR/Rλ1)−1] and Chl in maize and soybean canopy (Gitelson et al., Reference Gitelson, Viña, Ciganda, Rundquist and Arkebauer2005). However, no attempt has been made to establish Chl models for estimation of N status and chlorophyll content in rice canopy.
Therefore, the present study was aimed to evaluate the SPAD and GreenSeeker values to predict the crop N status for optimum rice production, to establish the relationships between the SPAD and NDVI values and LNC as well as to explore the newly developed Chl model for better N diagnosis management during the growth period of rice.
Materials and methods
Site description and experimental layout
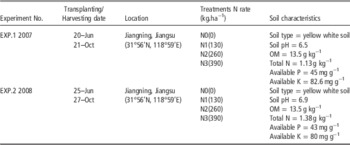
Three field experiments were conducted on clay loam soil in Jiangsu province located in the east China. Site characteristics and cropping practices are described in Table 1.
Basic information regarding three field experiments

Experiment 1 and 2: Two japonica rice hybrids 9915 and 27123 were planted on 18th May, and transplanted on 20th June with a planting density 266,000 seedling ha−1 in 2007, and two japonica rice hybrids Wunxiangjing14 and 27123 were planted on 24th May , and transplanted on 25th June in 2008. Four N treatments were applied, with 40% N applied at pre planting (19th June 2007, 19th June 2008), and the rest of the N was top dressed in three splits at tillering (10%) on 4th July (8th July 2008), at jointing (25%) on 31th July (3th August 2008), and at booting (25%) on 12th August (16th August 2008). Phosphatic (P2O5, 135 kg.hm−2) and half of potassium (K2O, 203 kg.hm−2) fertilizers were incorporated into the soil before transplanting as mono-calcium. All other crop management practices were applied according to local agricultural practices to allow potential production.
Growth analysis was performed by sampling five plants from each plot from active tillering to maturity at intervals of 7–10 days, starting from 26 days after transplanting (DAT) in 2007 and 30 DAT in 2008. Each sampled component was oven-dried at 80°C for 72 h before weighing. Each component was then ground to powder to pass through a 1-mm sieve in a mill, and stored at room temperature for further chemical analysis.
Green leaf area was measured with the help of Li-2000 (Li-Cor, Inr, Lincoln, NE) and expressed as leaf area index (LAI). Leaf nitrogen concentration (LNC) was determined by micro-Kjeldahl method. Leaf nitrogen accumulation (LNA) at each growth seasons was calculated as follows: LNA=LW*LN/100; where LW is dry weights of leaves, LN is N concentration of leaves.
The data were analyzed to determine the Chl according to the method of Gitelson et al. Reference Gitelson, Viña, Ciganda, Rundquist and Arkebauer2005. Least significant difference (LSD) test at 5% level of significance was used to assess difference of LNC under different N rates using Statistical Product and Service Solutions Software (SPSS 20.0; IBM, U.S.). The regression between LNC and SPAD readings and NDVI and Chl values were conducted using Origin 8.0 (Origin 8.0, Origin Lab, USA).
Results
Leaf nitrogen accumulation and time-course of SPAD readings and NDVI in relation to nitrogen fertilization and rice cultivars.
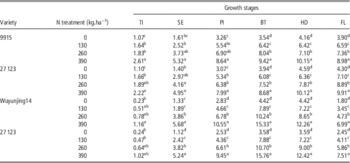
Leaf nitrogen accumulation was significantly affected by N fertilization across varieties and developmental stages and varied from 0.23 to 15.76 g.m−2 (Table 2). LNA generally increased with increasing N fertilization, although this increase was not always statistically significant, especially in pre-growth seasons.
Characteristics of leaf nitrogen accumulation at different growth stages under different N treatments

Note: Values followed by a different letter are significant at 5% probability level using LSD method.
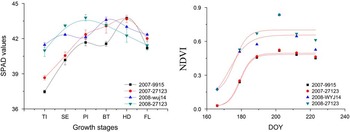
In both experiments the SPAD values of three varieties showed different trends throughout the growing season. When N fertilizer was applied in both years, SPAD readings ranged from 37.5 to 43.8, depending on cultivar and growth stages (Fig. 1). This difference was mainly attributed to the climate and basic fertility, especially in the variety of 27123. In 2007, the trend of 27123’s SPAD values kept increasing from tillering (TI) to heading (HD) and then a decreased was observed after HD. In contrast, during 2008, this decrease was observed after panicle initiation (PI). No significant difference was observed for the SPAD values of 9915, 27123 and wuxiangjing14 from TI to HD, which may be due to the common japonica-type rice. The trends of our results of SPAD readings were in consensus with previous reports.
Time series changes of (left) SPAD readings (±1 SE) and (right) NDVI for three fully fertilized rice cultivars: “9915”, “27123”, “wyj14” and “27123” used in experiment 1, 2 with a N level of 120 kg N ha−1.

The NDVI values of the three varieties showed similar logistic trends in both years at different growth stages when N2 was applied. NDVI ranged from 0.03 to 0.84, depending on cultivar and growth stages (Fig. 2). However, the NDVI values in 2008 were higher than the values of 2007, this may be due to the different temperatures or sensor settings during growth period in both years. Thus, only new indicators are discussed below.
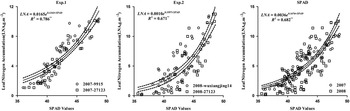
Regression fits between LNA and SPAD values at different growth stages. “9915”, “27123”, “wyj14” and “27123” are different rice cultivars.

The evaluation of SPAD readings and GreenSeeker values for the assessment of LNA
Leaf nitrogen accumulation was correlated with SPAD values. However, the relationship was not unique, since within each experiment, a given LNA was associated with progressively changing SPAD values in different years. In both cases, exponential regressions that were fitted on all the sub-datasets were significant and explained a high proportion of observed variance (R2=0.67~0.79). The LNA was positively related to SPAD values (Exp.1: LNA= 0.0165e0.1343SPAD, R2=0.79**; Exp.2: LNA=0.0010e0.1957SPAD, R2=0.67**; model: LNA=0.0036e0.1676SPAD, R2=0.68**, p<0.01, Fig. 2).
There were correlations between LNA and NDVI with different cultivars at different soil types and different N stress. Some cultivars such as 27123 may respond the change of temperature by a significant increase in NDVI. Significant relations (Exp.1: LNA=0.9548e2.4504NDVI, R2=0.76***; Exp.2: LNA= 1.495e2.785NDVI, R2=0.89***; model: LNA=1.896e1.856NDVI, R2=0.56**, p<0.01, Fig. 3) were observed in both experiments.
Regression fits between LNA and Greenseeker values (NDVI) at different growth stages. “9915”, “27123”, “wyj14” and “27123” are different rice cultivars. b=Red/NIR.

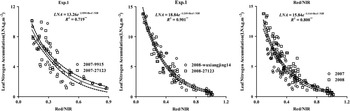
Figure 4 is a scatter diagram for LNA versus Red/NIR values obtained in this study. The data points were grouped according to N treatments. A strong correlation between LNC and Red/NIR values (Exp.1: LNA=18.15e−3.563Red/NIR, R2=0.88***; Exp.2: LNA=27.189e−4.032Red/NIR, R2=0.90***) was observed for each N treatment. Combining all N treatments data points resulted in a highly significant correlation (R2=0.75**, P<0.01) between LNA and Red/NIR (model: LNA=15.84e−3.114Red/NIR, R2=0.80**, p<0.01, Fig. 5). Thus, SPAD values and GreenSeeker values can be used as a predictor of N status
Regression fits between LNA and Greenseeker values (Red/NIR) at different growth stages. “9915”, “27123”, “wyj14” and “27123” are different rice cultivars.

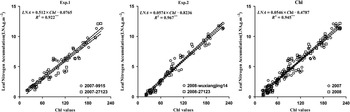
Linear regression fitted between Chl and LNA at different years (2007, 2008). And relationship between Chl and LNA under varied N rates from tillering (TI) to flowering (FL) growth stages using data collected from experiment 1 and 2.

Relationship between leaf nitrogen accumulation and Chl values
Chlorophyll concentration could be used to diagnose the N status of rice, however, little effort has been made to explore the correlation between N accumulation and chlorophyll concentration. The linear regression analyses was performed to compare the relationships of Chl to LNA, at overall growth stages in both years, and the most stable and generally applicable duration model was selected. Linear correlation analysis indicated that LNA in rice was related positively to Chl, with 0.01 significance levels in both years.
To develop a new model for monitoring N status, data of three rice cultivars from two years field experiments were used to describe the relationships of Chl to LNA. The R 2 values for these relationships were 0.93 and 0.94, respectively (P<0.01; Fig. 5). The slopes for the regression equations representing Chl and LNA in 2007, 2008 were 0.051 and 0.057, respectively. The equation to LNA was (0.0546×Chl)–0.48 (R 2=0.94***, p<0.001).
Discussion
The objective of this study was to evaluate two different optical instruments for the diagnosis of the rice N status. Rapidly determining LNA is also necessary because it is a useful indicator for estimating the N requirement of rice. Few researches focused on such evaluating such responses and many remotely sensed response to LNA were identified. In 2008, Zhu et al. (Reference Zhu, Yao, Tian, Liu and Cao2008) reported that the vegetation indices were related to the LNA of rice (R2>0.80) and wheat (R2>0.84).
Since the chlorophyll meter records only the single point data from leaf on an individual plant several measurements would be needed to average N status of the whole canopy precisely. Jia et al. (Reference Jia, Guo, Huang and Jia2008) showed that the NDVI saturated threshold was about 0.8. In northwest China, Subash et al. (Reference Subash, Mohan and Banukumar2011) noticed that the NDVI reached saturation point and no further significant increase in NDVI with increase of rainfall. However, single SPAD or LAI values cannot fully reflect the canopy dynamics (Wood et al., Reference Wood, Welsh, Godwin, Taylor, Earl and Knight2003).
Changes in leaf chlorophyll produce large differences in leaf reflectance and transmittance spectra, however, canopy reflectance is also strongly affected by other factors (e.g., canopy architecture, chlorophyll distribution into the canopy, LAI, and soil background) that mask and confound changes in canopy reflectance caused by leaf chlorophyll. It makes chlorophyll retrieval at canopy level complicated and challenging. The present study attempted to minimize these issues relating SPAD readings and LAI values to predict LNA at the canopy levels, where SPAD readings show a single leaf specific growth dynamics on an individual plant and LAI values represent the growth of a population. Meanwhile, LNA is an indicator that includes N content of plant and the plant biomass. Thus, in estimating LNA, our study clearly proved that the effect of single SPAD readings and vegetation indices saturated could not be reduced. In response to the N nutrition by Chl, the impact of the dilution effect could be eliminated as it may be integral effect. However, such consistency deserves to be corroborated on a broader cultivar spectrum, as well as in other species, with further experimentation.
Conclusion
This study concluded that the Chl model can be applied for N diagnosis in rice grown in East China. The Chl calculated from LNA was a reliable indicator of leaf N status during the growth period. SPAD readings, NDVI, Red/NIR and Chl values were significantly related to LNA, however, the parameters of the model varied with varieties, developmental stages and years. The Chl values were more closely related to LNA as compared to the relationship between the SPAD or Greenseeker values and LNA during the growing season. In conclusion, these findings proved that Chl values could be used to estimate the N status of rice.
Acknowledgements
The authors thank the National Engineering and Technology Center for Information Agriculture for providing field data. We are grateful to Dr. Tahir and others, who have helped with the paper, for providing excellent facilities for conducting the field experiments.