


Introduction
Average sea-ice extent of the entire Southern Ocean has increased slightly since 1979 based on passive microwave satellite measurements (Reference Cavalieri and ParkinsonCavalieri and Parkinson 2008, Reference Cavalieri and Parkinson2012). On smaller scales, the sea-ice extent of some regions in the Southern Ocean has decreased, i.e. in the Amundsen and Bellingshausen Seas (Reference Cavalieri and ParkinsonCavalieri and Parkinson, 2012). Regional climatic changes in the sea-ice extent around Antarctica are primarily driven by changes in wind patterns (Reference Ackley, Geiger, King and ComisoAckley and others, 2001; Reference Stammerjohn, Martinson, Smith, Yuan and RindStammerjohn and others, 2008). Thermodynamic processes (e.g. surface air temperature variability) and dynamic processes (e.g. wind and current patterns) can alter sea-ice area and thickness. Hence, it is important to determine whether sea-ice changes result from dynamic processes or atmospheric warming (Reference MassomMassom and others, 2008), and more research is needed to determine how changes in atmospheric circulation impact Antarctic sea-ice extent.
Sea-ice thickness is a fundamental measurement in nearly all ice studies but it is a complicated variable with strong non-Gaussian distribution (Reference GeigerGeiger and others, 2010; Reference Stampone, Geiger, DeLiberty and BernsteinStampone and others, 2012). Sea-ice thickness is used to compute ice compressive strength, growth rate, surface temperature, atmosphere–ice heat exchange, and salt content (Reference Thorndike, Rothrock and ColonyThorndike and others, 1975). Thickness also affects ice habitat and productivity, the amount of light penetrating ice, and the surface momentum balance (Reference Rothrock and UntersteinerRothrock, 1986; Reference Geiger and PerovichGeiger and Perovich, 2008). Temporal changes in thickness distribution are caused by thermodynamic growth and melting both vertically and laterally, plus mechanical processes from divergence and ridging (Reference Geiger and DrinkwaterGeiger and Drinkwater, 2005). Ice thickness stabilizes at thermodynamic equilibrium while ice fields vary locally in thickness due to ice advection which may deform ice and may create leads of open water and ridges (Reference Thorndike, Rothrock and ColonyThorndike and others, 1975; Reference HiblerHibler, 1980; Reference Worby, Geiger, Paget and WoertWorby and others, 2008). Because of these important interactions, Reference Thorndike, Rothrock and ColonyThorndike and others (1975) developed a standard mathematical relationship to characterize sea-ice thickness distribution of an ice pack as a probability function. Essentially, given any area, thickness distribution is the percent cover, or concentration, of ice within a certain thickness range. More precisely, a probability density function describes the likelihood that the ice will be within a certain thickness range. Integrating the probability over all thickness ranges for the entire ice area provides an estimate of the mean value for ice thickness (Reference Rothrock and UntersteinerRothrock, 1986). Through this approach, it is possible to predict, within a degree of certainty, a final thickness distribution when given an initial distribution and observed deformation and growth rates.
Although there is a general mathematical basis for describing sea-ice thickness distribution for any location, the availability and accuracy of measurements of sea-ice thickness vary seasonally, regionally and by instrument footprint size and resolution. In the Arctic Ocean, satellite altimetry is becoming more reliable for large-scale sea-ice thickness (Zwally and others, 2008; Reference KwokKwok and Rothrock 2009; Reference KwokKwok and others, 2009). However, sea ice in the Southern Ocean has properties that increase errors associated with altimetry measurements of sea-ice thickness at this time (Zwally and others, 2002, 2008). In regions of the Southern Ocean, snow accumulation on the sea ice causes freeboard flooding. This complicates uncertainties in density calculations by adding an additional component called snow ice (Zwally and others, 2002, 2008). Furthermore, Southern Ocean sea ice is geographically farther from the pole, subject to stronger solar radiation and subsequently different melting rates and processes (i.e. freeboard flooding as opposed to arctic melt ponds).
Hence, due to the difficulty of examining sea ice around Antarctica, large-scale records of sea-ice thickness distribution and volume in the Southern Ocean are sparse compared with the Arctic. Understanding of thickness distribution in the Southern Ocean is insufficient to address underlying dynamic and thermodynamic processes and how sea-ice thickness distribution varies in a changing climate. Although Antarctic sea-ice thickness trends have been simulated for the period 1992–2010 and validated against satellite altimetry (Reference Holland, Bruneau, Enright, Losch and KwokHolland and others, 2014), hemispheric records of data suitable for comparison are sparse. The current archive for large-scale in situ sea-ice thickness is the Antarctic Sea Ice Processes and Climate (ASPeCt) database for the Southern Ocean (Reference Worby, Geiger, Paget and WoertWorby and others, 2008; Reference DeLiberty, Geiger and AckleyDeLiberty and others, 2011; Reference Stampone, Geiger, DeLiberty and BernsteinStampone and others, 2012). Reference Worby, Geiger, Paget and WoertWorby and others (2008) compiled tens of thousands of ship-based observations in the Southern Ocean and transformed them to gridded fields for ASPeCt. In an effort to improve historical sea-ice thickness data, Reference DeLiberty, Geiger and AckleyDeLiberty and others (2011) and Reference Stampone, Geiger, DeLiberty and BernsteinStampone and others (2012) compared the ASPeCt data to NIC operational ice charts. A comparison of NIC charts with passive microwave records yielded reasonable estimates for sea-ice extent and concentration (Reference Dedrick, Partington, Woert and BennerDedrick and others, 2001). Comparison of the charts to ASPeCt thickness suggested that at least 4 years of charts, 1995–98, were adequate for a first-order, systematic, large-scale sea-ice thickness study (Reference DeLiberty, Geiger and AckleyDeLiberty and others, 2011; Reference Stampone, Geiger, DeLiberty and BernsteinStampone and others, 2012).
The previous studies by Reference DeLiberty, Geiger and AckleyDeLiberty and others (2011) and Reference Stampone, Geiger, DeLiberty and BernsteinStampone and others (2012) are the motivation for the research presented in this paper. The primary goal of this study is to evaluate two classic approaches to estimate the central tendency of the non-Gaussian variable sea-ice thickness. These are: (1) central tendency through propagated averages versus (2) central tendency through integrated distributions. For both methods, a single calculation yields the same answer. In the case of thickness from NIC charts, this first calculation is the central tendency of polygon thickness. With subsequent smoothing and upscaling (i.e. to the gridcell or regional scale), the solutions deviate. Such a situation is commensurate with cases where data are collected in the field, stored in an archive as an average, input into subjective analysis, and averaged again to fit a numerical modeling grid. Results herein demonstrate how quickly the skewed (non-Gaussian) distribution of sea ice alters these propagated calculations of central tendency through different resolutions at regional to hemispheric scales. We further demonstrate how such calculations impact the measure of regional volume in applications critical to climate assessment.
Data and Methods
As stated in the introduction, systematic hemispheric measurements of sea-ice thickness are not yet available for the Southern Ocean. Therefore, we use the weekly NIC 1995–98 ice charts coded for stage of development as a test sample. Reference DeLiberty, Geiger and AckleyDeLiberty and others (2011) demonstrate that ice chart data records are valid proxies for sea-ice thickness in the Southern Ocean when codified in accordance with operational processes invoked from 1995 to 1998. Before and after that time period, the subjective ice-chart processing at the NIC either excluded stage of development or only included one category for first-year ice; which renders stage of development inadequate for scientific studies of ice thickness. The results of this study, however, are not dependent on this particular dataset; they depend on the spatial resolution of any data and on the shape of the statistical distribution, regardless of data type. As Reference DeLiberty, Geiger and AckleyDeLiberty and others (2011) explained, NIC ice charts can only be partitioned into five or six effective thickness bins. As such, they have very low resolution in terms of skewness of sea-ice thickness distribution and therefore a high probability to support averaging of small-scale measurements into larger-scale studies. In this study, we test their high-probability hypothesis by investigating how the mean of the sea-ice thickness distribution degrades due to skewness of these slightly skewed distributions. Essentially, our null hypothesis assumes that the likelihood for skewness decreases with fewer bins and that with fewer bins, there is a higher likelihood for correlation between the two central tendency estimates.
Dataset preprocessing
Trained sea-ice analysts, who examine satellite data and demarcate polygons of uniform ice content, create the NIC ice charts as GIS-compatible data layers. Essentially, the charts are composites based on consolidation of several sources of averaged fields that are visually and subjectively interpreted. Hence, these data begin from a smoothed resource which again suggests strong candidacy for averaging small-scale measurements for larger-scale studies.
Details of ice chart processing are found in Reference Dedrick, Partington, Woert and BennerDedrick and others (2001) and Reference DeLiberty, Geiger and AckleyDeLiberty and others (2011). In summary, analysts associate each sea-ice polygon with a code describing total sea-ice concentration of a bound polygon of common ice textures. Analysts describe up to three concentrations of different ice types within each polygon. The ice types are codified into stages of development. Following the World Meteorological Organization’s (WMO, 1970; Table 1) classification, we derive a sea-ice thickness range associated with each stage of development. Here we follow the methodology of Reference DeLiberty, Geiger and AckleyDeLiberty and others (2011), which explains how sea-ice stage of development can be established as a proxy for sea-ice thickness from WMO records. From 1995 to 1998, the percentages of average sea-ice thicknesses for a specific polygon are 5% in the 0–0.1 m range, 16% in 0.1–0.3m, 22% in 0.3–0.7m, 19% in 0.7–1.2 m, and 32% in 1.2–2.0m, for a total of 94% of the ice-covered area of the Southern Ocean. The remainder of the ice-covered area is either no data or glacial icebergs within the ice pack. The NIC chart data from 1995 to 1998 are available weekly, with thicknesses calculated for each week. Because of the regularity of these records, time-average climatologies can be computed for annual cycles of the sea-ice average thickness and the integrated thickness.
WMO sea-ice types

For reproducibility and further development of the techniques provided here, open-source coding is chosen in the form of Python geoprocessing scripts to transfer the information from weekly ice charts to numerically gridded data (Reference GeigerGeiger and others, 2013). Because the goal of this study is to investigate the propagation of sea-ice thickness through scales, the Southern Ocean is divided into a regular grid and also into regions. The ocean is first separated into 208 cells of 10° longitude x 4° latitude, representative of a coarse climate-model grid. The NIC ice charts are only validated for regional scales (Reference DeLiberty, Geiger and AckleyDeLiberty and others, 2011) with the large gridcell size chosen to prevent misunderstanding in data quality. The gridcells are placed into seven sectors based on the regions in Reference Worby, Geiger, Paget and WoertWorby and others (2008). These are the eastern Weddell Sea, the western Weddell Sea, the Indian and Pacific Oceans, the western Ross Sea, the eastern Ross Sea, and the Bellingshausen and Amundsen Seas. Python scripts clip each sea-ice polygon to the extent of each gridcell and region (Fig. 1). For each area, the scripts extract the concentration, stage of ice development, and area of each polygon in the region (Fig. 2). To store the NIC chart information in a standard form, we calculate the sea-ice thickness distribution of every polygon. The thickness distribution includes five thickness ranges, 0-0.1 m, 0.1-0.3 m, 0.3-0.7 m, 0.7-1.2 m and >1.2 m. Additional bins store the fraction of open water within the ice pack, the ice-free area beyond the ice edge in the region, and the glacial ice in the region. For brevity, we refer to the two measures of central tendency as (1) average thickness and (2) integrated thickness.
Map of study area with sample NIC ice chart for the week of 12 September 1996. Ice chart polygons contain the sea-ice stage-of-development proxy for sea-ice thickness information. The representative grid is 10° longitude x 4° latitude. Bold lines separate seven large sectors containing common sea-ice domains.

Example of integrated thickness versus average thickness. Two different weeks are shown for the Weddell Sea sector. (a) Rendered thickness proxy values using ice chart polygons for the week of 14 March 1996. (b) The same dataset expressed as average thickness for each gridcell (shading of each cell) with stacked distributions for each thickness range. (c, d) The same respective information as (a, b) but for the week of 12 September 1996. In (c), labels A–C identify the three polygons for example calculations in the Appendix. (d) Gridcells (1–12) for example calculations in the Appendix.

Upscaling average versus integrated thickness
The procedure to upscale the sea-ice thickness from NIC charts to gridded and regional thickness is as follows. For both central tendency measures, the ice thickness is based on the area covered by ice; open-water fraction is not included. For the average thickness, the average sea-ice thickness of a polygon is first calculated. The thickness is then propagated to the gridcell then to the regional scale (Fig. 1 and 2) using area-weighted averages. The average thickness of each polygon is calculated first with

where
 is the average thickness within a polygon; the subscript b is the thickness range for an ice category with up to B bins; p represents a specific polygon or part of a polygon; Cb is the partial concentration of the bin within a polygon in a region, and zb is the median thickness of a thickness bin with range noted in Table 1.
Once the polygon average is computed, the average thickness is propagated to the gridscale using area-weighted averages. Gridcells may contain multiple polygons or pieces of polygons. Average thickness of a gridcell is thus calculated as average of polygon pieces within the cell (see example in Fig. 2). The thickness of each polygon piece is weighted by the ratio of polygon in the cell.

Here Zc is the average thickness of a model cell (c). The index p = 1 to P represents polygons within each model cell, with P being the number of polygons in the cell. ∆p is the ice area of polygon p that is within the cell (c) of interest. For the average thickness at the regional scale (ZR) the average thickness of all gridcells is weighted by the sum of the area covered by ice in each gridcell. This is essentially Eqn (2) repeated at the regional scale with polygons (p) substituted by cells (c) and cells summed to a region (R). For completeness and to avoid confusion, the ice-covered area of the gridcell, ∆c, and median thickness of the gridcell, Zc , are used to compute the regional average thickness (ZR) by

For these experiments, the average thickness is propagated similarly through four different scales: native (polygon: p), gridcell (c), region (R) and hemispheric (T, for total). For the hemispheric calculation, average regional thicknesses (ZR) are summed with weighted regional areas (∆ R) similar to Eqn (3) for a hemispheric (total) average thickness (Z T).
The second measure for the central tendency of sea-ice thickness is integrated thickness. Reference Rothrock and UntersteinerRothrock (1986) integrated over all thickness ranges in a probability distribution to establish the mean thickness value of a sea-ice area. Based on Reference Rothrock and UntersteinerRothrock (1986), we retain the distribution at every scale and only compute an average as a by-product at any chosen scale such that the averaging process is not incorporated into the upscaling processing. With this formulation, the full thickness distribution of each polygon and gridcell (Fig. 2b and d) is used to determine the integrated thickness distribution at the regional scale. The integrated thickness, HR, is

where zb is again the median thickness of a bin category, Cb is the concentration of a bin category in the region, ∆p is the area of each polygon, and Tp is the total concentration of each polygon. For clarity we note that a normally distributed dataset yields the same answer in Eqns (3) and (4). Also for clarity, low and high bin values defining a bin range are calculated the same way as Eqn (4) by simply replacing the median thickness, zb, with the low (and then high) thickness range values (from Table 1) and computing the difference between the high and low range results to track range contributions as an uncertainty parameter.For several weeks within the 4 years, no data are available, including the last week in July 1997, all of November and December 1997, and 2 weeks in mid-June 1998 because of a system transition from hand-drawn paper charts to a computer-based (GIS) charting system. Because of these missing data, at some times of the year the average is based on 3 years instead of 4.
Volume calculations
Total Southern Ocean sea-ice volume is calculated based on each of the measures of central tendency. The sea-ice area of the ice charts is retained in the thickness distribution dataset, so sea-ice area for a given week is the product of the area of the region and the total concentration of all ice bins. The sea-ice area for the entire Southern Ocean is the sum of the area of ice in every region of each week. We calculated two measures for Southern Ocean sea-ice volume: VZ, the volume from average thickness, and VH, the volume from integrated thickness. Here, the products are weekly ice area, A, average thickness, Z, and integrated thickness, H, with area being the same in both cases.


Results
The two calculations for central tendency are the average thickness and integrated thickness. For the average thickness, individual polygons (or pieces of polygons) are used to compute single thickness values for gridcells which in turn are used collectively to compute single thickness values for a regional thickness and then for the entire hemisphere. For the integrated thickness, the full distribution is retained from the native polygon dataset to the gridcell level and subsequently from each gridcell to the regional level and further to the hemispheric thickness. Distribution ranges are also tracked, with lower and upper propagated distribution bounds serving as standard deviation estimates following Reference DeLiberty, Geiger and AckleyDeLiberty and others (2011). In essence, the integrated approach retains the distribution throughout the upscaling process while the averaging approach only propagates central tendency information.
As an overview, both averaged and integrated calculations vary seasonally and regionally between 1995 and 1998. In all regions, integrated thickness almost always exceeds average thickness. The average typically falls between the low side of the range and the integrated mean. The one systematic exception is the summer season where large differences, some exceeding 60%, develop between the two calculations (Fig. 2).
The large summer differences coincide with a high percentage of thickest ice and minimal sea-ice extent. As examples, the ice extent minimum in the western Weddell Sea region (Fig. 2a and b) is dominated by the thickest ice type surviving while thinner ice types melt away. The greater extent in September (Fig. 2c and d) is associated with higher proportions of new, thin ice to the north and new ice forming on open water within the ice pack to the south. In both cases the central tendency does not coincide with the dominant ice types.
From 1995 to 1998, the two calculations of central tendency of sea-ice thickness for the entire Southern Ocean differed, on average, by 0.27 m over an average ice area of 8.7 x 10¹²m2 (Fig. 3). The average thickness only exceeds the mean integrated thickness in one sector, the western Weddell Sea, between March and April of the years 1995 and 1997 (Fig. 3a). The greatest differences between integrated thickness and average thickness occur when average thickness is below the full range of integrated thickness: during the austral summer in all sectors. The greatest differences between the two thickness measurements occur in the Indian Ocean sector during late February 1998 (a difference of 1.46 m over an ice area of 9.84x10⁹m2 ) and in the Pacific Ocean sector in early March 1997 (a difference of 1.29 m over an ice area in the region of 81.28 x 10⁹m2). In the western Weddell Sea, the two calculations are, on average, the closest year-round, with a difference of ∼0.18m. In all regions, summer integrated thickness reaches a high value that is never reflected in the average thickness. The difference between the two thickness calculations for all regions is most constant from May to October, which is the winter-to-summer transition period for the Southern Ocean.
Time series of sea-ice thickness from 1995 to 1998. Average thickness, integrated thickness and ranges of integrated thickness are shown for the (a) western Weddell Sea, (b) eastern Weddell Sea, (c) Indian Ocean, (d) Pacific Ocean, (e) western Ross Sea, (f) eastern Ross Sea and (g) Amundsen and Bellingshausen Seas. Gaps occur where there are no data.

The 4 year averages (climatology) of the two measures of central tendency and the range of integrated thickness (Fig. 4) vary among regions. The climatology of the integrated thickness calculations is consistently greater than the climatology of average thickness calculations with time-varying differences. Integrated thickness climatology and associated range of the entire Southern Ocean (Fig. 4h) vary strongly seasonally. Integrated thickness peaks in mid-February (1.35 m over an ice area of 1.73x10⁹m2 ) and reaches a minimum in late April (0.60m over an ice area of 8.23 x 10⁹ m2). Average thickness is more stable throughout the year, ranging from 0.76 m (over an ice area of 4.30 x 10⁹m2 in the first week of January) to 0.45 m (over an ice area of 4.71 x 1 0 9m2 in early April). Average thickness drops beyond the range of integrated thickness during the austral summer and remains below the integrated thickness median throughout the year. All of the sectors, except for the western Weddell Sea, follow similar seasonal patterns for the integrated and average thickness. However, the individual sectors exhibit more interannual variability than the full Southern Ocean, in corroboration with Reference Cavalieri and ParkinsonCavalieri and Parkinson (2012). The largest differences between the integrated and average thickness take place in the Indian and Pacific Ocean sectors, with differences >1.0m in the austral summer. In these two sectors, the average thickness values dip during the same time that integrated thickness values peak. In the western Weddell Sea, average thickness is nearly always within the range of integrated thickness values. There, the integrated and average thickness values are, on average, <0.2 m apart: the closest of all sectors. Conversely, in the Indian and Pacific Ocean sectors, the two values are >0.4 m apart on average.
Climatology of sea-ice thickness from 4 years of ice chart records from 1995 to 1998. Weekly averages, as climatology, of regional average thickness, integrated thickness and ranges of integrated thickness are shown for the same sectors described in Figure 3. Climatology for the entire Southern Ocean is shown in (h).

The two calculations for central tendency of sea-ice thickness are used to determine total Southern Ocean sea-ice volume. The two calculations of total sea-ice volume in the Southern Ocean over 4 years represent sea-ice conditions with different volumes of ice (Fig. 5). Sea-ice area is the ice area according to NIC ice charts (e.g. Reference DeLiberty, Geiger and AckleyDeLiberty and others, 2011). The maxima and minima yearly patterns occur during the same weeks for all years. The maximum volume for each year occurs in late August or September, while the minimum volume occurs in late February or March. Maximum difference in volume due to the two thickness calculations is 3.295 x 1 0 1 2m3 (in November 1995), and the minimum difference is 0.179 x 1 0 1 2m3 (in February 1995). From an absolute perspective, the differences are largest in October and November or just after the maximum volume occurs. The smallest differences are in February for 1995, 1997 and 1998 and June in 1996. The relative differences are largest in February and March, when ice extent is at a minimum. The largest relative difference is 60% (in March 1997), and the smallest relative difference is 15% (in August 1995).
Time series of sea-ice volume of the Southern Ocean. Between January 1995 and December 1998, weekly values are shown using average and integrated thickness methods, with ranges for integrated thickness used as a guide to estimate the relevance of their differences. Gaps occur where there are no data.

Discussion
This study expands the analysis of ice chart data for sea-ice thickness research reported by Reference DeLiberty, Geiger and AckleyDeLiberty and others (2011) and Reference Stampone, Geiger, DeLiberty and BernsteinStampone and others (2012) to include regions covering the entire Southern Ocean and to evaluate calculations for large-scale thickness. For the NIC charts between 1995 and 1998, the NIC differentiates among multiple stages of first-year ice, which translates to thickness ranges of 0.3-0.7 m, 0.7-1.2 m and >1.20m. In other years, the range of thickness for first-year ice is broader (0.3-1.2 m), which makes characterization of a thickness distribution ineffective from a model-input perspective.
The average thickness calculation of the ice thickness on a regional scale indicates less seasonality than the integrated thickness calculation. Seasonal cycles of thickness on a regional scale have been previously established (Reference Worby, Geiger, Paget and WoertWorby and others, 2008) and agree with the integrated thickness calculation here. The sea-ice thickness proxy from the NIC charts limits maximum sea-ice thickness to 2.0 m, and the sea-ice thickness distribution based on NIC charts tends to be negatively skewed, particularly in the austral summer when thin ice melts and ice >1.2 m thick dominates the distribution. Such summer conditions lead to a strong bimodal distribution which NIC ice analysts incorporate into their analysis assumptions for seasonal evolution (personal communication from E. Maksym, 2014). As a result, the total volume estimates reported here are underestimates of the true ice thickness even for the integrated approach. However, for the period in question, there are both insufficient airborne and spaceborne systems, so findings reported here are the best estimate for the period analyzed.
Despite these limitations, the distribution of thickness of sea ice in the Southern Ocean follows a general pattern which we report here. The thickness distribution is strongly dependent on the transition between ice growth and ice melt associated with seasonal changes. After the summer melt when the thick ice category is the most prominent, the new ice <0.1m thick becomes a more dominant ice type in autumn. By winter, the fraction of thick multi-year ice >1.2m thick and thin new ice <0.1 m thick decreases, and the fractions of the three ice types with medium thickness rise in closer proximity to the central tendency. Ice redistributes into thicker categories as the winter persists, and in February or March the fractions of all ice types, except the thickest, decline. In every region, there is a period in summer when ice thicker than 1.2 m makes up >50% of the distribution, but, in the eastern Weddell Sea, the western Ross Sea and the western Weddell Sea, ice over 1.2 m accounts for >80% of the total ice cover at times. The western Weddell Sea has the most distinctive distribution of all the sectors: more ice falls in the >1.2m thick category than any other category on average for most weeks of the year. The length of time for which the majority of the ice is thick in other regions ranges from 7 weeks in the Bellingshausen and Amundsen Seas regions to 12 weeks in the eastern Weddell Sea. Thin-ice categories account for more of the distribution during the summer-to-autumn transition in each region.
The sea-ice thickness distribution on a regional scale has the same seasonal and regional cycle as the sea-ice thickness distribution that Reference Worby, Geiger, Paget and WoertWorby and others (2008) found from the ASPeCt ship-based dataset. Our results also support the similarities of the thickness distributions in the Indian and Pacific Oceans. Reference Worby, Geiger, Paget and WoertWorby and others (2008) document the summer multi-year ice pattern in most of the regions. The results of the seasonal and regional cycle of the thickness distribution supported previous studies based on archives of ship observations (Reference Timmermann, Worby, Goosse and FichefetTimmermann and others, 2004; Reference Worby, Geiger, Paget and WoertWorby and others, 2008). Results presented here include the entire Southern Ocean since the original data sources are composite images with full spatial coverage for each week and few spatial gaps due to missing data.
Based on the seasonal cycles of sea-ice thickness observed in previous studies (Reference Timmermann, Worby, Goosse and FichefetTimmermann and others, 2004; Reference Worby, Geiger, Paget and WoertWorby and others, 2008), the integrated thickness is a better measure of the thickness central tendency than average thickness on regional scales. The sea-ice thickness distribution has a high proportion of the thickest ice category in the summer of every year, with the most pronounced occurrence in the western Weddell Sea. Because the thickness central tendency is really a thickness per area, the yearly measurements should show the thickest ice of the year in the summer when the 1.2–2.0 m range is the dominant ice type in the thickness distribution. From drillhole data, Reference Wadhams, Lange and AckleyWadhams and others (1987) discovered that the thickness per area of Antarctic sea ice in midwinter was relatively thin compared with the rest of the year, but they noted that drillhole data underestimated the thick and deformed ice. In this study, integrated thickness is the lowest in the winter months as well. Regional area-weighted average thickness trends for the Indian and Pacific Ocean sectors in this study fall in the same thickness range (0.35–0.65 m) Reference Allison, Brandt and WarrenAllison and others (1993) identified as the thickness range for sea ice in the East Antarctic.
Because ice volume accounts for the mass of ice stored in a region, accurate volume improves predictions of ice rate of change in an area. Reference DeLiberty, Geiger and AckleyDeLiberty and others (2011) show that since ice thickness increases during the growth season between April and May, sea-ice volume in the Ross Sea tends to reach a maximum value 2–4 weeks after the total ice extent reaches a maximum value, which happens between September and October. In this study, we show that the total Southern Ocean volume reaches a maximum 1–3 weeks earlier than the maximum volume in the Ross Sea for the 4 years. Differences among regions address the need for detailed volume studies of the other Southern Ocean sectors. Sea-ice thickness averaged <1 m for the entire Southern Ocean. Although this may seem insignificant compared with the total area of sea ice in the Southern Ocean, the way thickness is calculated influences the value of large-scale volume. The impact of the thickness calculation method on the volume calculation was most pronounced in the summer, when differences between integrated and average thickness are greatest. Year-round, the difference between the two volume calculations was consistently >10%.
While large-scale spatial coverage of sea-ice thickness data in the Southern Ocean may be available in the near future, current records are insufficient. Reference KwokKwok (2005) estimated the sea-ice production rate in the Ross Sea, but noted that the lack of well-distributed thickness measurements in the Southern Ocean prevented a full understanding of all factors affecting total sea-ice volume. Hence, results provided here are a step forward. The ICESat (Ice, Cloud and land Elevation Satellite) altimeter provides the freeboard, or level of ice above the water level, and studies have started to evaluate ICESat freeboard estimates to derive sea-ice thickness (Zwally and others, 2008; Reference Zwally, Yi, Kwok and ZhaoYi and others, 2011). While these results provide a thickness record after the launch of ICESat in 2003, the thickness uncertainties are currently very high (Yi and others, 2011). Unfortunately, uncertainties for the Southern Ocean are up to nine times higher than for ICESat-derived thickness in the Arctic (Reference Zwally, Yi, Kwok and ZhaoYi and others, 2011).
Results from this study establish a sea-ice thickness baseline from ice stage of development, so that future studies can use the baseline to determine future rates of change of thickness. Reference Liu and CurryLiu and Curry (2010) predict a decline in Antarctic sea ice for the 21st century based on observed warming trends for sea surface temperature in the second half of the 20th century and continued warming projected for the near future. The amount of sea-ice volume from 1995 to 1998, which was reported in this study, could be incorporated into projections and climate models for sea-ice thickness in the Southern Ocean.
Conclusion
The experiments and findings presented herein demonstrate how the method of calculating the central tendency strongly influences the final value of propagated non-Gaussian products. These results disprove our null hypothesis that fewer bins means less likelihood for skewness and disprove a high likelihood for correlation with central tendency estimates. The main source of these findings is the development of strong bimodal distributions of thick and thin ice types; most noted in summer when melting processes are strongest. Such an outcome supports the need for better non-Gaussian representation of variables similar to sea-ice thickness (e.g. snow thickness or precipitation). The outcome is relevant for any procedure which organizes sea-ice attributes into fractions of thickness, area and volume climate records. The breadth of ice chart data distinguishes itself from in situ thickness measurements which are limited in spatial coverage, though invaluable as ground truth to validate this and other approaches. This study additionally demonstrates the effective utility of ice charts to compute and temporally track large-scale sea-ice volume once thickness categories are appropriately defined and upscaling calculations are implemented in a way which conserves thickness distribution.
Sea-ice thickness is a non-Gaussian variable, and the differences between the two calculations of central tendency arise because average thickness measurements are only appropriate for normally distributed variables. At the polygon level, both calculations yield the same result (see Appendix) because both are based on the percent area of each ice type. The key distinction between the two calculations is that the full distribution is only used for the integrated thickness. Any propagation of results beyond the first smoothing will contribute to a diverging answer. The largest differences between the two calculations occur in the austral summer due to a bimodal distribution which is enhanced by subjective analysis practices and therefore most clearly demonstrated through NIC ice charts more than other existing sea-ice thickness datasets. By sector, the largest differences are found in the Indian and Pacific Ocean sectors when the integrated thickness peaks at the same time as the average thickness drops. At these times, the average thickness calculation is out of the range of the integrated thickness values.
This study illustrates what happens when terms without normal distributions are entered into numerical models and treated as single mean values, even smoothed values. The means of normally distributed terms can be used as input. However, for non-normally distributed terms, the distribution should be used as input rather than the mean. The full distribution is essential for representing real properties of non-Gaussian variables in numerical models. Because the integrated thickness appears to reflect sea-ice characteristics more precisely, we suggest that future work should calculate central tendency of thickness over large scales following the integrated thickness procedure demonstrated with Eqns (4) and (6). Finally, we recommend that all model variables be evaluated for normal distribution tendency as results here will repeat themselves in all properties with non-Gaussian distributions.
Acknowledgements
We thank Steve Gaughan from the US Army Cold Regions Research and Engineering Laboratory for assisting with geoprocessing methods. Thanks go to the US National Ice Center for providing datasets used for analysis. Funding was provided by NSF ARC-1107725 ‘Precision, Accuracy, and Aliasing of Sea Ice Thickness from Multiple Observing Platforms’ and The Delaware Space Grant Consortium. The International Space Science Institute, Bern, Switzerland, is acknowledged for collaborative engagements through project No. 169 (2009–2011: Space-borne monitoring of polar sea ice). Finally, we thank P. Heil, Chief Editor, and two anonymous reviewers for suggestions to improve this manuscript.
Appendix: Example Calculation
The 12 September 1996 NIC ice chart is chosen to demonstrate quality control and repeatability of methods shown in the main text. First, the gridcell bounded by 66-70°S, 50-40° W (Fig. 2c and d, cell 5) is chosen from that chart. Within that gridcell, the white polygon, polygon C, is selected. The raw SIGRID information of polygon C is encoded as ‘CT91CA809599CB109199CC018799’. These raw data break out into components as follows (see also Table 2). Total ice concentration is 95%. Ice concentration of the first ice partial is 80% with an ice type associated with sea-ice thickness bin 5 (1.2-2.0m with median thickness 1.6 m). Concentration for the second partial is 10% with ice thickness 0.7-1.2 m and median thickness 0.95 m (bin category 4). Third ice partial concentration is 5% with thickness range 0.3-0.7 m and median thickness 0.5 m (bin category 3). The average thickness for this demonstration polygon is the sum of the product of the median thickness in each bin and concentration for each partial (Eqn (1)) with detailed data entries of
Example data and calculations from western Weddell Sea 12 September 1996

zp = (0.8 x 1.6) + (0.10 x 0.95) + (0.05 x 0.5) = 1.40 m
Integrated thickness for this same polygon is the sum of the product of the percent of each bin and its corresponding median thickness bin value. Because the percentage of area designated to a bin within a polygon is the same as ice concentration, the integrated thickness method and average thickness method are the same for any polygon, with the detailed data entries for integrated thickness (Eqn (4)) for polygon C being
HR = (0.8 x 1.6) + (0.10 x 0.95) + (0.05 x 0.5) = 1.40 m
In other words, the central tendency thickness of polygon C is 1.40 m with both methods.
It is the next step where answers begin to diverge. First, continuing on with the average thickness method, an average for the entire gridcell is the area-weighted average of each of the averages from polygons A, B, C (Fig. 2; Table 2). With the ice-covered area of the chosen cell being 168.8E9m2 (i.e. E9 = ‘ x 1 0 9’ for brevity), the average thickness (Eqn (2)) for cell 5 through propagated average thicknesses is explicitly 
Conversely, continuing on with the integrated method using Eqn (4), the central tendency thickness for the gridcell is explicitly calculated as
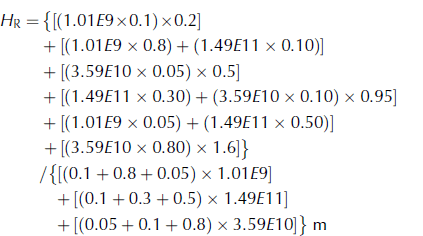
To compute this central tendency value, each thickness bin category is added from each polygon first (numerator parenthesis clustering) as weighted concentrations by area. Then each category is summed by weighted area at the grid level, with denominator parentheses clustered by polygon to compute the total area of ice relative to the total gridcell area.
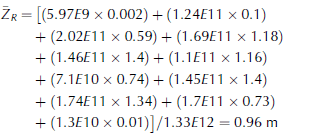
Finally, propagating these results to the entire western Weddell Sea region, the average thickness method continues to incorporate average values from each gridcell. Table 2 provides the average thickness and area covered by ice of the other gridcells in the western Weddell region for the 12 September 1996 ice chart. The total ice area for the Weddell Sea at this time is 1.33E12 m2. With those values, the area-weighted average thickness of the western Weddell Sea is 0.96 m based on the explicit calculation of Eqn (3):
The integration method finds a central tendency value for the western Weddell Sea with the same formulation as the integration for the gridcell (Eqn (4)). For this method, the area of sea ice within each thickness range in every polygon is taken into account. Because there are >70 sea-ice polygons in this sector, each containing up to three thickness ranges, the full set of values required for this calculation is too long to list here. Instead, Table 2 provides the percent of the total ice area in the western Weddell Sea covered by each thickness range (Bin1-Bin5). The integrated thickness is the sum of the product of the median thickness of a bin and the percentage of ice area with the associated range of thickness:

With these calculations, the regional thickness of the western Weddell Sea is 1.08 m based on the integrated thickness method, and 0.96 m based on the average thickness method.



