1 Introduction
Insurance companies rely on financial models for quantitative risk management. These risk models should be accurate and fast in terms of the calculation of risk figures such that the rapid pace of market environments is matched. Life insurance companies face the challenge of having to quickly revalue their liabilities under economic stress scenarios based on market-consistent valuation principles.
Typically, insurance liabilities exhibit features, such as options and guarantees, comparable to standard financial products. Unlike for the latter, there are generally no closed-form formulas for the valuation of the former. Because of this, the use of numerical methods, such as Monte Carlo techniques, becomes inevitable. However, the choice of the specific technique to be used is the key factor in the accuracy and speed of the calculation of risk figures.
Nested Monte Carlo (nMC), a straightforward approach to this problem, is computationally burdensome to the point of being infeasible in most cases. Other standard techniques to approach this problem are the least squares Monte Carlo approach (LSMC) and the replicating portfolio (RP) approach. These techniques, and their advantages and disadvantages, will be described in more detail in the following sections.
The availability of accurate and fast valuation methods is of great interest to risk management practitioners in life insurance companies. In the last decade, machine learning models based on neural networks have emerged as the most accurate in many fields, among them image recognition, natural language understanding and robotics. While not the first to apply neural networks to life insurance modelling, this paper incorporates the idea of risk-neutral valuation of neural networks to achieve higher accuracy than other existing models while remaining within a realistic computational budget.
A review of the literature shows that several papers work with machine learning techniques to address the problem of calculating the value and risk metrics of complex life insurance products.
One family of methods starts with exact information about a small number of contracts and then uses spatial interpolation to generate valuations for all contracts. For example, Gan & Lin (Reference Gan and Lin2015) use a clustering technique for the selection of the representative contracts and then apply a functional data analysis technique, universal kriging, for the interpolation. Hejazi & Jackson (Reference Hejazi and Jackson2016) propose using a neural network model for the interpolation step instead of traditional interpolation techniques. These methods interpolate among policies for a fixed set of economic scenarios, hence reducing the computational burden of calculating the value of the insurance contract. They address the valuation problem, but on their own, they are not enough to solve the computational problem of calculating risk metrics.
The effective calculation of risk metrics is addressed by a family of methods that take portfolio valuations (or cash flows) as inputs and use regression methods to construct a model capable of producing the real-world distribution of values of the insurance portfolio. These methods can be classified into two groups, “regress-now” and “regress-later”, a classification first proposed by Glasserman & Yu (Reference Glasserman and Yu2002). Regress-later methods perform better than regress-now methods, as shown by Beutner et al. (Reference Beutner, Pelsser and Schweizer2013). However, regress-later methods require setting larger optimisation problems, which leads to regress-now methods being computationally cheaper.
Examples of both types of methods in this family can be found in Beutner et al. (Reference Beutner, Pelsser and Schweizer2016) and Castellani et al. (Reference Castellani, Fiore, Marino, Passalacqua, Perla, Scognamiglio and Zanetti2018). The former presents a regress-later model based on an orthogonal basis of piece-wise linear functions, and the latter a regress-now model based on neural networks. LSMC and RPs belong to this overarching family of methods, and any machine learning approach in this family can be a direct replacement for them.
The models in Beutner et al. (Reference Beutner, Pelsser and Schweizer2016) and Castellani et al. (Reference Castellani, Fiore, Marino, Passalacqua, Perla, Scognamiglio and Zanetti2018) are far from the only examples of regression methods applied to the problem of solvency capital calculation. Many people have worked on this problem and made contributions to the field. A regress-now model based on Gaussian process regression was presented in Risk & Ludkovski (Reference Risk and Ludkovski2018), and many more models can be found cited in the introduction to Beutner et al. (Reference Beutner, Pelsser and Schweizer2016). In this introduction, we highlight only those we see as closest to our work.
In this paper, we present a regress-later model based on neural networks, including a closed-form formula for its risk-neutral valuation, and compare it to a benchmark implementation of RPs. We focus on this comparison in order to answer a question of relevance to practitioners: “Can neural networks provide better results than existing methods for solvency capital calculations used in the industry?” A formal mathematical treatment of the methods involved can be found in the already mentioned Beutner et al. (Reference Beutner, Pelsser and Schweizer2013) (regress-later versus regress-now methods), Natolski & Werner (Reference Natolski and Werner2014), and Cambou & Filipović (Reference Cambou and Filipović2018) (RPs) and Bauer et al. (Reference Bauer, Bergmann and Reuss2010) (LSMC).
We have not found in the literature of previous work on comparing RPs (i.e. regress-later method with financial instruments as basis functions) to other approximation techniques. There are, however, several papers that compare LSMC approaches: Bauer et al. (Reference Bauer, Bergmann and Reuss2010) present a comparison between LSMC and nMC, and Pelsser & Schweizer (Reference Pelsser and Schweizer2016) present a comparison between LSMC regress-now and LSMC regress-later.
Against the background described above, this paper’s contribution is threefold:
it presents a reproducible RP approach suitable for benchmarking in a research context,
it introduces a risk-neutral valuation formula for a class of neural networks with multivariate normally distributed inputs (such as discrete time Brownian motion processes),
it builds a regress-later methodology based on neural networks and compares the quality of the economic capital calculations between this method and the RP approach.
The neural network model improves on those in use in the industry and some of those presented in the literature. In comparison with the (regress-now) neural network model in Castellani et al. (Reference Castellani, Fiore, Marino, Passalacqua, Perla, Scognamiglio and Zanetti2018), our model is based on a regress-later approach, which – as described in the literature – provides more accurate results than regress-now models. In comparison with the regress-later approach in Beutner et al. (Reference Beutner, Pelsser and Schweizer2016), the neural network approach allows us to avoid having to define an arbitrary dimensionality reduction function and a hypercube grid. Under a neural network model, those parameters are data-driven and determined as part of the optimisation.
The rest of the paper is structured as follows: section 2 describes the solvency capital calculation problem in detail, together with possible solutions based on nMC and proxy models. Section 3 summarises the mathematical framework common to all regression models (both regress-now and regress-later), and section 4 describes the proposed neural network approach and presents the risk-neutral valuation of a class of neural networks. Section 5 discusses important qualitative aspects of the models, such as model complexity and feature engineering. Finally, section 6 describes the numerical experiments and presents the results.
2 Solvency Capital Calculation Problem in Life Insurance
Solvency regimes – including Solvency II or Swiss Solvency Test – require companies to hold capital in excess of a legal minimum that is based on the amount necessary to remain solvent with high confidence in a 1-year period.
The above implies the determination of the distribution of the value of the asset–liability portfolio at the end of the 1-year period. We call the value of the asset–liability portfolio
 $V_t$
, and therefore,
 $V_0$
and
 $V_1$
are the initial value and the value at the end of the first year, respectively. The solvency capital requirement at confidence level
 $\alpha$
is then determined relative to a risk metric applied to the distribution of
 $\Delta V = V_1-V_0$
, where
 $V_0$
is considered a constant:
Value at risk (Solvency II)
 \begin{equation*} \textit{VaR}_{\alpha }(\Delta V) =-\inf {\big \{}v :F_{\Delta V}(v)>1-\alpha {\big \}}=-F_{\Delta V}^{-1}(1-\alpha ) \end{equation*}
Expected shortfall (Swiss Solvency Test)
\begin{equation*} \textit{ES}_{\alpha }(\Delta V) = {\frac {1}{1-\alpha }}\int _{\alpha}^{1 }{\mbox{VaR}}_{\gamma }(\Delta V)d\gamma \end{equation*}


If
 $F_{V}^{-1}$
is not known (and this is usually the case), then we must simulate
 $\{V_1^{(i)}\}_{i=1:M}$
and then calculate the risk metric on the empirical (simulated) distribution. These M samples are referred to as real-world (or “natural”) simulations.
Having described how risk calculations usually depend on a Monte Carlo sampling of
 $V_1$
,
 $\{V_1^{(i)}\}_{i=1:M}$
, we now focus on the calculation of each individual
 $V_1^{(i)}$
. These represent the value of the asset–liability portfolio at the end of the 1-year period. The valuation must be carried out on a market-consistent basis, which means applying risk-neutral valuation:
 \begin{equation} V_t = E_t^{\mathbb{Q}}\left[\sum_{\tau > t} \textit{CF}_{\tau}(X)\right] \end{equation}
In the formula, above the value of the portfolio is the expectation over the risk-neutral measure
 $\mathbb{Q}$
of future discounted cash flows,
 $CF_{\tau}(X)$
. These cash flows depend on a set of economic variables X. In turn, X depends on a smaller set of normally distributed random drivers
 $\xi$
– that is,
 $X=X(\xi)$
. This implies that there is a
 $CF^{\prime}_{\tau}(\xi)$
such that
 $CF^{\prime} = CF \circ X$
.
When calculating
 $V_1$
for solvency capital purposes, the real-world simulations determine an empirical distribution of
 $X_{0:1}$
(X between 0 and 1), and for each sample in such distribution, there is a risk-neutral distribution of X after
 $t=1$
– which we call
 $X_{1:T}$
– over which
 $V_1$
must be calculated.
For simple products, such as a standard annuity, the calculation of
 $V_1$
is straightforward. However, for products that lack a closed-form formula,
 $\{V_1^{(i)}\}_{i=1:M}$
must be approximated by some
 $\{\widehat{V}_1^{(i)}\}_{i=1:M}$
. Most complex products, such as variable annuities, fall under this case.
2.1 Nested Monte Carlo
A simple solution for approximating
 $V_1$
is to apply a Monte Carlo approach:
 \begin{equation*} \widehat{V}_t = V_{\textit{MC}} = \frac{1}{N} \sum_{j=1}^{N} \sum_{\tau > t} \textit{CF}_{\tau}\left(X_{t:T}^{(j)} | X_{0:t}\right) \end{equation*}
This formula implies taking N samples and calculating the average of the discounted simulated cash flows. Since this must be done for each real-world simulation i to be able to construct
 $\{V_1^{(i)}\}_{i=1:M}$
, the full simulated distribution is given by
 \begin{equation*}\{\widehat{V}_t^{(i)}\}_{i=1:M} = \left\{\frac{1}{N} \sum_{j=1}^{N} \sum_{\tau > t} \textit{CF}_{\tau}(X_{t:T}^{(j)} | X^{(i)}_{0:t})\right\}_{i=1:M}\end{equation*}
The set of risk-neutral scenarios is called the inner scenarios because they are constructed for each outer scenario i to estimate the value of the portfolio conditional on the information at time 1. Since a total of
 $M \times N$
simulations are required, a nMC approach is usually infeasible. Most insurers, therefore, use other approximation methods for
 $\widehat{V}_1$
, the most popular being “least squares Monte Carlo” (LSMC) and “RPs”. Both of these methods are based on a regression approach. For an analysis and comparison of nMC to regression-based methods, the reader is referred to Broadie et al. (Reference Broadie, Du and Moallemi2015).
2.2 Alternatives to nested Monte Carlo
Given the computational difficulties of nMC, many methods have been proposed in the literature, some of which are in place in the industry. With regard to those in place, it is important to note that none of these proxy models replaces the original, full insurance cash flow model of the asset–liability portfolio. These methods focus on allowing the solvency capital to be calculated with fewer executions of that model.
LSMC, originally introduced for pricing American style derivatives by Longstaff & Schwartz (Reference Longstaff and Schwartz2001), is used to reduce the number of necessary risk-neutral simulations by finding a polynomial approximation of the portfolio value as a function of the risk drivers. The coefficients of the polynomial expansion are obtained from a regression against a reduced-size nMC. LSMC is usually applied in the industry as, in the terminology of Glasserman & Yu (Reference Glasserman and Yu2002), a “regress-now” approach, as described in Bauer et al. (Reference Bauer, Bergmann and Reuss2010). However, polynomial approximations do not need to be restricted to “regress-now” applications.
The RP approach is based on running a regression against the portfolio cash flows, but instead of polynomials, the model uses a set of financial securities as basis functions. The problem is formulated as a linear optimisation problem (
 $L_1$
or
 $L_2$
) where the objective is to minimise the differences between the cash flows of the asset–liability portfolio and the RP. The output is a portfolio of financial instruments that reproduces the payout of the life insurance portfolio as closely as possible. For reference, Natolski & Werner (Reference Natolski and Werner2014) analyse in detail some of the popular approaches to constructing RPs. Vidal & Daul (Reference Vidal and Daul2009) and Chen & Skoglund (Reference Chen and Skoglund2012) look at RPs from a more practical point of view, and Adelmann et al. (Reference Adelmann, Fernandez Arjona, Mayer and Schmedders2019) provide a description of a real-world implementation in the insurance industry.
In this paper, we present a method based on neural networks that combines the strengths of LSMC and RPs while providing higher accuracy in a setting with a realistic amount of inputs and computing power. We stress this last point since it is common for studies on neural networks to provide results based on millions of input samples, which would not be practical in the real world.
3 Mathematical Formulation
Both regress-now and regress-later models are estimators for the value of the asset–liability portfolio,
 $\widehat{V}_t$
. They differ in the input variables that they use and the target variable that they estimate.
Regarding the input variables, regress-now models work with the input economic variables until time t, whereas regress-later use all variables until the end of the projection horizon. Regarding the target variable, regress-now models directly estimate the time-t value function, whereas regress-later models estimate the discounted cash flows – individual, grouped or terminal.
Regress-now models approximate the value function by estimating the coefficients
 $\{w_k\}$
in
 \begin{equation*} \widehat{V}_{t}^{(i)}(X) = \sum_k w_k \phi_k\left(X_{0:t}^{(i)}\right)\end{equation*}
This estimation is done via regression, minimising the squared error
 \begin{equation*}\sum_{i=1}^{m} \left(\sum_k w_k \phi_k(X_{0:t}^{(i)}) - \tilde{V}_{MC}^{(i)}\right)^2 \end{equation*}
where
 $\tilde{V}_{MC}^{(i)}$
differs from
 $V_{MC}^{(i)}$
in that it is calculated with a very low number n of inner simulations, instead of using N simulations as in nMC. It is also worth noting that the regression is performed over
 $m<<M$
outer scenarios. LSMC uses a polynomial basis for
 $\{\phi_k\}$
. Once the model has been calibrated, it can be used to “predict” (in its machine learning sense) all M scenarios, which were not part of the training data.
Regress-later models approximate the value function by estimating the coefficients
 $\{w_k\}$
necessary to build the following estimator:
 $$\displaylines{
\hat V_t^{(i)} = E_t^\left[ {\sum\limits_{\tau > t} {{{\widehat{CF}}_\tau }} (X)} \right] \cr
= E_t^\left[ {\sum\limits_{\tau > t} {\sum\limits_k {{w_{k,\tau }}} } {\phi _{k,\tau }}({X_{0:\tau }})} \right] \cr
= \sum\limits_{\tau > t} {\sum\limits_k {{w_{k,\tau }}} } E_t^\left[ {{\phi _{k,\tau }}({X^{(i)}})} \right] \cr} $$
where the variable
 $\tau$
indicates that a different set of basis functions
 $\phi_{k , \tau}$
and parameters
 $w_{k,\tau}$
are used for each time step
 $\tau > t$
.
The equation above shows that, while more accurate than regress-now models, regress-later models impose an additional requirement: to be able to calculate
 $E_t^{\mathbb{Q}}[ \phi_{k , \tau}]$
. In the best case, there is a closed-form formula. In the worst case, it can be done via Monte Carlo, but the computational cost will partially or completely offset the computation gains of avoiding nMC on the full model.
This estimation is done via regression, minimising the error
 \begin{equation*}\sum_{i=1}^{m} \sum_{j=1}^{n} \sum_{\tau > t} \Big| \sum_k w_{k,\tau} \phi_{k,\tau}\left.\left(X_{t:T}^{(j)} | X^{(i)}_{0:t}\right)\right) - \textit{CF}_{\tau}\left(X_{t:T}^{(j)} | X^{(i)}_{0:t}\right)\Big|^p \end{equation*}
where (as in the LSMC case)
 $m<<M$
but (unlike in that case) n could be as large as N if required.
Typically, this regression is done by minimising squared errors (
 $p=2$
) but some companies use absolute errors (
 $p=1$
). The approximation is based on a linear regression at each
 $\tau$
of
 $CF_{\tau}({\cdot})$
against
 $\{\phi_{k, \tau}({\cdot})\}$
, the cash functions of a set of financial instruments (bonds, swaps, equity options). This is the usual case in the industry, although some older implementations used grouped cash flows (in time buckets) and some papers, like Cambou & Filipović (Reference Cambou and Filipović2018), present the topic in terms of terminal values (that is, all time steps grouped).
The neural network approach proposed in this paper will take the form of a regress-later method, but using neural network structure for basis functions and performing a non-linear optimisation to find its parameters.
4 A Neural Network Approach
Artificial neural networks, more commonly referred to as neural networks, constitute a broad class of models. Among them, the simplest is the single-layer perceptron, which we use for our model.
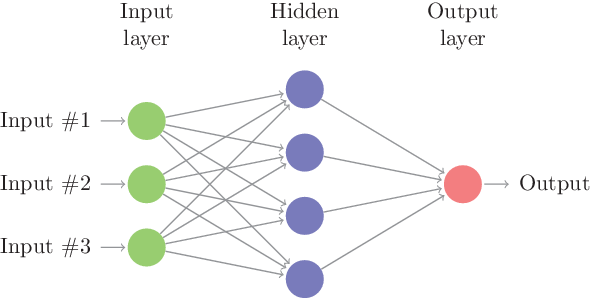
The single-layer perceptron, a type of feed-forward network, is a collection of connected units or nodes arranged in layers. Nodes of one layer connect only to nodes of the immediately preceding and immediately following layers. They are fully connected, with every node in one layer connecting to every node in the next layer. The layer that receives external data is the input layer. The layer that produces the ultimate result is the output layer. In between, there is one hidden layer. Each node is a simple non-linear function
 $\phi({\cdot})$
applied to a linear combination of its inputs – that is, those nodes to which is connected. An example of this architecture is shown in Figure 1, for three inputs and a hidden layer with a width of four nodes.
Single-layer perceptron structure.

The single-layer perceptron is a universal function approximator, as proven by the universal approximation theorem (Hornik, Reference Hornik1991).
The first neural network model that we present is a direct equivalent of equation (2) for the case of single-layer perceptron:
 \begin{equation*}\widehat{V}_t = E_t^{\mathbb{Q}}\left[\sum_{\tau > t} \sum_k w_{k,\tau} \phi_{k,\tau}(X_{0:\tau}\!)\right]= E_t^{\mathbb{Q}}\left[\sum_{\tau > t} \sum_k w_{k,\tau} \phi\left(\mathbf{v}^\intercal_{k,\tau} X_{0:\tau}\!\right)\right] \end{equation*}
where
 $\phi$
is the activation function,
 $w_{k,\tau}$
are the weights of the linear (output) layer, and
 $\mathbf{v}_{k,\tau}$
are the weights of the hidden layer. Since
 $X_0$
is a constant (it describes the initial conditions of the simulation), there is no need for an explicit bias term since the first component of
 $\mathbf{v}$
will be the constant term.
In this first neural network model, we do not know the distribution of X, which contains arbitrary economic variables, and therefore the risk-neutral expectation cannot be calculated in closed form. When this expectation is required, as in section 6.6, we present results for this model based on Monte Carlo valuation. Since this model’s input is X – the vector of economic variables – we will refer to this model as the “nn econ” when showing results.
The second neural network model is more interesting because it allows a closed-form valuation. When discussing equation (1), we pointed out that X is modelled as a function of a smaller set of normal random drivers
 $\xi$
– that is,
 $X=X(\xi)$
and
 $\dim(\xi) < \dim(X)$
. Using this fact, we express our second model as
 \begin{equation*}\widehat{V}_t = E_t^{\mathbb{Q}}\left[\sum_{\tau > t} \sum_k w_{k,\tau} \phi\left(\mathbf{v}^\intercal_{k,\tau} \xi_{0:\tau}\right)\right]; \end{equation*}
that is, we use
 $\xi$
as input instead of X (for symmetry, we keep a
 $\xi_o$
component, which is not random but constant in order to provide a bias term).
Using
 $\xi$
as input brings two advantages and one disadvantage. On the positive side, the dimensionality of
 $\xi$
is smaller than that of X (
 $dim(\xi) < dim(X)$
) and its components are uncorrelated with each other (
 $\sigma(\xi_i, \xi_j) = \delta_{ij}$
but
 $\sigma(X_i, X_j) \neq \delta_{ij}$
). This makes solving the non-linear optimisation problem much easier, requiring fewer samples and shorter training time to converge. Most importantly, the normal distribution of
 $\xi$
allows a closed-form solution to the risk-neutral expectation as we show later in Theorem 1. On the negative side,
 $CF^{\prime}(\xi)=CF \circ X(\xi)$
is a more complex function than CF(X) so – all else being equal – we would expect to need a bigger (larger k) neural network, more samples, and a longer training time. Given these advantages and disadvantages, it is not possible to tell analytically which model will show higher accuracy. Both will, therefore, be tested. Since this model’s input is
 $\xi$
– the vector of normal random variables – we will refer to this model as the “nn rand” when presenting results.
The risk-neutral value of a neural network. We have claimed that the second neural network model has a closed-form solution to the risk-neutral expectation. We now show that its derivation, which, as far as we know, has not appeared before in the literature.
Theorem 1. For a normally distributed
 $\xi$
, the time-t risk-neutral expectation,
 \begin{equation*} E_t^{\mathbb{Q}}\left[w_{0,\tau}+\sum_{k=1}^K w_{k,\tau} \phi\left(\mathbf{v}^\intercal_{k,\tau} \xi_{0:\tau}\right)\right] \end{equation*}
of a single-layer network with K hidden nodes and a ReLu activation function
 $\phi$
that models the cash flows at time
 $\tau$
is given by
 \begin{align} & w_{0,\tau}+ \sum_{k=1}^K w_{k,\tau} \frac{1}{2}\left[{_t}{\mu_{k,\tau}} + {_t}\sigma_{k,\tau}\sqrt{\frac{2}{\pi}}\exp\left({-\frac{{_t}\mu_{k,\tau}^2}{2{_t}\sigma_{k,\tau}^2}}\right)+ {_t}\mu_{k,\tau}\left(1-2\Phi\left(-\frac{{_t}\mu_{k,\tau}}{{_t}\sigma_{k,\tau}}\right)\right)\right]\\
& \qquad{_t}{\mu_{k,\tau}} =\sum_{i=0}^{\min(t, \tau)} \mathbf{v}^\intercal_{i, k,\tau} \xi_{i}\nonumber \\
& \qquad{_t}\sigma_{k,\tau}^{2} = \sum_{i=t+1}^{\tau} \lVert\mathbf{v}^\intercal_{i, k,\tau}\lVert^2 \nonumber \end{align}
Proof. Starting from the full network
 \begin{equation} E_t^{\mathbb{Q}}\left[w_{0,\tau}+ \sum_{k=1}^K w_{k,\tau} \phi\left(\mathbf{v}^\intercal_{k,\tau} \xi_{0:\tau}\right)\right] = w_{0,\tau}+ \sum_{k=1}^K w_{k,\tau} E_t^{\mathbb{Q}}\left[\phi\left(\mathbf{v}^\intercal_{k,\tau}\xi_{0:\tau}\right)\right]\end{equation}
and then focusing on the expectation of a single node, we obtain
 \begin{align} E_t^{\mathbb{Q}}\left[\phi(\mathbf{v}^\intercal_{k,\tau} \xi_{0:\tau})\right]&=E_t^{\mathbb{Q}}\left[\max(\mathbf{v}^\intercal_{k,\tau} \xi_{0:\tau}, 0) \right]\nonumber \\
&= E_t^{\mathbb{Q}}\left[\frac{\mathbf{v}^\intercal_{k,\tau} \xi_{0:\tau} + |\mathbf{v}^\intercal_{k,\tau} \xi_{0:\tau}|}{2} \right] \\
&=\frac{1}{2}\left[ E_t^{\mathbb{Q}}\left[\mathbf{v}^\intercal_{k,\tau}\xi_{0:\tau}\right] +E_t^{\mathbb{Q}}\left[ |\mathbf{v}^\intercal_{k,\tau} \xi_{0:\tau} | \right]\right]\nonumber\end{align}
Since
 $\mathbf{v}^\intercal_{k,\tau}\xi_{0:\tau}$
is normally distributed, it is defined by its mean and standard deviation,
 $\mu_{k,\tau}$
and
 $\sigma_{k,\tau}$
. Its conditional expectation at time t is
 \begin{equation*}E_t^{\mathbb{Q}}\left[\mathbf{v}^\intercal_{k,\tau} \xi_{0:\tau}\right]= {_t}{\mu_{k,\tau}} =\sum_{i=0}^{\min(t, \tau)} \mathbf{v}^\intercal_{i, k,\tau} \xi_{i}\end{equation*}
and its conditional variance at time t is
 \begin{equation*}{_t}\sigma_{k,\tau}^{2} = \sum_{i=t+1}^{\tau} \lVert\mathbf{v}^\intercal_{i, k,\tau}\lVert^2\end{equation*}
If
 $\tau \leq t$
, then its conditional variance is 0.
Since
 $\mathbf{v}^\intercal_{k,\tau}\xi_{0:\tau}$
is normally distributed,
 $|\mathbf{v}^\intercal_{k,\tau} \xi_{0:\tau}|$
follows a folded normal distribution, with conditional expectation at time t
 \begin{equation*}E_t^{\mathbb{Q}}\left[|\mathbf{v}^\intercal_{k,\tau} \xi_{0:\tau}|\right]= {_t}\sigma_{k,\tau}\sqrt{\frac{2}{\pi}}\exp\left({-\frac{{_t}\mu_{k,\tau}^2}{2{_t}\sigma_{k,\tau}^2}}\right)+ {_t}\mu_{k,\tau}\left(1-2\Phi\left(-\frac{{_t}\mu_{k,\tau}}{{_t}\sigma_{k,\tau}}\right)\right)\end{equation*}
Therefore, the expectation of each hidden node is
 \begin{equation*}E_t^{\mathbb{Q}}\big[\phi(\mathbf{v}^\intercal_{k,\tau} \xi_{0:\tau})\big]=\frac{1}{2}\left[{_t}{\mu_{k,\tau}} + {_t}\sigma_{k,\tau}\sqrt{\frac{2}{\pi}}\exp\left({-\frac{{_t}\mu_{k,\tau}^2}{2{_t}\sigma_{k,\tau}^2}}\right)+ {_t}\mu_{k,\tau}\left(1-2\Phi\left(-\frac{{_t}\mu_{k,\tau}}{{_t}\sigma_{k,\tau}}\right)\right)\right]\end{equation*}
which leads to the expectation of the full network in (3).
5 Qualitative Comparison
Besides the quantitative experiments, whose results we show in section 6.6, there are some qualitative differences of importance to practitioners. One of them is the complexity of the model, as measured by the number of modules and equations required to implement it. The second one is the amount of expert judgement required in the feature engineering. The third one is how to prevent overfitting of the training data.
5.1 Model complexity
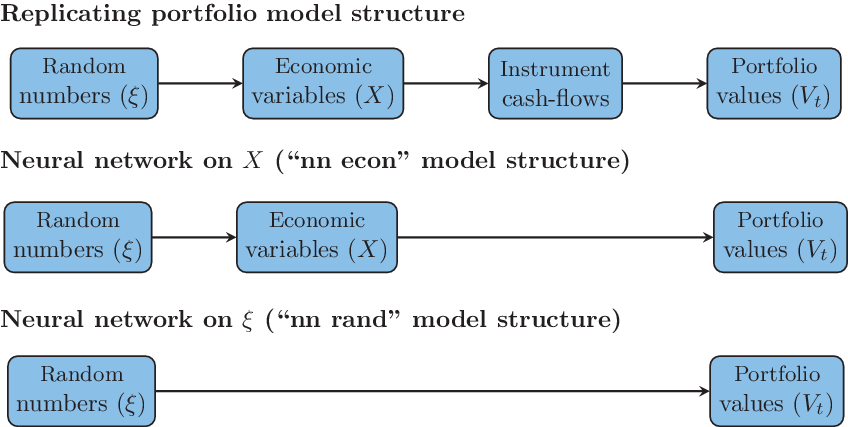
Figure 2 presents a comparison of the module structure. We describe below the sequence of calculations required for the training phase, the prediction phase being very similar to the exception that cash flows are replaced by prices (closed form or Monte Carlo, depending on the model and the instruments used).
Comparison of model structures.

All models require a random number generator. RPs and the first neural network model require the generation of the economic variables X. In the insurance industry, these two modules are usually grouped into the so-called economic scenario generator (ESG). The second neural network model does not need X for training or prediction. Finally, the RP model requires the generation of instrument cash flows in order to produce the inputs to the optimisation problem. Despite their reputation for complexity, neural networks actually lead to a simpler model, at least when measured by the number of equations and components necessary for their implementation.
5.2 Feature engineering
Any RP model requires a substantial degree of expert judgement in deciding which instrument cash flows to use in the model. When working with simple liabilities, the decision is not hard since the simplest instruments, such as bonds and equity forwards, will work well. As the liabilities grow in complexity, and if the most obvious derivatives (swaps, swaptions, European and Asian options) are not enough to capture the behaviour of the liabilities, the practitioner faces the extremely difficult task of figuring out which is the correct derivative to add to the existing mix. Since financial instruments as a whole do not form a structured basis of any meaningful space of functions, it is not possible to explore in a systematic way the set of all possible financial instruments until the best solution is found. Even worse, each attempt (adding of a new asset class) requires a substantial amount of implementation work before the results can be seen. In contrast, neural networks provide certain guarantees of convergence by simply increasing the width of the hidden layer (adding more nodes). This guarantee is provided by the “universal representation theorem”, of which different versions exist (among them Hornik, Reference Hornik1991 and Hanin & Sellke, Reference Hanin and Sellke2017). At least for the classes of functions covered under these theorems, the search for better results is extremely straightforward: just one parameter that is a direct input in any neural network software library. No new equations need to be implemented, only one input change in the existing model is required. Even when no new asset classes are required, the feature engineering problem in RPs still exists. Each asset class can have tens, hundreds or thousands of individual instruments. For example, there is one zero coupon for each possible maturity. Even worse is the case of swaptions: having to choose from a combination of a set of maturities, tenors and strikes leads to having to select thousands of instruments. All of these basis elements must be completely calculated before being fed to the linear regression problem. In contrast, neural networks create their own features adaptively based on the data. This, of course, has the downside that it requires more training data than a comparable RP model for which the expert judgement selection has been carried out correctly.
5.3 Feature selection
The reverse problem to not having enough financial instruments or not having asset classes that are complex enough is the problem of having too many instruments and asset classes. Feeding thousands of instruments to the regression problem runs the very real risk of overfitting the training data. This problem has not been entirely solved by practitioners in the industry, although the popularisation of machine learning software libraries has allowed big improvements in recent years compared with the completely manual approach used 5 or 10 years ago. In this paper, we solve this problem by using Lasso regression (Tibshirani, Reference Tibshirani1996) with the Akaike information criterion (AIC) (Akaike, Reference Akaike1998; Burnham & Anderson, Reference Burnham and Anderson2002) to choose the regularisation parameter. While there are many methods for the selection of the regularisation parameter (see the introduction to Ninomiya et al., Reference Ninomiya and Kawano2016), we chose the AIC approach with the adjustment described in Zou et al. (Reference Zou, Hastie and Tibshirani2007) as implemented in a popular machine learning Python library. For the neural network model, the constraints on model complexity are provided by selecting the layer width via cross-validation.
6 Numerical Experiments
The goal of this section is to provide a quantitative comparison between a neural network model and a RP model. It is important to clarify that there are many possible neural network models (many hyper-parameters and architectural choices) as well as many possible RP models (many options of asset classes in the instrument universe and other architectural choices). Furthermore, the results presented here are for one particular scenario generator and one insurance product. It is not possible to generalise the conclusions drawn from these results to all models and all products. However, the choices made in this example are mainstream and robust. We would, therefore, expect the conclusions to extend to many real-world situations.
6.1 Experimental setup
In order to provide a comparison between RPs and another model, it is necessary to first have access to simulated cash flows of an insurance product. In the absence of open-source libraries or data sets, there has been no option but to build our own ESG and insurance model. Hoping that the data might help others in their research in the field, we have published the full data set in Mendeley Data (Fernandez-Arjona, Reference Fernandez-Arjona2019).
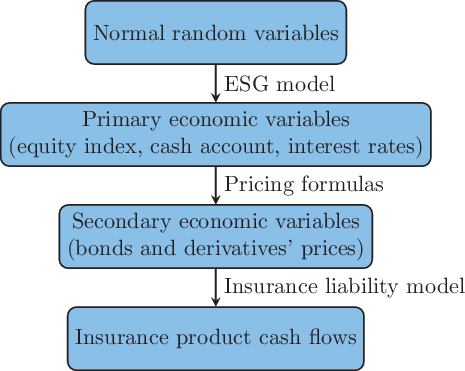
The high-level structure of the insurance model is described in Figure 3. The first module is the normal random variable generator, which feeds the second module, the ESG. We use a combination of a one-factor Hull–White for the short rate and a geometric Brownian motion process for equity returns (in excess of risk-free rates). For the interest rate model, we use the formulas in Glasserman (Reference Glasserman2013).
Modular structure of the insurance model.

In addition to the published data set, the full code of the scenario generator is available in open-source form at https://gitlab.com/luk-f-a/EsgLiL. The generator is entirely written in Python. It uses NumPy (Oliphant, Reference Oliphant2006; Van Der Walt et al., Reference Van Der Walt, Colbert and Varoquaux2011) for array operations, pandas (McKinney, Reference McKinney, van der Walt and Millman2010) for data aggregation, scikit-learn (Pedregosa et al., Reference Pedregosa, Varoquaux, Gramfort, Michel, Thirion, Grisel, Blondel, Prettenhofer, Weiss, Dubourg, Vanderplas, Passos, Cournapeau, Brucher, Perrot and Duchesnay2011) for linear regressions and neural networks training and joblib for parallelisation.
This scenario generator produces the evolution of the short rate, the cash account and the equity index. From these, we derive the rest of the asset prices: bonds, swaptions and equity options. The last module is the insurance product, a variable annuity guarantee known as “guarantee return on death”. The simulation of the insurance product begins with a policyholder population of 1,000 customers of ages 30–70. The population evolves according to a Lee–Carter stochastic mortality model (we have used the same parameters as in Lee & Carter, Reference Lee and Carter1992), which provides a trend and stochastic fluctuations. Each customer starts the simulation with an existing investment fund and a guaranteed level. In each time period, they pay a premium, which is used to buy assets; these assets are deposited in the fund. The fund is rebalanced at each time period to maintain a target asset allocation. The value of the fund is driven by the inflows from premiums, and the market value changes are driven by the interest rate, equity and real estate models. At each time step, a proportion of policyholders (as determined by the stochastic life table) die and the investment fund is paid out to the beneficiaries. If the investment fund was below the guaranteed amount, the company will additionally pay the difference between the fund value and the guaranteed amount. The guaranteed amount is the simple sum of all the premiums paid over the life of the policy. Over the course of the simulation, the premiums paid increase the guaranteed amount for each policy.
All policies have the same maturity date, of 40 years. Those policyholders alive at maturity receive the investment fund or the guaranteed value, whichever is the higher.
6.2 Ground truth and benchmark value
The quality comparison across methods requires establishing a “ground truth” – the values of the risk metrics calculated in an exact way. Given the lack of closed-form formulas, this is not possible, so we settle for performing comparisons against a benchmark value calculated in the most reliable way possible. We do this by running an extremely large Monte Carlo simulation, with 100,000 outer simulations each with 10,000 inner simulations.
The results of this calculation are shown in Table 1. The centre column shows the mean present value, the risk-neutral value of the guarantee. To the left and right, we see the expected shortfall and value at risk, at a confidence level of 1% and 99% for “left” and “right”, respectively. Both expected shortfall and value at risk are expressed as the change in monetary value in respect to the mean—that is as
 $V_1^{\textit{tail}} - V_0$
.
Benchmark values

6.3 Nested Monte Carlo and replicating portfolio benchmarks
We use two established methods to benchmark our proposed model: nMC and RPs. In all cases, we set a computational budget of 10,000 training samples. In the case of nMC, this budget is split into 100 outer and 100 inner simulations. This split was selected for being the combination with the largest number of inner simulations possible (lowest bias) with a minimum of 100 outer simulations (to be able to calculate the 1% expected shortfall). For reference, note the large difference with the benchmark value calculation made with 100,000
 $\,\times \,$
10,000 simulations. Since the training samples are randomly drawn, each estimator is itself a random variable and we treat them as such. For each method, we calculate 100 macro-runs with new random numbers in order to obtain an empirical distribution of the estimators.
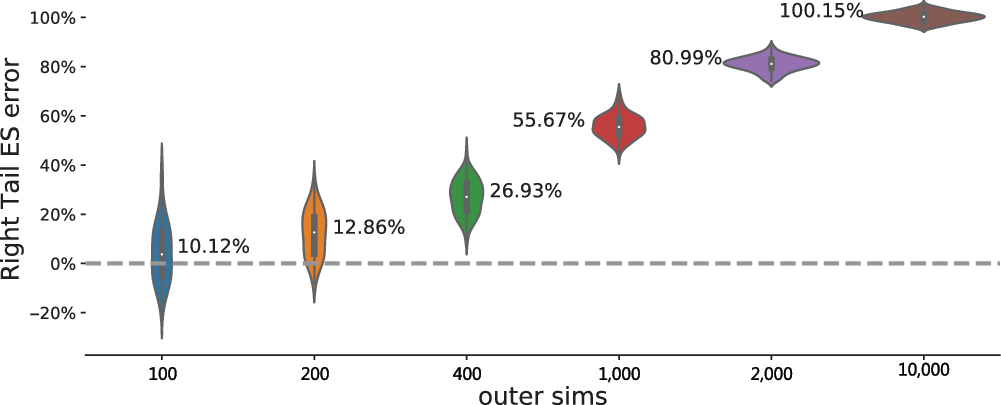
For the given sample budget of 10,000 simulations, the nMC estimator requires choosing the mix between outer and inner simulations. A higher number of outer simulations decreases variance, but a lower number of inner simulations increases bias. This effect is known as the bias–variance trade-off. Figure 4 shows this effect quite clearly using a violin plot, showing the increasing bias and decreasing variance from left to right. Each individual distribution is annotated with a percentage showing the mean absolute percentage error (MApE) of the estimator. We describe this error measure in more detail in the next section.
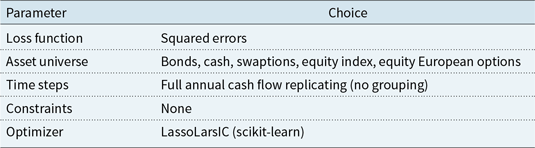
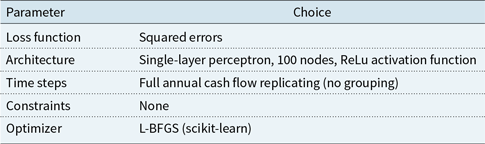
Regarding the RP benchmark, it is important to note that there is not “one” RP method that we could directly apply. RPs are a method with many variations and require the choice of a range of hyper-parameters, which explains the importance both of the description that follows and of our choices with regard to implementation. We have chosen parameters common in the industry except for one aspect. In the industry, RP models are usually run many times with different parameters (in particular different asset classes) and one RP is selected manually from those runs. Following that methodology would not allow us to create repeatable experiments or to form consistent distributions. We therefore use a Lasso regressor for the feature selection (instrument selection from the universe) and use the AIC to choose the regularisation parameter. This is provided by the machine learning library scikit-learn through the LassoLarsIC class. As for the rest of the parameters, we list them in Table 2.
Replicating portfolio parameters

Error distribution of nMC estimators (fixed total simulations). Increasing outer simulation numbers leads to reduced variance but the corresponding decrease in inner simulation numbers increases bias.

6.4 Neural network model tuning and calibration
Since the number of layers and activation function are given, there is only one hyperparameter in the neural network model, k. Traditionally, this parameter would be tuned using cross-validation. In our case, the model showed such good results with a low number –
 $k=100$
– that we have only performed a basic sensitivity analysis with
 $k=50$
and
 $k=200$
, which showed that results did not drastically improve in either case. No further tuning was necessary.
The calibration of the neural network model was performed using scikit-learn’s L-BFGS implementation.
Table 3 summarises the most important neural network parameters.
Neural network model parameters

6.5 Quality measurement
Following the arguments in Willmott & Matsuura (Reference Willmott and Matsuura2005) and Chai & Draxler (Reference Chai and Draxler2014), we choose to focus on absolute errors rather than squared errors for model comparison since we do not need to penalise large outliers, and the errors are biased and most likely do not follow a normal distribution. We therefore use mean absolute errors as a metric of mean model errors. Other moments are not quantitatively measured, but the histograms of the distributions are presented for qualitative assessment.
The error to be considered is that of each risk metric (ES or VaR) and each tail (left tail or right tail), measured as a percentage error against the benchmark value for that metric.
Based on the 100 macro-runs described in the previous section, we derive an empirical distribution for each estimator,
 $\{\rho_i\}_{i=1}^{100}$
where each individual sample is denoted as
 $\rho_i$
. The MApE is defined as
 \begin{equation*} \frac{1}{100}\sum_i^R \bigg| \frac{\widehat{\rho_i}}{\rho} - 1 \bigg| \end{equation*}
where
 $\rho$
is the benchmark value of the estimator.
All model results are mean-centred before risk metrics are calculated.
Figure 4 shows an example of the application of this error measurement for the various parameters in the nMC estimator. We can see that the estimator with 100 outer and 100 inner simulations has the lowest MApE. We therefore use this estimator in all subsequent comparison with other methods.
It is important to note that the benchmark value calculation is completely out-of-sample in respect to the training of any of the methods. Hence, all comparisons shown below are fully out-of-sample.
6.6 Results
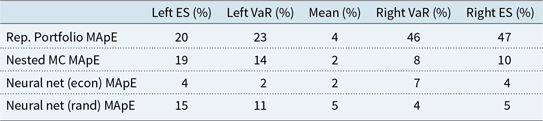
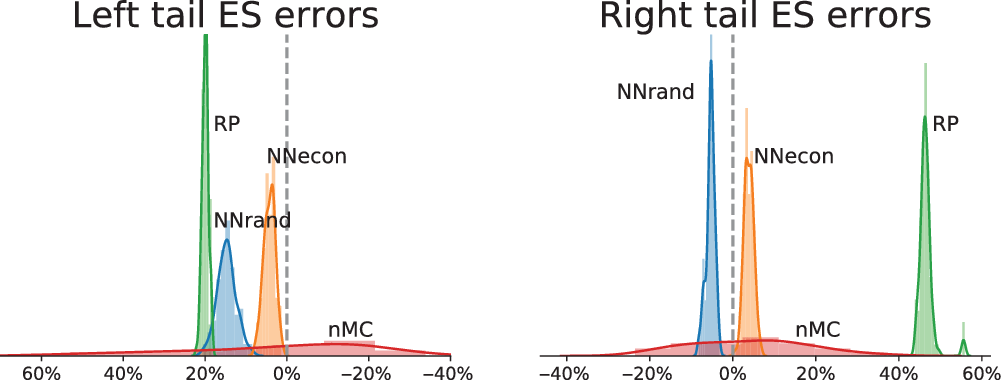
The results of the numerical experiments are presented in Table 4 and Figure 6. The columns show the MApE for each of the four risk metrics and the mean present value. The rows show the errors of each different method.
Comparison of errors measured as MApEs

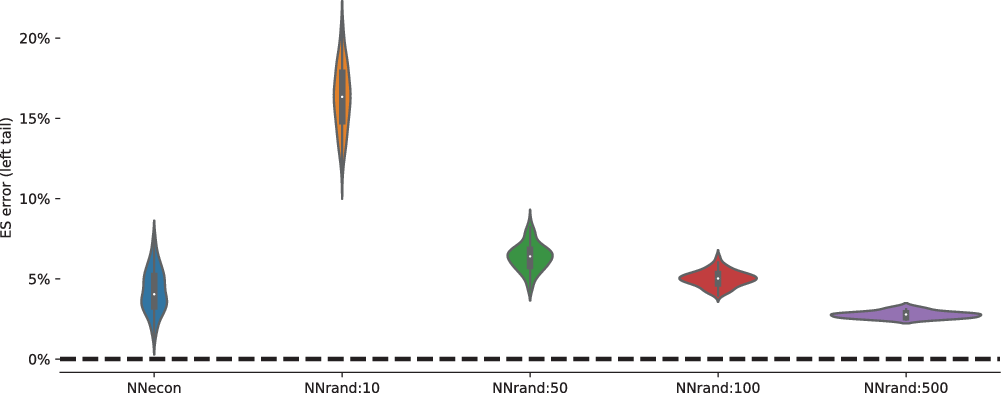
Effect of increasing training sample size on second neural network model. The decrease in mean and standard deviation of errors can be clearly seen as samples are increased from 10,000 to 500,000.

The errors of the RP model are shown in the first row. In terms of mean absolute errors, this method yields the worst results of the group. Interestingly, the results are worse than using a nMC approach (second row). This is probably due to the very complex and non-linear nature of the guarantee function that is being replicated. Most likely, the asset classes in the instrument universe are not complex enough, or not sufficiently path dependent to replicate the guarantee.
While one might consider adding more asset classes, it becomes immediately clear that there is no obvious next step. This is a key disadvantage of RPs versus polynomial or neural network methods: the complexity of the approximation (richness of the approximating function) is not a parameter that one can easily modify. Which asset class to add next is unknown, and there are hundreds of exotic derivatives that one might try. In order to test any of them, one must programme the cash flows and valuation functions before any testing can be done. Therefore, the search for a better model takes much longer, and success is not even guaranteed since one might not find the correct derivative.
By contrast, when working with a polynomial approximation, one might increase the maximum degree of the polynomial, and with a neural network, one might add layers or make each layer wider (adding more nodes). It only takes a few keystrokes to make a more powerful model. Polynomial and neural network models are guaranteed to succeed under certain conditions (smooth enough functions, sufficient samples, etc.), at least asymptotically. These models are, therefore, more amenable to automated solutions than are RP models, which require an expert setup.
The last two rows in Table 4 present the results for each type of neural network models. Each model shows better results than nMC or RPs. The first type (economic variable inputs) shows the best results of the group, better than the second type (random variable inputs).
Despite the advantages of the second type of neural network model, the data show that 10,000 samples were not enough to learn the more complex function
 $CF \circ X$
sufficiently well to have higher accuracy than the first type of neural network model, which only had to learn the simpler function CF. In Figure 5, we can see that the second model (called “NNrand:10” when trained on 10,000 samples, “NNrand:50” when trained on 50,000 samples, etc.) does perform better than the first model (“NNecon”) once it is given a larger number of samples.
Figure 6 shows the empirical distribution of each of the estimators (trained on 10,000 samples for comparability). We can observe the relative standard deviations of the estimators and find, as previously seen in Figure 4, that nMC has low bias and a very high variance compared to the other methods. Interestingly, the standard deviations of the neural network models are not much higher than that of the RPs, despite each macro-run using a completely different set of inputs. This indicates that the calibration of the neural networks is robust to the variance of the inputs. In this regard, neural networks have a bad reputation due to their non-convex loss function. A common problem associated with the training of neural networks is that of local minima. Together with the common use of stochastic optimisation methods (such as stochastic gradient descent), this usually contributes to a high variance of predictions. In this paper, we have taken certain steps to reduce this problem, by (a) using a network of a small size (100 nodes) and (b) using the Broyden–Fletcher–Goldfarb–Shanno (BFGS) optimisation algorithm, which is non-stochastic. These decisions contribute to keeping the variance of the estimator within reasonable levels.
6.7 Runtime
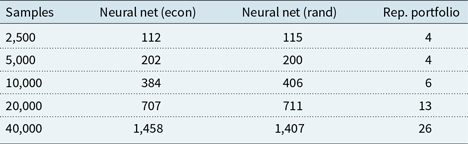
As shown in Table 4 and Figure 6, the neural network models perform very well in terms of quality. Since these models require a non-linear regression to find their parameters, they can be expected to be slower than a purely linear model, such as a RP. Table 5 shows how long it takes to run each model “end to end” – that is, including feature generation, calibration and prediction.
Comparison of runtime (in seconds) for training data sets of different sizes

Empirical distribution of estimators (with 10,000 training samples). Each neural network model delivers more accurate results than the benchmark models.

We can see that training a neural network model takes longer than training a RP. Both types of model scale approximately linearly to the size of the training set. However, even at the far end (40,000 training samples), the neural network models do not take more than 30 minutes (on a single-core AMD Opteron 6380) which is perfectly acceptable from a practitioner’s point of view. Generating the inputs required for economic capital calculations can normally take from several hours to several days; and 30 minutes can therefore fit easily within the normal production schedule of an insurance company.
7 Conclusions
Based on a simulated insurance product, we have presented a comparison of nMC, RPs and neural networks as methods for calculating solvency capital. The numerical experiments show that neural networks perform very well, even in a highly non-linear problem with a small number of training samples. The mean errors are the lowest of the group and the distributions of the results do not show qualitatively, large variance. A qualitative analysis suggests that the neural network model can also have advantages in terms of model simplicity.
In the construction of this neural network model, we make use of what we believe is a novel formula for calculating the risk-neutral price of a neural network. Additionally, we make two contributions for other researchers in the field: a description of an automated RP model (necessary for reliable comparisons) and a full data set and software library for the production of economic scenarios.
Acknowledgements
This paper is based on our presentation at the 2019 Insurance Data Science Conference (ETH Zurich). We thank the scientific committee for its invitation to present, and all those that provided helpful comments during the preparation: Mariana Andres, Dr Gregor Reich and the participants of the Quantitative Business Administration PhD Seminar. Special thanks go to Prof. Karl Schmedders and Prof. Damir Filipovic, for reviewing the presentation and for all we have learnt from them, without which this paper would not be possible.