


Introduction
Eating disorders (EDs) are associated with considerable psychological toll and increased mortality (Schmidt et al., Reference Schmidt, Adan, Böhm, Campbell, Dingemans, Ehrlich, Elzakkers, Favaro, Giel, Harrison, Himmerich, Hoek, Herpertz-Dahlmann, Kas, Seitz, Smeets, Sternheim, Tenconi, van Elburg, van Furth and Zipfel2016). EDs prevalence is rising (Galmiche et al., Reference Galmiche, Déchelotte, Lambert and Tavolacci2019); an estimated one in seven women will experience an ED at some point in their life (Micali et al., Reference Micali, Martini, Thomas, Eddy, Kothari, Russell, Bulik and Treasure2017). However, less than a third of people with EDs will receive any treatment (Micali et al., Reference Micali, Martini, Thomas, Eddy, Kothari, Russell, Bulik and Treasure2017) and even fewer receive an empirically supported treatment (EST).
Cognitive behavioural therapy for EDs (CBT-ED) uses basic principles of traditional CBT to directly address core ED psychopathology, including dysfunctional thoughts (e.g. over-evaluation of shape and weight) and weight-control and body checking/avoidance behaviours, using well-defined cognitive and behavioural strategies (e.g. cognitive restructuring, exposure, self-monitoring, homework, collaborative weighing). Research has demonstrated that CBT-ED is effective for EDs (Agras and Bohon, Reference Agras and Bohon2021; Monteleone et al., Reference Monteleone, Pellegrino, Croatto, Carfagno, Hilbert, Treasure, Wade, Bulik, Zipfel, Hay, Schmidt, Castellini, Favaro, Fernandez-Aranda, Il Shin, Voderholzer, Ricca, Moretti, Busatta, Abbate-Daga and Solmi2022; van der Berg et al., Reference van den Berg, Schlochtermeier, Koenders, de Mooij, de Jonge, Goudriaan, Blankers, Peen and Dekker2022; Zeeck et al., Reference Zeeck, Herpertz-Dahlmann, Friederich, Brockmeyer, Resmark, Hagenah, Ehrlich, Cuntz, Zipfel and Hartmann2018). Indeed, one study found approximately 66% of patients with any form of ED experienced remission following enhanced CBT (CBT-E), a form of CBT-ED developed by Fairburn (Reference Fairburn2008), compared with 33.3% remission following interpersonal therapy (IPT) (Fairburn et al., Reference Fairburn, Bailey-Straebler, Basden, Doll, Jones, Murphy, O’Connor and Cooper2015). Indeed, clinical guidelines in the UK list CBT-ED as a first choice EST in the treatment of EDs for adults (National Institute for Health and Care Excellence, 2017). Therapists’ competent use of core components of empirically supported treatments is essential for the translation of these therapies, including CBT-ED, to real-world patients. Indeed, treatment integrity is linked to improved clinical outcomes across a range of approaches (Power et al., Reference Power, Noble, Simmonds-Buckley, Kellett, Stockton, Firth and Delgadillo2022) and adherence to CBT-ED specifically has been associated with improved outcomes (Folke et al., Reference Folke, Daniel, Gondan, Lunn, Tækker and Poulsen2017).
Despite this, numerous studies demonstrate poor adherence to ESTs in the ED field (Cooper and Bailey-Straebler, Reference Cooper and Bailey-Straebler2015; Fairburn and Wilson, Reference Fairburn and Wilson2013; Kazdin et al., Reference Kazdin, Fitzsimmons-Craft and Wilfley2017; Lilienfeld et al., Reference Lilienfeld, Ritschel, Lynn, Brown, Cautin and Latzman2013a). Although many clinicians (50–80%) report using an EST manual when treating individuals with EDs (Mulkens et al., Reference Mulkens, de Vos, de Graaff and Waller2018; Waller et al., Reference Waller, Stringer and Meyer2012), as little as 6% indicate close adherence to the manualised treatment (Tobin et al., Reference Tobin, Banker, Weisberg and Bowers2007). For example, Waller et al. (Reference Waller, Stringer and Meyer2012) discovered no essential CBT-ED skill (e.g. cognitive restructuring, food diaries, exposure, routine weighing) was utilised by 50% or more of a sample of clinicians who indicated routinely using CBT in their treatment of ED patients. Similarly, Von Ranson et al. (Reference Von Ranson, Wallace and Stevenson2013) found many clinicians did not report consistent use of core CBT techniques despite endorsing CBT as their primary treatment approach when treating EDs. Mulkens et al. (Reference Mulkens, de Vos, de Graaff and Waller2018) found that the core CBT-ED techniques (e.g. cognitive restructuring, food diaries, exposure, and routine weighing) were consistently used by less than 45% of clinicians who indicated using CBT in the treatment of EDs, and only 10% of clinicians used these four core strategies in the majority of their patients.
Barriers to adherence
Many obstacles can impact adherence to ESTs, including third-party payer coverage, cost of manuals, and lack of time necessary for learning new manualised treatments; and limited training/supervision opportunities present barriers to implementing ESTs in real world settings (Nelson et al., Reference Nelson, Steele and Mize2006; Pagoto et al., Reference Pagoto, Spring, Coups, Mulvaney, Coutu and Ozakinci2007). However, potentially modifiable clinician characteristics, namely anxiety and attitudes towards evidence-based practice (EBP) have been identified as correlates of adherence to ESTs among eating disorder clinicians in a variety of studies (Kosmerly et al., Reference Kosmerly, Waller and Lafrance Robinson2015; Mulkens et al., Reference Mulkens, de Vos, de Graaff and Waller2018; Waller et al., Reference Waller, Stringer and Meyer2012; Waller et al., Reference Waller, Mountford, Tatham, Turner, Gabriel and Webber2013). These clinician characteristics could be addressed through intervention or clinical training, making it essential to understand their impact, jointly and separately, on adherence to ESTs.
Clinician anxiety is correlated with lower adherence to core CBT-ED elements, particularly exposure, behavioural experiments, structured eating, and weighing (Kosmerly et al., Reference Kosmerly, Waller and Lafrance Robinson2015; Waller et al., Reference Waller, Stringer and Meyer2012). One qualitative study suggests clinician intolerance of uncertainty (IU) may be a driving factor in CBT adherence (Last et al., Reference Last, Schriger, Timon, Frank, Buttenheim, Rudd, Fernandez-Marcote, Comeau, Shoyinka and Beidas2021). IU encompasses prospective anxiety (inability to tolerate unpredictable events) and inhibitory anxiety (inability to act due to uncertainty). Indeed, in the context of CBT-ED, prospective clinician IU has been correlated with greater concern about conducting exposures (Turner et al., Reference Turner, Tatham, Lant, Mountford and Waller2014) whereas inhibitory clinician IU is associated with fewer exposures and behavioural experiments (Mulkens et al., Reference Mulkens, de Vos, de Graaff and Waller2018). Thus, clinician anxiety, and IU in particular, may be an important, potentially modifiable factor (Becker-Haimes et al., Reference Becker-Haimes, Brady, Jamison, Jager-Hyman, Reilly, Patel, Brown, Mandell and Oquendo2023) that influences clinicians’ adherence to CBT-ED.
Clinicians’ attitudes towards EBP also have a logical and consistent impact on adherence (Pagoto et al., Reference Pagoto, Spring, Coups, Mulvaney, Coutu and Ozakinci2007). The perception that ESTs for EDs are inflexible, rigid, and unable to be individualised has been identified as a common barrier to EST adherence in several studies (Lilienfeld et al., Reference Lilienfeld, Ritschel, Lynn, Brown, Cautin and Latzman2013a; Simmons et al., Reference Simmons, Milnes and Anderson2008; Tobin et al., Reference Tobin, Banker, Weisberg and Bowers2007; Von Ranson et al., Reference Von Ranson, Wallace and Stevenson2013), with some clinicians reporting the belief that ESTs discount notable therapeutic processes, such as the therapeutic alliance or individualised case conceptualisations (Waller et al., Reference Waller, Mountford, Tatham, Turner, Gabriel and Webber2013).
While evidence suggests that clinician IU and attitudes towards EBP are correlates of clinician adherence to ESTs, little research has examined the interaction between these two factors. It is possible that favourable attitudes toward EBP may moderate the association of clinician IU with treatment adherence, possibly because a more favourable attitude towards EBP may lead to less uncertainty about the real-world efficacy of EST. If attitudes towards EBP do, in fact, moderate the association between clinician IU and adherence, it may help inform targeted clinical training. For example, providing targeted training in EBP for new clinicians with higher intolerance of uncertainty may be especially impactful in increasing long-term adherence of evidence-based treatment for patients seeking treatment for eating disorders.
Present study
The current study aims to examine the main effects of clinician IU and attitudes towards EBP as well as the interaction of clinician IU and attitudes towards EBPs on their adherence to CBT-ED techniques. Specifically, we hypothesise that (1) clinicians’ IU will be negatively associated with adherence to CBT-ED, (2) more favourable attitudes towards EBPs will be positively associated with adherence to CBT-ED, and (3) favourable attitudes towards EBPs will buffer the negative effect of IU on adherence to CBT-ED.
Method
Participants
Participation was solicited from ED clinicians through treatment listservs, social media posts, emails, and snowball recruiting. Participants were eligible if they were 18 years or older, spoke English, had a master’s degree or doctorate in psychology or a related field, and identified as a counsellor, therapist, or psychologist with a licence to practise in the United States and who provided therapy services to five or more patients with EDs in the past 12 months. Although having received formal training in CBT was not an inclusion criterion, all but two participants indicated formal training in CBT.
Power analysis calculations (Faul et al., Reference Faul, Erdfelder, Lang and Buchner2007) indicated 186 participants would allow a small-to-moderate effect size ( f 2 = .06) to be detected as statistically significant at p < .05 level with 80% power. To account for participants excluded due to careless responding (Oppenheimer et al., Reference Oppenheimer, Meyvis and Davidenko2009), a larger sample was collected. The final respondent number was 330; however, 109 respondents were removed for not meeting inclusion criteria or skipping >50% of the survey. Of the remaining 221 participants, 10 (4.5% of the sample) had incomplete data. Therefore, the primary analyses were conducted with a sample of 211.
Procedure
Prior to study initiation, approval was received from the Sam Houston State University Institutional Review Board (SHSU IRB-2021-156), and all study procedures conformed to the Declaration of Helsinki. The study was not pre-registered. The Qualtrics survey asked for no identifying information and the IP address tracker was disabled to ensure anonymity; however, participants were asked to list the state(s) in which they are licensed and practise. Participants electronically consented by clicking a button and were administered the survey. Participants did not receive any reimbursement for participating.
Measures
Demographics
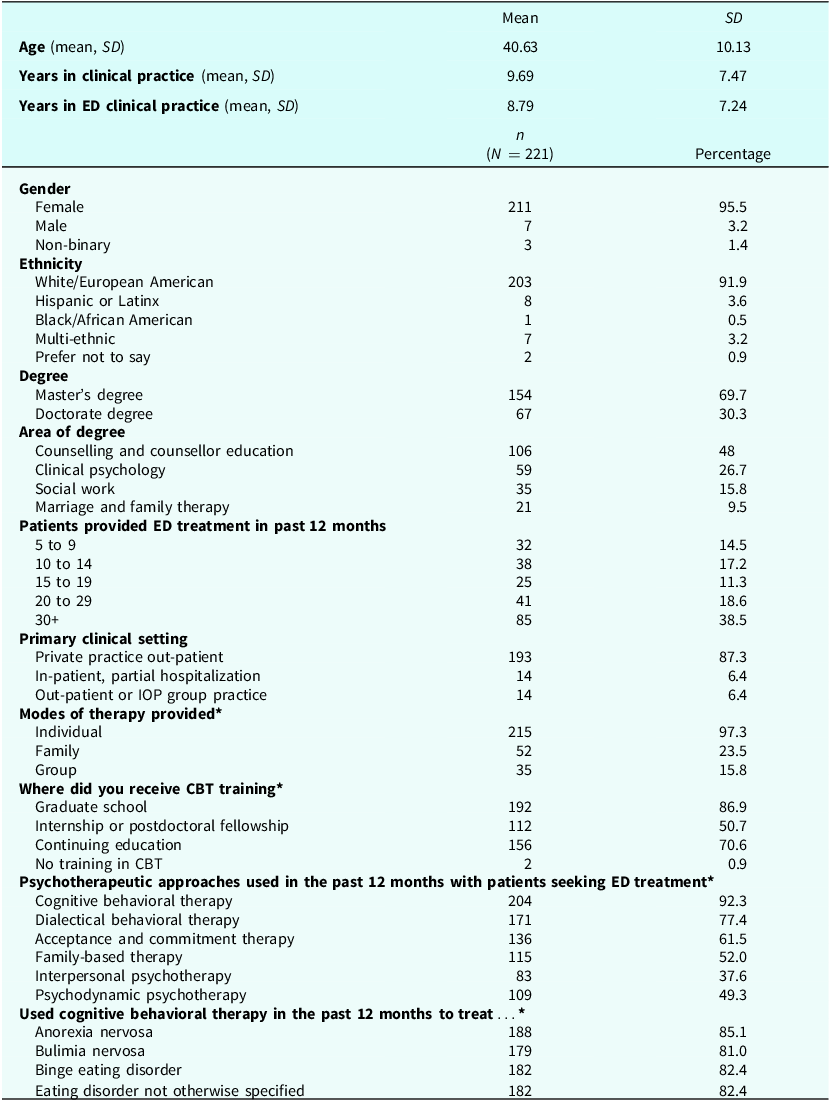
Participants provided demographic information as listed in Table 1.
Participant information

Table 1. Long description
The table provides detailed demographic information of participants. It includes the following columns: Age (mean, SD), Years in clinical practice (mean, SD), Years in ED clinical practice (mean, SD), Gender (n, Percentage), Ethnicity (n, Percentage), Degree (n, Percentage), Area of degree (n, Percentage), Patients provided ED treatment in past 12 months (n, Percentage), Primary clinical setting (n, Percentage), Modes of therapy provided (n, Percentage), Where did you receive CBT training (n, Percentage), Psychotherapeutic approaches used in the past 12 months with patients seeking ED treatment (n, Percentage), and Used cognitive behavioral therapy in the past 12 months to treat (n, Percentage). Row 1: Age (mean, SD): 40.63, 10.13. Row 2: Years in clinical practice (mean, SD): 9.69, 7.47. Row 3: Years in ED clinical practice (mean, SD): 8.79, 7.24. Row 4: Gender (n, Percentage): Female 211, 95.5; Male 7, 3.2; Non-binary 3, 1.4. Row 5: Ethnicity (n, Percentage): White/European American 203, 91.9; Hispanic or Latinx 8, 3.6; Black/African American 1, 0.5; Multi-ethnic 7, 3.2; Prefer not to say 2, 0.9. Row 6: Degree (n, Percentage): Master’s degree 154, 69.7; Doctorate degree 67, 30.3. Row 7: Area of degree (n, Percentage): Counselling and counsellor education 106, 48; Clinical psychology 59, 26.7; Social work 35, 15.8; Marriage and family therapy 21, 9.5. Row 8: Patients provided ED treatment in past 12 months (n, Percentage): 5 to 9 32, 14.5; 10 to 14 38, 17.2; 15 to 19 25, 11.3; 20 to 29 41, 18.6; 30+ 85, 38.5. Row 9: Primary clinical setting (n, Percentage): Private practice out-patient 193, 87.3; In-patient, partial hospitalization 14, 6.4; Out-patient or IOP group practice 14, 6.4. Row 10: Modes of therapy provided (n, Percentage): Individual 215, 97.3; Family 52, 23.5; Group 35, 15.8. Row 11: Where did you receive CBT training (n, Percentage): Graduate school 192, 86.9; Internship or postdoctoral fellowship 112, 50.7; Continuing education 156, 70.6; No training in CBT 2, 0.9. Row 12: Psychotherapeutic approaches used in the past 12 months with patients seeking ED treatment (n, Percentage): Cognitive behavioral therapy 204, 92.3; Dialectical behavioral therapy 171, 77.4; Acceptance and commitment therapy 136, 61.5; Family-based therapy 115, 52.0; Interpersonal psychotherapy 83, 37.6; Psychodynamic psychotherapy 109, 49.3. Row 13: Used cognitive behavioral therapy in the past 12 months to treat (n, Percentage): Anorexia nervosa 188, 85.1; Bulimia nervosa 179, 81.0; Binge eating disorder 182, 82.4; Eating disorder not otherwise specified 182, 82.4.
*Total is greater than 221 because participants were instructed to select all that applied.
Adherence
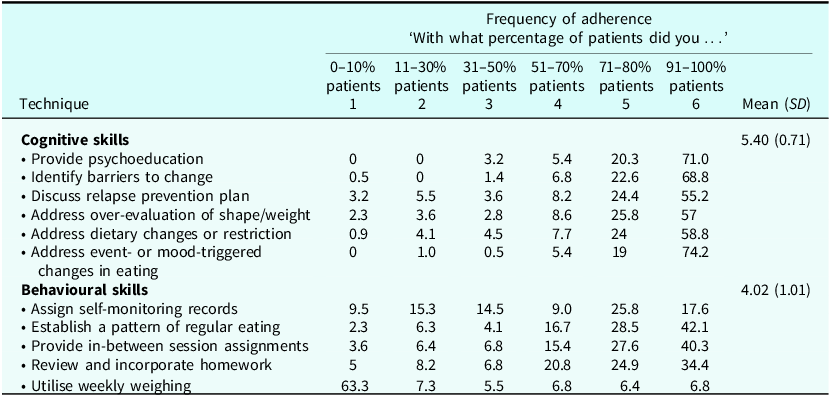
Participants estimated the percentage of ED patients with whom they implemented each of 15 CBT techniques using a scale ranging from 0 to 100% with 10-point increments (e.g. ‘Across the course of therapy in the past 12 months, with what percentage of patients with eating disorders did you provide assignments for patients to engage in between sessions?’, with answer choices of 0–10%, 11–20%, etc.). These techniques (listed in Table 2) were derived from ‘Widely Supported Practice’ techniques in Waller et al. (Reference Waller, Stringer and Meyer2012) and specific techniques from Fairburn’s manual on CBT-E (Fairburn, Reference Fairburn2008). Scores were re-binned to increase normality of distribution, where participants who indicated using a skill with 0–10% of their patients were scored as 1, 11–30% scored as 2, 31–50% as 3, 51–70% as 4, 71–91% as 5, and 91–100% as 6. Thus, responses on each item of the 15 items ranged from 1 to 6.
Endorsement of frequency of adherence to cognitive and behavioural CBT-ED skills

Table 2. Long description
A table titled ‘Frequency of adherence’ showing the percentage of patients with whom therapists used various cognitive and behavioral CBT-ED skills. The table has 15 rows and 7 columns. The columns are labeled with percentages: 0-10 percent patients, 11-30 percent patients, 31-50 percent patients, 51-70 percent patients, 71-80 percent patients, 91-100 percent patients, and Mean (SD). The rows are labeled with different techniques under two main categories: Cognitive skills and Behavioral skills. Cognitive skills include techniques like providing psychoeducation, identifying barriers to change, discussing relapse prevention plans, addressing over-evaluation of shape/weight, addressing dietary changes or restrictions, and addressing event- or mood-triggered changes in eating. Behavioral skills include assigning self-monitoring records, establishing a pattern of regular eating, providing in-between session assignments, reviewing and incorporating homework, and utilizing weekly weighing. Each cell in the table contains a percentage value indicating the frequency of adherence to each technique. The mean and standard deviation (SD) for each technique are also provided in the last column. Notable trends include high adherence to providing psychoeducation and addressing event- or mood-triggered changes in eating, with mean values of 5.40 and 5.40 respectively. Lower adherence is seen in assigning self-monitoring records and utilizing weekly weighing, with mean values of 4.02 and 4.02 respectively.
Frequency of adherence values represent percent of clinicians (n = 221) who indicated each response for each CBT-ED cognitive and behavioural technique assessed.
To reduce the number of analyses (i.e. avoid having 15 separate outcome variables) and due to evidence suggesting that intolerance of uncertainty (IU) is may be differentially associated with ‘behavioural’ and ‘cognitive’ elements of CBT-ED (e.g. IU is more strongly associated with exposure, behavioural experiments, weighing), factor analysis was used to determine the factor structure of the 15 CBT skills (see ‘Factor analysis…’ section). Average adherence to cognitive and behavioural techniques were used in subsequent analyses and demonstrated adequate internal consistency (Cronbach’s alpha for cognitive techniques = .80 and behavioural techniques= .71).
Intolerance of Uncertainty Scale-Short Form (IUS)
The IUS is a 12-item measure that assesses reactions to ambiguous situations, uncertainty, and future events on a 5-point Likert scale from 1 (not at all characteristic of me) to 5 (entirely characteristic of me). Seven items assess prospective IU (e.g. active worry, anticipating future events) and five items assess inhibitory IU (e.g. inability to act when faced with uncertainty), and all 12 items can be summed to create a total score representing a general intolerance of uncertainty (Carleton et al., Reference Carleton, Norton and Asmundson2007). For this study, the Cronbach’s alpha for the IUS total, prospective, and inhibitory scales were excellent (.88, .84, and .77, respectively).
Evidence-Based Practice Attitude Scale (EBPAS)
The EBPAS is a 15-item measure of attitudes toward the adoption of evidence-based practices (EBPs) in mental health clinicians on a 5-point Likert Scale ranging from 1 (not at all) to 5 (to a very great extent), with items averaged and the total score representing the clinician’s attitudes to EBPs (Aarons, Reference Aarons2004). The current study used the total score, which had a Cronbach’s alpha of .83.
Data analyses
Data were cleaned, an exploratory factor analysis was conducted for the adherence variable, and preliminary analyses were conducted to test assumptions and assess for covariates. Demographic variables were considered covariates if they were significantly associated (p < .05) with adherence to cognitive or behavioural techniques. Variable inflation factors (VIFs) in each model were <1.6, indicating that multi-collinearity was not a problem (Robinson and Schumacker, Reference Robinson and Schumacker2009). Descriptive statistics were examined to determine adherence to cognitive and behavioural techniques. For the primary analyses, regression models tested the main effect of IUS (Hypothesis 1) and attitudes towards EBP (Hypothesis 2), and the interaction effect of IUS and attitudes towards EBP (Hypothesis 3) on frequency adherence to cognitive and behavioural CBT-ED skills using the PROCESS Macro Model 1 (Hayes, Reference Hayes2022) for SPSS v.27. All hypothesised results report standardised regression coefficients.
Results
Factor analysis of frequency of adherence to CBT-ED skills
A factor analysis was conducted to determine the factor structure of adherence to 15 core CBT techniques. Principal component analysis was utilised for the extraction method and Varimax with Kaiser normalisation for the rotation method. Full results of the factor analysis are provided in Supplement 1 (see Supplementary material). The analysis revealed four factors: cognitive (eigenvalue 4.8), behavioural (eigenvalue 1.8), collaborative (eigenvalue 1.5), and a separate fourth factor that included the single item of weighing patients. However, due to the behavioural nature of weighing, the item was placed on the behavioural factor. The techniques that loaded onto the collaborative factor were not specific to CBT-ED (e.g. encouraging independence); thus, only the cognitive and behavioural adherence scales were included as outcome variables.
Participant characteristics
Descriptive information for the total sample (N = 221) are given in Table 1. Participants reported holding a licence and practising in 42 of 50 states in the United States. The most represented states were Texas (n = 31), California (n = 19), North Carolina (n = 19), and Illinois (n = 15). Most participants (87%) indicated receiving training in CBT in graduate school and only two participants indicating never receiving training in CBT, one of whom indicated providing CBT-ED in the past 12 months. Nearly all participants (92%) indicated providing CBT to patients seeking treatment for eating disorders in the past 12 months, and other treatment approaches were also commonly endorsed (e.g. DBT, ACT, FBT). Thus, 99.5% of the sample (n = 220) indicated receiving formal training in CBT and/or using CBT with patients with EDs in the past 12 months.
Determining covariates
Ethnicity was significantly associated with adherence but was not included as a covariate due to the homogeneity in ethnicity (see Table 1). Participants reporting more ED patients (e.g. >20) indicated greater adherence to cognitive (p = .011) and behavioural (p = .002) techniques compared with those reported fewer patients (e.g. <14). Duration of ED clinical work (r = .18, p = .008) and receiving training in CBT on internship or during postdoctoral (t 219 = –2.39, p = .018) were associated with greater adherence to behavioural techniques. Thus, when adherence to cognitive techniques was the outcome variable, number of patients treated with EDs in the past year was included as the only covariate. When adherence to behavioural techniques was the outcome variable, number of patients treated with EDs in the past year, duration of ED clinical work, and receipt of CBT training on internship or postdoctoral fellowship were included as covariates.
Adherence to CBT-ED techniques
Participants reported an average adherence to cognitive techniques of 5.40, which corresponds to using cognitive techniques with 71–80% of patients, and an average adherence to behavioural techniques of 4.02, which corresponds to using behavioural skill with 51–70% of patients (Table 2). When examining the individual techniques, most (>55%) reported using each of the six cognitive techniques with over 90% of their patients, whereas fewer than half reported using any of the five behavioural skills with over 90% of patients. Of note, 63.3% of participants (n = 140) stated they do not weigh their patients at all, and only 6.8% of clinicians indicated they weighed over 90% of their patients.
Means and correlations of study variables can be seen in Table 3. Clinician intolerance of uncertainty (IUS), particularly inhibitory anxiety, and attitudes towards evidence-based practice (EBPAS) both had weak-to-moderate correlations with adherence to cognitive and behavioural techniques in negatively and positive directions, respectively.
Descriptive statistics and correlations for study variables

Table 3. Long description
A table with six rows and seven columns presenting descriptive statistics and correlations for study variables. The columns are labeled as Variable, Mean, SD, 1, 2, 3, 4, 5, and 6. The rows are labeled with different variables and their corresponding values. Row 1: IUS-Total, Mean: 22.41, SD: 6.45. Row 2: IUS-Prospective, Mean: 14.92, SD: 4.23, Correlation with IUS-Total: 0.953**. Row 3: IUS-Inhibitory, Mean: 7.49, SD: 2.74, Correlation with IUS-Total: 0.883**, Correlation with IUS-Prospective: 0.700**. Row 4: EBPAS, Mean: 3.71, SD: 0.54, Correlation with IUS-Total: -0.085, Correlation with IUS-Prospective: -0.054, Correlation with IUS-Inhibitory: -0.118. Row 5: Adherence to cognitive skills, Mean: 5.4, SD: 0.71, Correlation with IUS-Total: -0.171*, Correlation with IUS-Prospective: -0.109, Correlation with IUS-Inhibitory: -0.235**, Correlation with EBPAS: 0.178**. Row 6: Adherence to behavioural skills, Mean: 4.02, SD: 1.01, Correlation with IUS-Total: -0.209**, Correlation with IUS-Prospective: -0.174*, Correlation with IUS-Inhibitory: -0.224**, Correlation with EBPAS: 0.313**, Correlation with Adherence to cognitive skills: 0.518**. The table shows the relationships between different variables, with some correlations being statistically significant as indicated by asterisks.
*p < .05, **p < .01. IUS, Intolerance of Uncertainty Scale; EBPAS, Evidence-Based Practice Attitude Scale.
The association of clinician intolerance of uncertainty and attitudes toward ESTs with adherence to CBT-ED
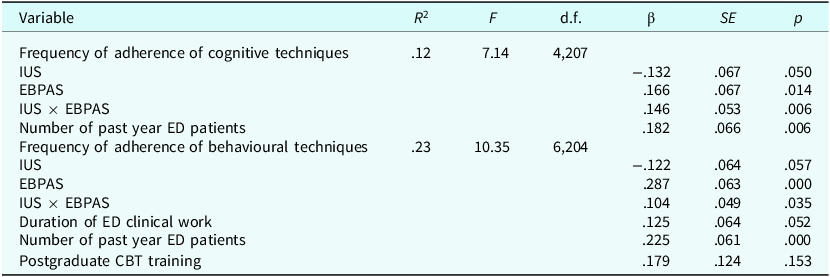
The results of regression analyses can be seen in Table 4. The model explained 12% of the variance in adherence to cognitive techniques (p < .001) and 23% of the variance in adherence to behavioral techniques (p < .001). In partial support of Hypothesis 1, there was a significant main effect of IUS on adherence to cognitive techniques (β = –.13, p = .050), but the main effect of IUS on adherence to behavioural techniques did not reach statistical significance (β = –.12, p = .057). In keeping with Hypothesis 2, there was a significant main effect of EBPAS on adherence to cognitive (β = .17, p = .014) and behavioural (β = .29, p < .001) techniques. Finally, consistent with Hypothesis 3, there was a significant moderating effect of EBPAS on the association of IUS with adherence cognitive (p = .006) and behavioural techniques (p = .035), such that more favourable attitudes towards EBP buffered the negative association between IUS and adherence (Fig. 1). Specifically, conditional analyses revealed that IUS was negatively associated with adherence to cognitive (β= –.25, p = .001) and behavioural (β = –.22, p = .003) techniques only when attitudes towards EBPs were negative (i.e. when EBPAS scores were in the 16th percentile), but not when attitudes towards EBPs were average (i.e. in the 50th percentile) (p > .06) or positive (i.e. in the 84th percentile) (p > .8).
The association of clinician intolerance of uncertainty and attitudes toward evidence-based practice with adherence to CBT-ED

Table 4. Long description
A table showing regression analysis results for adherence to cognitive and behavioral techniques. The table has 8 rows and 6 columns. The columns are labeled Variable, R-squared, F, d.f., beta, SE, and p. The rows list different variables and their corresponding statistical values. Row 1: Frequency of adherence of cognitive techniques, 0.12, 7.14, 4207, empty, empty, empty. Row 2: IUS, empty, empty, empty, -0.132, 0.067, 0.050. Row 3: EBPAS, empty, empty, empty, 0.166, 0.067, 0.014. Row 4: IUS x EBPAS, empty, empty, empty, 0.146, 0.053, 0.006. Row 5: Number of past year ED patients, empty, empty, empty, 0.182, 0.066, 0.006. Row 6: Frequency of adherence of behavioural techniques, 0.23, 10.35, 6204, empty, empty, empty. Row 7: IUS, empty, empty, empty, -0.122, 0.064, 0.057. Row 8: EBPAS, empty, empty, empty, 0.287, 0.063, 0.000. Row 9: IUS x EBPAS, empty, empty, empty, 0.104, 0.049, 0.035. Row 10: Duration of ED clinical work, empty, empty, empty, 0.125, 0.064, 0.052. Row 11: Number of past year ED patients, empty, empty, empty, 0.225, 0.061, 0.000. Row 12: Postgraduate CBT training, empty, empty, empty, 0.179, 0.124, 0.153.
IUS, Intolerance of Uncertainty Scale; EBPAS, Evidence-Based Practice Attitude Scale.
Moderating effects of attitudes towards evidence-based practice on the association between clinician anxiety and frequency of adherence to cognitive and behavioural CBT-ED techniques.

Figure 1. Long description
The image contains two line graphs. Panel A: The line graph shows the adherence to cognitive techniques on the vertical axis (z-score) and intolerance of uncertainty on the horizontal axis. Three lines represent different attitudes towards evidence-based practice: positive (black line), average (dark gray line), and negative (light gray line). As intolerance of uncertainty increases from low to high, adherence to cognitive techniques slightly increases for positive attitudes, remains relatively stable for average attitudes, and decreases for negative attitudes. Panel B: The line graph shows the adherence to behavioral techniques on the vertical axis (z-score) and intolerance of uncertainty on the horizontal axis. Three lines represent different attitudes towards evidence-based practice: positive (black line), average (dark gray line), and negative (light gray line). As intolerance of uncertainty increases from low to high, adherence to behavioral techniques remains relatively stable for positive attitudes, decreases for average attitudes, and significantly decreases for negative attitudes.
A Johnson-Neyman technique was used to probe the interaction between IUS and EBPAS on frequency of adherence to cognitive and behavioural techniques. Results indicated that the association of IUS on frequency of cognitive and behavioural techniques was significant only when EPBAS was below 3.71 and 3.72, respectively. When EBPAS was above these values, the effect of IUS on frequency of adherence to cognitive and behavioural techniques was not statistically significant.
Discussion
This study examined the associations of clinician intolerance of uncertainty (IU) and attitudes towards evidence-based practice (EBP) with adherence to CBT-ED techniques and examined the extent to which positive attitudes towards EBP may weaken the association between clinician IU and CBT-ED adherence. Results largely supported hypotheses.
First, we hypothesised that clinician intolerance of uncertainty would be negatively associated with adherence to CBT-ED. Bivariate analyses indicate weak negative correlations between IU and adherence. IU remained significant in the multivariable regression model accounting for variance in adherence to cognitive techniques, but not behavioural techniques. This lack of association is somewhat surprising given previous findings. For example, one study found that clinician anxiety, assessed via the Brief Symptom Inventory (BSI)-Anxiety Scale, was only associated with less weighing and no other core techniques of family-based therapy for EDs (Kosmerly et al., Reference Kosmerly, Waller and Lafrance Robinson2015). Another study found clinician anxiety (also assessed via BSI-Anxiety Scale) was correlated with less use of food diaries, structured eating, and behavioural experiments, but no elements of cognitive work (Waller et al., Reference Waller, Stringer and Meyer2012). Thus, it may be that general anxiety (e.g. tension, nervousness, fear) is more strongly associated with use of behavioural techniques in therapy than intolerance of uncertainty. However, another study found that clinician IU, specifically, is associated with less weighing, exposures, and behavioural experiments, but was not associated with techniques like cognitive restructuring (Mulkens et al., Reference Mulkens, de Vos, de Graaff and Waller2018). However, the present study did not directly inquire about adherence to ‘cognitive restructuring’, specifically, which is not a core component of all forms of CBT-ED (e.g. CBT-E; Murphy et al., Reference Murphy, Straebler, Cooper and Fairburn2010), but rather assessed adherence to cognitive processes such as ‘addressing over-evaluation of shape/weight’. Additionally, the present study used multivariable analyses rather than bivariate correlation analyses, which represents an important difference. Thus, IU may not be strongly associated with adherence to behavioural techniques when attitudes towards EPB and other covariates (e.g. experience in ED treatment) are considered.
Second, we hypothesised that more favourable attitudes towards EBP would be positively associated with adherence to CBT-ED. Bivariate analyses indicate attitudes towards EBP had a weak and moderate correlation with adherence to cognitive and behavioural techniques, respectively, and the strength of these associations were maintained in multivariable analyses. These findings are consistent with previous research demonstrating robust relations between negative attitudes towards EBP and reduced adherence to CBT-ED (Lilienfeld et al., Reference Lilienfeld, Ritschel, Lynn, Brown, Cautin and Latzman2013a; Pagoto et al., Reference Pagoto, Spring, Coups, Mulvaney, Coutu and Ozakinci2007; Von Ranson et al., Reference Von Ranson, Wallace and Stevenson2013; Waller et al., Reference Waller, Mountford, Tatham, Turner, Gabriel and Webber2013), and highlight the importance of addressing clinicians’ attitudes towards EBP in any effort to increase use and adherence to any EST, including CBT-ED.
Third, we hypothesised that favourable attitudes towards EBP would buffer or attenuate the negative association of clinician IU with adherence to CBT-ED. Indeed, clinicians who reported highly favourable attitudes towards EBP also reported high CBT-ED adherence, regardless of their personal IU. Specifically, for clinicians who reported average agreement with the 15 EBP statements between a ‘moderate’ and ‘great’ extent (EBPAS scores >3.7; i.e. EBPAS scores in the top quartile), IU was not significantly associated with adherence to CBT-ED techniques. These findings suggest that possessing positive beliefs about EBP may be especially important for clinicians with relatively high IU. It may be more practical for training programs and supervisors to foster a positive attitude towards EBP among clinicians-in-training than to address clinicians’ general comfort with uncertainty. Indeed, the present study found that adherence to behavioural techniques was higher among participants who received training in CBT on internship or postdoctoral fellowship, and research indicates that supervisors’ attitudes towards EBP predict trainee adherence to ESTs (Ryba et al., Reference Ryba, Lo and Andersen2021; Williams et al., Reference Williams, Wolk, Becker-Haimes and Beidas2020). Additionally, research suggests training programs that highlight the flexible, modular nature of evidence-based treatment may be the most effective at fostering positive attitudes towards EBP (Borntrager et al., Reference Borntrager, Chorpita, Higa-McMillan and Weisz2009; Lilienfeld et al., Reference Lilienfeld, Ritschel, Lynn, Cautin and Latzman2013b), which in turn may lead to more clinicians implementing EBP in real-world settings. Indeed, a recent manuscript addresses common misconceptions related to one particular CBT-ED, CBT E, noting that it is a flexible, person-centred treatment targeting transdiagnostic mechanisms underlying EDs (Murphy et al., Reference Murphy, Bailey Straebler, Dalle Grave, Calugi, Osborne and Cooper2025).
Overall, participants reported slightly higher adherence to certain CBT-ED techniques compared with previous research. Waller et al. (Reference Waller, Stringer and Meyer2012) reported no individual CBT-ED skill was utilised with 91–100% of patients by over half of their participants. However, in the current study, over half of the sample endorsed using all six cognitive items with 91–100% of patients. However, the present sample indicated using the five behavioural techniques less frequently. Interestingly, although 92% of the present sample indicated using CBT-ED in the past 12 months, no behavioural skills were utilised with 91–100% of patients by over half of the sample. Routine weighing, establishing a regular pattern of eating, incorporating between-session assignments/homework, and self-monitoring represent a crucial portion of the treatment that is necessary for symptom reduction (Waller and Raykos, Reference Waller and Raykos2019) and are predictive of CBT treatment outcomes (Mausbach et al., Reference Mausbach, Moore, Roesch, Cardenas and Patterson2010; Waller and Mountford, Reference Waller and Mountford2015; Zendegui et al., Reference Zendegui, West and Zandberg2014).
A surprising majority of the sample reported almost never weighing patients, with only 6% indicating they weighed 91–100% of their clients. By contrast, the percentage of clinicians indicating that they weigh nearly all clients (91–100%) ranges from 29% to 57% in similar studies (Kosmerly et al., Reference Kosmerly, Waller and Lafrance Robinson2015; Mulkens et al., Reference Mulkens, de Vos, de Graaff and Waller2018; Waller et al., Reference Waller, Stringer and Meyer2012). It is possible that the lower endorsement of routine weighing may be due to the survey being administered post-COVID-19 (September 2021 to January 2022), when many clinicians were providing treatment via telehealth. Although guidelines on how to maintain regular weighing when delivering CBT-ED via telehealth were published shortly after the start of the pandemic (Waller et al., Reference Waller, Pugh, Mulkens, Moore, Mountford, Carter, Wicksteed, Maharaj, Wade, Wisniewski, Farrell, Raykos, Jorgensen, Evans, Thomas, Osenk, Paddock, Bohrer, Anderson, Turner and Smit2020), this process does present challenges (Gorrell et al., Reference Gorrell, Reilly, Brosof and Le Grange2022), which may have led to lower utilisation in the present study. Given that routine weighing is considered crucial for CBT-ED treatment for all eating disorders and is predictive of treatment outcomes (Waller and Mountford, Reference Waller and Mountford2015), further research into barriers to routine weighing is warranted. Taken together, the present study suggests that behavioural techniques, especially weighing, may be particularly important for training programs to target, even among clinicians in favour of EBP.
Limitations
There are several limitations that should be noted. First, this study only assessed adherence to CBT-ED-specific techniques and did not assess adherence to techniques specific to other evidence-based approaches (e.g. family-based therapy for EDs) or reasons for not using each technique (e.g. client refusal or other individualised reason). Relatedly, the present study did not assess the percentage of clients with whom clinicians used CBT-ED. Thus, lower adherence to some of the techniques assessed may not represent ‘non-adherence’ but rather use of a different set of therapeutic techniques. However, several of the techniques assessed in the present study have cross-cutting applicability to other evidence-based therapies. For example, routine weighing is also a component of family-based therapy for anorexia nervosa and bulimia nervosa (Le Grange and Lock, Reference Le Grange and Lock2007; Lock et al., Reference Lock, Le Grange, Agras and Dare2001). Nevertheless, the lack of information about the percentage of patients with whom participating clinicians used CBT is an important limitation. Additionally, the sample consisted of majority White females. With continued inequalities in ED diagnosis and treatment in racial/ethnic minorities, males, and gender minorities (Rodgers et al., Reference Rodgers, Berry and Franko2018; Sonneville and Lipson, Reference Sonneville and Lipson2018), the lack of diverse clinicians in this study is concerning. Study recruitment was limited to providers practising in the United States and may not generalise to an international clinician population. Furthermore, participants in the sample reported more favourable attitudes towards EBPs than previously studies and lower intolerance of uncertainty than non-clinical samples (although similar levels compared with ED clinicians). Thus, generalisations of the results to the overall population of clinicians who treat EDs should be done with caution. The current study used self-report measures, on which participants may provide more socially acceptable responses or lack insight into their practices. Future research should strive to obtain data regarding adherence to ESTs from multiple sources (e.g. supervisors). The study used a cross-sectional design; thus, the findings of this study do not indicate causal relations. Finally, although the study used rigorous methodology, the analytic plan was not publicly pre-registered, which limits results from being interpretated as confirmatory.
Conclusion
The current study adds to existing research suggesting positive attitudes towards EBP may buffer the negative impact of clinician intolerance of uncertainty on adherence to CBT-ED. Future studies could examine methods to foster positive attitudes towards EBPs in clinicians, particularly those with high intolerance of uncertainty. Additionally, the relatively low adherence to several core CBT-ED components (e.g. weighing) suggests that clinicians-in-training may be particularly in need of improved attitudes towards behavioural aspects of ED treatment.
Key practice points
-
(1) Clinicians may use core behavioural techniques less often than cognitive techniques in the treatment of eating disorders.
-
(2) Clinicians’ own intolerance of uncertainty may inhibit use of evidence-based therapeutic techniques when working with clients with eating disorders.
-
(3) Clinical training that fosters positive attitudes towards evidence-based practice, particularly among clinicians with high intolerance of uncertainty, may improve CBT-ED adherence.
Supplementary material
To view supplementary material for this article, please visit https://doi.org/10.1017/S1754470X26100865
Data availability statement
The data that support the findings of this study are available from the corresponding author, C.R., upon request.
Acknowledgements
None.
Author contributions
Chelsea Ratcliff: Conceptualization (supporting), Data curation (supporting), Formal analysis (supporting), Investigation (supporting), Methodology (supporting), Resources (lead), Software (supporting), Supervision (lead), Visualization (supporting), Writing - original draft (supporting), Writing - review & editing (lead); Emalee Kiser: Conceptualization (lead), Data curation (lead), Formal analysis (lead), Investigation (lead), Methodology (lead), Project administration (lead), Visualization (lead), Writing - original draft (lead).
Financial support
This research received no specific grant from any funding agency, commercial or not-for-profit sectors.
Competing interests
The authors declare none.
Ethical standards
This project was approved by the Sam Houston State University Institutional Review Board (SHSU IRB-2021-156), and all study procedures conformed to the Declaration of Helsinki. Informed consent from all participants was obtained.



 Open access


Comments
No Comments have been published for this article.