Introduction
Memory dysfunction has been traditionally considered the predominant and earliest symptom of Alzheimer's disease (AD), usually followed by impairments of other cognitive domains such as language and visuospatial skills, resulting in a combination of cognitive deficits (Dubois et al., Reference Dubois2010). Indeed historically this temporal sequence formed the basis of the 1984 National Institute of Neurological and Communicative Diseases and Stroke and Alzheimer's Disease and Related Disorders Association (NINCDS-ARDA) diagnostic criteria for AD (Mckhann et al., Reference McKhann, Drachman, Folstein, Katzman, Price and Stadlan1984). Strength for this view was provided by the establishment of hippocampal atrophy on MRI (Barber et al., Reference Barber, Gholkar, Scheltens, Ballard, McKeith and O’Brien1999; Killiany et al., Reference Killiany2000), and temporoparietal hypometabolism and hypoperfusion on functional brain imaging as biomarkers for AD (O’Brien et al., Reference O’Brien, Eagger, Syed, Sahakian and Levy1992; Talbot et al., Reference Talbot, Snowden, Lloyd, Neary and Testa1995) and, at the pathological level, early changes within the medial temporal lobes (Braak and Braak, Reference Braak and Braak1995).
However, it has long been recognized that memory is not always the primary cognitive deficit in AD and this has now been formalized in the publication of the revised criteria for AD diagnosis by the International Working Group and the National Institute on Aging and the Alzheimer's Association (Dubois et al., Reference Dubois2010; McKhann et al., Reference McKhann2011). Some patients with AD present with perceptual or spatial impairments (Cogan, Reference Cogan1985), language (Galton et al., Reference Galton, Patterson, Xuereb and Hodges2000), praxis (Green et al., Reference Green, Goldstein, Mirra, Alazraki, Baxt and Bakay1995), or frontal lobe symptoms (Johnson et al., Reference Johnson, Head, Kim, Starr and Cotman1999). Dubois et al. Reference Dubois(2010) refer to these non-amnestic presentations of AD as “atypical” AD due to relative rarity, with the anticipation that they will become better-recognized and more frequent with advances in methods of diagnosis. However, in the clinical setting patients rarely have deficits purely within a single cognitive domain, either amnestic or non-amnestic, but the description of these “focal” presentations emphasizes the fact that there are cases where one cognitive deficit may predominate (Snowden et al., Reference Snowden2007).
These clinical distinctions have been validated using a factor analytic approach in a group of younger patients diagnosed with AD (mean age 64 years, Standard Deviation (SD) = 6; Stopford et al., Reference Stopford, Snowden, Thompson and Neary2008). In Stopford et al. Reference Stopford, Snowden, Thompson and Neary(2008), all participants were recruited from a regional dementia diagnostic clinic. Mean Mini-Mental State Examination (MMSE) score was 20 (SD = 5) and average illness duration was 2.4 years (SD = 1.5). None had any significant cerebrovascular disease (based on the Hachinski Ischaemia Scale) or history of head injury. It was elicited in that study that some patients with a diagnosis of AD have a relatively uniform pattern of deficits across cognitive domains (termed multi-domain or typical) and others have a “focal presentation” with most significant impairment in one cognitive domain. The same group published a study in a series of 523 patients with AD (mean age 60 years) showing that two-thirds of the participants exhibited a constellation of memory and other cognitive deficits at presentation (termed “typical” AD in this paper) and a quarter had a more circumscribed presentation, i.e. amnesia, aphasia, perceptuospatial disorder, or apraxia (Snowden et al., Reference Snowden2007). The “focal” amnestic presentation in this series tended to be older, exhibit a preponderance of family history, and have at least one copy of the APOEe4 allele. However, as mentioned, this was a series describing a young population of patients.
Limited studies to date suggest that amnestic presentations may be more common in older people or “late-onset AD” (Koedam et al., Reference Koedam, Lauffer, van der Vlies, van der Flier, Scheltens and Pijnenburg2010). This is in keeping with the perception of many that older people with AD are clinically homogeneous and “amnestic.” Defining clinical heterogeneity in AD in older people is potentially important for diagnosis, prognosis, targeting currently available treatments, and identification of future novel therapies. It is also important to define patients not only on the basis of being amnestic versus non-amnestic but to identify heterogeneity within this non-amnestic group.
We studied an older group of AD patients to explore and identify clinical heterogeneity. The aim was not to use pre-defined clinical categorizations within the AD group, but to identify categories using a statistical approach. Our hypothesis was that there would be at least two “cognitive phenotypes” in older people, consistent with the multi-domain and amnestic groups described in younger people.
Methods
Participants
Included in this study were 109 people with a diagnosis of probable AD and 91 age- and gender-matched control participants. Participants with a diagnosis of probable AD were recruited from Old Age Psychiatry, Geriatric Medicine, and Neurology Services in the North East of England as part of three research studies. These studies are entitled to the Medical Research Council (MRC) Lewy body study (O’Brien et al., Reference O’Brien2004), the Jules Thorne study (Watson et al., Reference Watson, O’Brien, Barber and Blamire2011), and the Suspected-AD study (unpublished data). Diagnosis of AD was made according to the NINCDS-ADRDA criteria (McKhann et al., Reference McKhann, Drachman, Folstein, Katzman, Price and Stadlan1984) by consensus agreement of three experienced clinicians. Where two independent raters agreed on diagnosis following review of the clinical record, this was designated a patient, with the third independent rater to make final decision in case of any disagreement. The same three individual studies also enrolled healthy age-matched controls recruited from friends and relatives of participants of these or other studies, and also via advertisements in local community newsletters. Detailed examination of control participants was undertaken to exclude those with dementia based on history and the Cambridge Cognitive Examination of the Elderly (CAMCOG) score. Details of two of the three studies have been published to date, but all used the same recruitment and diagnostic process (O’Brien et al., Reference O’Brien2004; Watson et al., Reference Watson, O’Brien, Barber and Blamire2011). All participants were over 60 years of age and were required to have sufficient English language skills to complete the neuropsychiatric assessments. Exclusion criteria related to imaging modality used in the individual studies, and for the same reasons there were some exclusions in terms of receipt of particular medications. All studies had local ethical approval and all participants provided written informed consent or, where appropriate, agreement from the nearest relative was provided.
Assessments
A clinician (old age psychiatrist or geriatrician) evaluated all the notes of participants recruited to the research studies. Demographic and clinical data were collected, including age at recruitment, gender, illness duration, level of education (>ten years of formal education), use of cholinesterase inhibitors, history of dementia in the first-degree relatives (at least one), alcohol use, smoking history, and medical comorbidities. Non-cognitive symptoms were assessed with the Neuropsychiatric Inventory (NPI; Cummings et al., Reference Cummings, Mega, Gray, Rosenberg-Thompson, Carusi and Gornbein1994). Depressive symptoms were assessed with either the Cornell Scale for Depression in Dementia (Alexopoulos et al., Reference Alexopoulos, Abrams, Young and Shamoian1988) or the Geriatric Depression Scale (GDS-15; Yesavage et al., Reference Yesavage1982). Participants were judged to have clinically significant depressive symptoms if they scored six or more on either of these scales (Herrmann et al., Reference Herrmann1996; Korner et al., Reference Korner2006).
Cognition was assessed with the CAMCOG (Williams et al., Reference Williams, Huppert, Matthews and Nickson2003). The CAMCOG yields a total score of 105 with sub-scores for orientation, language comprehension, language expression, remote memory, recall memory, new learning, attention, praxis (including items such as copying drawings, drawing a clock face, and completing mimes of everyday activities), calculation, perception (recognition of famous faces and photographs of objects taken from unusual angles), executive function (includes category and ideational fluency, similarities, and visual reasoning), and abstraction.
Statistical analysis
Data were analyzed with the Statistical Package for Social Sciences (SPSS, version 17). Descriptive statistics were used to investigate the distribution of data, reporting normally distributed continuous variables as means and SD, and data without a normal distribution as medians and inter-quartile ranges (IQR). Categorical variables were reported as frequencies and percentages. Normality of distribution was determined by visual inspection and the Kolmogorov–Smirnov test.
For the comparison of AD versus control data, Student's t-test was used to compare normally distributed continuous variables, and the Mann–Whitney test (z statistic) was used for non-parametric data. χ 2 tests were used to compare between-group distribution of proportions, and p < 0.05 was taken as statistically significant.
First we sought to compare the CAMCOG performance data between AD participants and controls. Second, we sought to examine the cognitive performance of AD participants in more depth to identify subgroups based on cognitive profile and characterize clinical and demographic differences between these groups. Standardized (z-scores) CAMCOG scores (sub-scores and total) were calculated for each AD participants using the following formula: z = (x – μ)/σ, where x is the mean score of the participant, μ is the mean of the control group, and σ is the SD of the control mean. The standardized CAMCOG sub-scores (AD participants only) were then entered into a hierarchical cluster analysis using Ward's method applying a squared Euclidean distance as the similarity measure (Ward, Reference Ward1963). The change in agglomeration coefficients and dendrograms were used to define the optimal number of clusters that best summarized the data.
Finally, to simplify and better summarize the differences in cognitive performance between clusters (in addition to analysis of individual CAMCOG subscales), factor analysis was employed to derive cognitive composite scores from the multiple separate measures of the CAMCOG. This allows for elucidation of the broader cognitive domains underlying the differentiated clusters. Standardized CAMCOG scores were entered into a factor analysis with a varimax rotation. An eigenvalue of 1 was used to determine distinction of the factors. Individual factor-derived scores were created for each participant using a regression method. Composite z-scores were then created for each factor by averaging the individual z-scores that made up that factor. The distribution of data was investigated according to the clusters using analysis of variance (ANOVA) or covariance (ANCOVA) tests to compare continuous data with a normal distribution and the Kruskal–Wallis test for data without a normal distribution, or χ 2 tests for categorical variables. Post hoc comparisons were also performed to explore differences between the individual clusters.
Results
Participants with AD compared to control participants
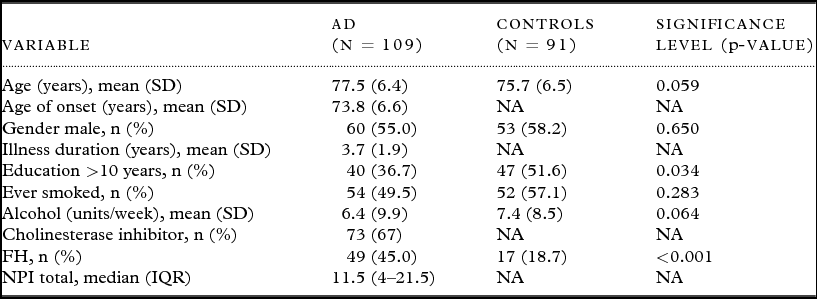
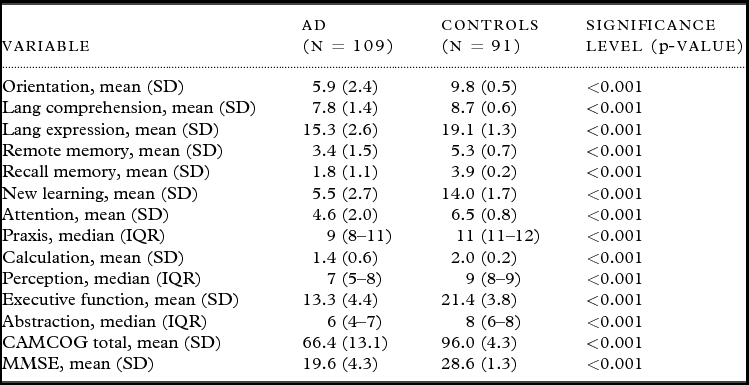
Table 1 summarizes the characteristics of the study population. There were no significant differences between the AD and control groups in terms of age, gender, history of smoking, or alcohol intake. The control group had significantly greater proportion with over ten years of education (51.6% versus 36.7%, p = 0.034). The AD group had a significantly greater proportion with a family history of dementia (45% versus 18.7%, p < 0.001). The CAMCOG data, comparing scores for the AD group with the control group, is shown in Table 2. As expected, controls demonstrated significantly superior performance on all aspects of the CAMCOG.
Characteristics of the study population

Notes. AD: Alzheimer's disease, SD: standard deviation, FH: family history of dementia, NPI: neuropsychiatric inventory, CAMCOG: Cambridge cognitive examination of the elderly, MMSE: Mini-Mental State Examination, IQR: inter-quartile range.
Cognitive performance of the study population
Notes. AD: Alzheimer's disease, SD: standard deviation, IQR: inter-quartile range, CAMCOG: Cambridge cognitive examination of the elderly, MMSE: Mini-Mental State Examination.
Cluster analysis
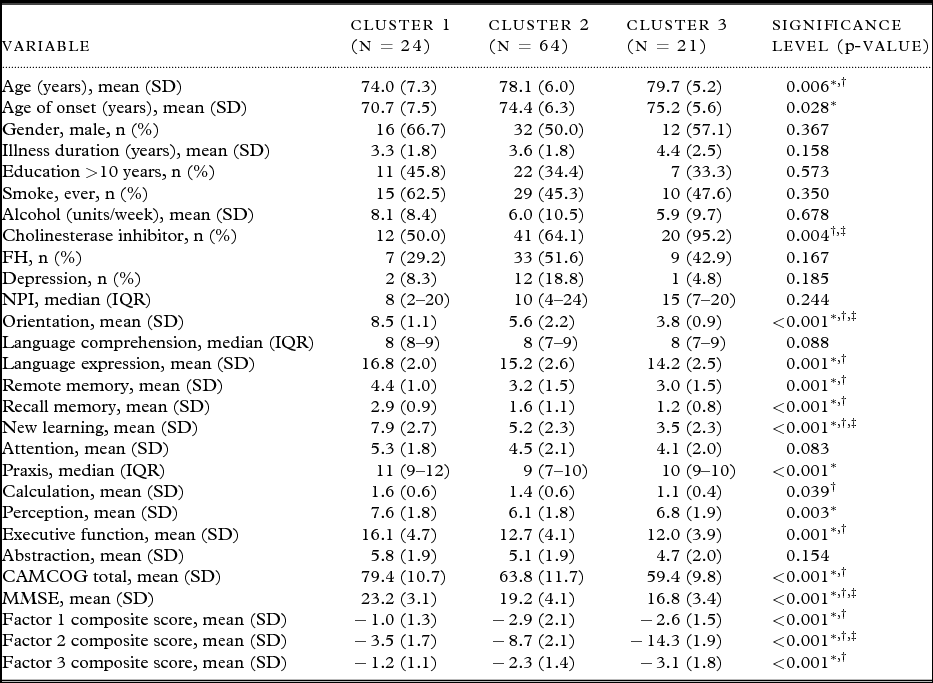
Participants with AD individual standardized CAMCOG sub-scores were entered into a hierarchical cluster analysis. The agglomerative coefficients and dendrogram showed that three distinct clusters best described the data. Table 3 summarizes the distribution of data and cognitive performance according to individual clusters.
Demographics and standardized cognitive scores of AD participants according to clusters
Notes: AD: Alzheimer's disease, SD: standard deviation, FH: family history of dementia, NPI: neuropsychiatric inventory, IQR: inter-quartile range, CAMCOG: Cambridge cognitive examination of the elderly, MMSE: Mini-Mental State Examination.
* Cluster 1 versus 2, p < 0.05.
† Cluster 1 versus 3, p < 0.05.
‡ Cluster 2 versus 3, p < 0.05.
There were no significant differences between the clusters in terms of the duration of AD. Cluster 1 was significantly younger and had an earlier age of onset of AD than the other clusters. Cluster 1 also had significantly less severe cognitive impairment and had the lowest prevalence of family history, although this was not statistically significant (pair-wise comparison: cluster 1 versus cluster 2, χ 2 = 3.53, df = 1, p = 0.060; cluster 1 versus cluster 3, χ 2 = 0.92, df = 1, p = 0.338). Cluster 3 was more likely to be prescribed a cholinesterase inhibitor and demonstrated poorer performance on tasks predominantly involving memory (orientation, new learning, memory recall). Participants in this cluster also had the poorest overall cognitive performance and were the oldest of the clusters with a (non-significant) higher prevalence of family history of dementia in a first-degree relative. Cluster 2 also demonstrated poor performance on tasks involving memory, although less so than cluster 3. Cluster 2 had a high prevalence of family history of dementia in a first degree relative and had the highest prevalence of depression of any of the clusters.
Factor analysis
Following factor analysis, the standardized CAMCOG scores loaded onto three factors, which collectively accounted for 60.7% of variability in cognitive scores. These factors represented the domains of attention, praxis, calculation, and perception (Factor 1; 37.5% of total variance); memory (Factor 2; 13.1% of total variance); and language comprehension and executive function (Factor 3; 10.1% of total variance).
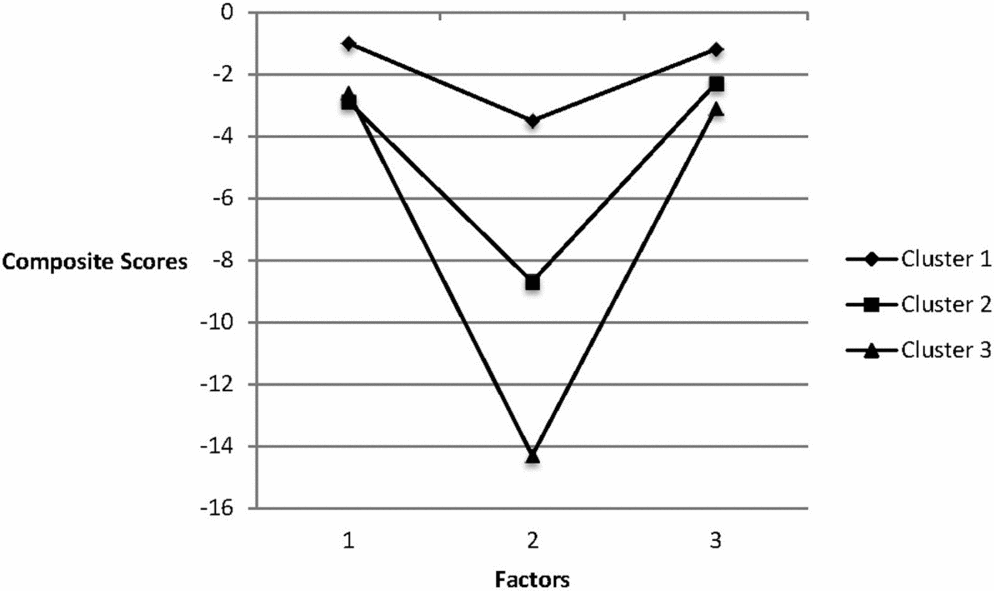
These factor components were compared across the three subgroups of AD participants, which were derived from the cluster analysis. Figure 1 shows the composite factor scores for each cluster. Cluster 1 had milder impairments as shown in Table 2. Cluster 3 were markedly amnestic as was cluster 2 but to a much lesser extent.
Graph depicting the composite factor scores for each cluster. Factors represented the domains of attention, praxis, calculation, and perception (Factor 1; 37.5% of total variance); memory (Factor 2; 13.1%); and language comprehension and executive function (Factor 3).
Given that memory impairment generally increases as illness progresses, we repeated the analysis while adjusting for age of onset and illness duration. The composite score for the memory factor (Factor 2) remained significantly different between the three clusters after adjusting for illness duration (F = 108.4, df = 2,75, p < 0.001) and age of onset (F = 126.2, df = 2,79, p < 0.001). Similarly, the inclusion of age and cholinesterase inhibitor use did not substantially alter the analyses: Factor 1 (F = 4.08, df = 2,76, p = 0.021), Factor 2 (F = 112.1, df = 2,76 p < 0.001) and Factor 3 (F = 12.37, df = 2,76, p < 0.001).
Discussion
In this study we characterized the cognitive profiles of a group of 109 people with AD. Using statistical techniques we have identified three groups based on different cognitive characteristics. Cluster 1 described a group with multiple yet relatively mild cognitive deficits with the highest MMSE score, and the least prevalence of family history. Both clusters 2 and 3 have high prevalence of family history, 51.6% and 42.9% respectively, and have predominant memory deficits. Cluster 3 in particular is profoundly amnestic. Cluster 2 have a higher prevalence of depression than the other clusters. The differences cannot be accounted for on the basis of disease duration or age of onset, as they did not differ significantly in this regard, and statistical significance remained after adjustment for both these factors. Based on these observations, we feel it unlikely the differences between the clusters relate to disease severity.
We have considered the possibility that the clusters identified could relate to issues of diagnostic accuracy in terms of diagnosis of dementia type. However, we feel this unlikely as in this study a method of diagnosis involving consensus of three experienced clinicians was employed in the diagnostic process. Second, this method has been shown in a previous neuropathological study performed by the same research group to have a sensitivity of 0.87 and specificity of 0.83 for a clinical diagnosis of probable or possible AD compared with neuropathological diagnosis (McKeith et al., Reference McKeith2000).
Although the CAMCOG is well validated and widely used and does incorporate tests in most areas of cognition, we accept that it is a relatively simple method of cognitive assessment compared with detailed psychometric testing and so our method may have missed some of the more subtle differences in cognitive domains between participants. This may explain the lack of variety of “focal” presentations in AD and why some of the factors contain more than one deficit. We also recognize that as patients recruited to the research studies were diagnosed using NINCDS-ADRDA, this may have favored those with impairments in the realms of memory, hence introducing a source of bias.
However, these data do suggest heterogeneity in terms of clinical presentation in older people with AD, and in particular that there are distinctions between a multi-domain group (cluster 1) and the amnestic group. The amnestic group can further be subdivided on the basis of degree of amnesia (intermediate – cluster 2 or severe – cluster 3) and also depressive symptoms (clusters 2 and 3), although we accept that the difference between clusters in terms of depressive symptoms did not reach statistical significance.
It is interesting that those with intermediate or severe amnestic features had the highest prevalence of family history. This is in keeping with previously published literature showing those with a focal amnestic presentation of AD to have the highest prevalence of recollected family history and also the highest prevalence of the ApoEe4 allele (Snowden et al., Reference Snowden2007). There have also been several reports of an association between the ApoEe4 allele and greater degree of amnesia (for example, van der Flier et al., Reference van der Flier, Schoonenboom, Pijnenburg, Fox and Scheltens2006) and also more recent reports of other genetic associations with the amnestic presentation of AD (Vardy et al., Reference Vardy2012).
The link between the ApoEe4 allele and the amnestic presentation of AD is one example of why cognitive characterization is important. Currently little is known regarding mechanisms underlying clinical heterogeneity in AD. This is important in terms of expanding our knowledge of those that may gain greatest benefit from currently available treatments and also the development and targeting of new pharmacological agents in the future. A further hint regarding mechanism from our data is the suggestion of a higher prevalence of depression in one of the clusters, although we accept that differences between the clusters did not reach statistical significance in this regard. It is possible that there may be an underlying vascular etiology in this cluster, suggested by the literature linking cerebrovascular disease to depression (Coffey et al., Reference Coffey1993; O’Brien et al., Reference O’Brien, Perry, Barber, Gholkar and Thomas2000), although currently from MRI data this link does not extend to AD with depression (Klugman et al., Reference Klugman, Marshall and Tabet2009). Again better characterization of people with AD may better inform design of future research studies.
There is some evidence for heterogeneity in AD at a pathological level. One recent study (Murray et al., Reference Murray, Graff-Radford, Ross, Petersen, Duara and Dickson2011) described an algorithm to categorize AD cases on the basis of pathology as “hippocampal sparing,” “limbic predominant,” and “typical.” The limbic predominant group had the oldest age of death. There was no difference in the Braak staging between the groups, although TDP-43, cerebrovascular, and Lewy body pathological features were less frequent in the hippocampal sparing group. The ApoEe4 allele carrier status was the highest in the limbic predominant group (Murray et al., Reference Murray, Graff-Radford, Ross, Petersen, Duara and Dickson2011). Unfortunately, there was no detailed cognitive profile data on the cases included in this study. However, Davidson et al (2011) have shown TDP-43 pathology to be most strongly associated with the amnestic phenotype of AD in later onset cases, i.e. over 65 years of age.
In summary, these data suggest heterogeneity in older people with AD, and enhance the current literature regarding heterogeneity in younger people with AD. Future work should focus on better defining cognitive phenotypes with confirmation at post-mortem in older people and elaborating on the mechanisms, including genetic factors, underlying such heterogeneity.
Conflict of interest
None.
Description of authors’ roles
Dr E. Vardy designed the study, contributed to data analysis, and wrote the paper. Dr A. Ford collected the data, did the statistical analysis, and contributed to writing the paper. Dr P. Gallagher contributed to study design and statistical analysis. Dr R. Watson collected the original study data. Professor I. McKeith contributed to the design of the original studies, which contributed data to this piece of work. Professor A. Blamire contributed to the design of the original studies, which contributed data to this piece of work. Professor J. O’Brien contributed to the design of the original studies, which contributed data to this piece of work and was involved in the design of this study. All authors contributed to and have approved the final paper.
Acknowledgments
The study was funded by the Sir Jules Thorn Charitable Trust Medical Research Council of Great Britain and the National Institute for Health Research (NIHR). The research was supported by the NIHR Newcastle Biomedical Research Centre in Ageing and Chronic Disease and Biomedical Research Unit in Lewy Body Dementia based at Newcastle upon Tyne Hospitals NHS Foundation Trust and Newcastle University, and the NIHR Biomedical Research Unit in Dementia awarded to Cambridge University Hospitals NHS Trust and the University of Cambridge. The views expressed are those of the author(s) and not necessarily those of the NHS, the NIHR, or the Department of Health.
We thank Josh Wood, Assistant Psychologist and members of the North East-DeNDRoN, Karen Morgan and Barbara Wilson for their assistance with the recruitment and assessment of study participants. We are also grateful to all of the study volunteers for their involvement.