


Increased consumption of fruit and vegetables (F&V) is at the heart of healthy eating campaigns around the world. The WHO’s Global Strategy on Diet, Physical Activity and Health, endorsed by member countries in 2004, includes a global quantitative norm that per capita F&V consumption should exceed 400 g/d. In the UK, this aggregate norm of 400 g/d has been broken down into ‘5-a-day’ portions of at least 80 g each by the Department of Health. The government has invested substantially in promoting the 5-a-day programme, elements of which include the National School Fruit Scheme and a communication strategy incorporating the 5-a-day logo.
In keeping with this interest in F&V consumption, a large volume of research has been produced analysing the determinants of F&V intakes by individuals or households. These range from studies involving analysis of large samples drawn from representative populations, to purposively collected information on population subgroups of interest. Research, depending on the available data, has alternatively attempted to relate F&V intakes to sociodemographic, socio-economic, psychological or sensory variables. Often, studies have restricted themselves to statistical comparisons of F&V consumption across demographic or socio-economic groups, in an attempt to identify sub-populations for policy targeting. Sometimes, regression-based approaches have been undertaken to identify sources of independent variation in F&V consumption and to quantify the magnitude of the effect exerted by a particular causal variable. Seeking sources of independent variation is important for a more nuanced understanding of the drivers of intake. For instance, a comparison of intake differences across groups in some research(Reference Doyle and Hosfield1, Reference Leather2) shows that F&V intake is lower in Scotland and the North of England compared with the rest of the UK. A regression-based examination can reveal whether this effect remains after controlling for differences in incomes, family sizes, etc. across these regions.
In the present research, we examine such independent sources of variation in F&V consumption in England using sociodemographic data from the 2003 Health Survey of England (HSE). In doing so, we employ a powerful technique in the form of quantile regression. This enables us to explore important but hitherto understudied questions relating to whether and how variables such as income, ethnicity and regional location differentially influence various parts of the conditional distribution of F&V intake, i.e. how the effect on those with severely inadequate intake differs from those with average intakes and those with high intakes.
Regression approaches to determinants of fruit and vegetable intake
Previous regression-based approaches in the literature have mostly employed either multiple linear(Reference Pollard, Greenwood, Kirk and Cade3, Reference Subar, Heimendinger, Patterson, Krebs-Smith, Pivonk and Kessler4) or logistic regressions(Reference Doyle and Hosfield1, Reference Wardle, Parmenter and Waller5, Reference Pollard, Greenwood, Kirk and Cade6). Multiple linear regressions express the conditional mean of F&V intake as a function of independent variables. However, they treat various parts of the conditional distribution of F&V consumption identically and constrain the marginal effects of independent variables to be the same throughout the distribution of F&V consumption, which is a significant shortcoming in nutritional intake problem-setting. From a public health and nutrition policy perspective, particular parts of nutrient intake distributions are likely to be of more interest than others. In the F&V case, the behaviour of those in the lower tail of the conditional intake distribution, e.g. those in the bottom 10 %, is likely to be of more interest than those in the higher reaches of the distribution. It is natural to be more concerned about the ‘worst performers’ in any performance-related grouping. Most importantly, the effect of an independent variable may reasonably be hypothesised to vary across the distribution of the dependent variable. For instance, given a specification of other conditioning variables, it is likely that the effect of increased education on F&V intake for those currently in the bottom 10 % of the intake distribution will be different from those in the middle, or in the top 10 %.
Limited dependent variable approaches, such as logistic regressions, express probabilities of exceeding cut-off points as a function of covariates. By doing so, they offer a potential way to train focus on particular segments of the intake distribution. For example, the cut-off may be 5-a-day and a logistic regression would model the influence of a socio-economic variable on the probability of exceeding this cut-off (previous studies have typically opted for such a simple binary classification). Or, one may divide the sample up into ‘low’ (e.g. less than 2-a-day), ‘medium’ (between 2- and 4-a-day) and ‘high’ (more than 4-a-day), and ordered logistic regression would estimate the effect of a socio-economic variable on the probability of belonging to each of these groups. Note, however, that this common practice of reducing continuous information on intakes into information on a small number of categories involves a statistical loss of information. For instance, logistic regression involving a category such as ‘less than 5-a-day’ would treat a data point with intake of 4·9 identically to a data point with intake of 0. As Marmot(Reference Marmot7) notes in the context of disease modelling: ‘Clinicians tend to view disease in terms of binary opposition… the right question [is] not whether a person has the disorder or not, but how much of it does he have. More often than not, both the exposures (causes) and the outcomes (effects) are distributed continuously’. Note also that, although logistic regression can help obtain focus on particular segments of the intake distribution, the effect of a socio-economic variable on intake remains constant regardless of what the existing level of intake is.
Quantile regression(Reference Koenker and Bassett8) (QR) in this context would allow the impact of the explanatory variable to vary along the whole range of F&V intake (‘quantile’ is general terminology for what may be referred to as percentile, decile, quartile, etc. in specific cases). QR methods have gained popularity among economists and ecologists over the last decade. They hold particular promise in applications to nutrition problems where dietary excess and/or inadequacy questions beg particular attention to the tails of distributions, although there seem to be only a small number of applications so far(Reference Variyam, Blaylock and Smallwood9, Reference Gustavsen and Rickertsen10). Accessible introductions to QR methods are available in Koenker and Hallock(Reference Koenker and Hallock11) and Cade and Noon(Reference Cade and Noon12). Some additional statistical explanation is presented in the Appendix.
Methods
Data and variables
The present study uses data from the HSE undertaken in 2003(13). The HSE 2003 is the thirteenth annual survey of its kind conducted by the Department of Health, UK, with the objective of monitoring the nation’s health. Each survey in the series consists of a series of modules wherein some questions are common each year, while others are repeated at regular intervals. The HSE 2003 survey included questions about F&V consumption for informants aged 5 years and over. The survey was designed to provide a representative sample of the population of all ages in private households in England. Interviews were obtained with 14 836 adults (aged 16 years and over) and 3717 children (aged under 16 years), resident in 8867 households. The estimated response rate was 66 %.
Surveys were done in-person, involving personal interviews, physical measurements and nurse visits. A multistage stratified sampling design was adopted for the selection of households, using postcode address files as the sampling frame, and stratifying on the basis of local authority and the percentage of households with non-manual v. manual household head occupations within the postcode. In most cases, data were collected on all members of a household, although in households with three or more children, two children were randomly selected for interview in order to reduce household interview burden. F&V intake information was collected based on recall over the 24 h ending the previous midnight of the interview. Details of the data collection methodology are available elsewhere(Reference Blake, Devrill, Prescott, Primatesta and Stamatakis14).
For the present study, after deleting observations with missing values, data on 11 044 adults were retained for analysis. F&V consumption in (80 g) portions per day was designated the dependent variable, while the independent variable set comprised a variety of sociodemographic variables that have been associated with F&V intake in previous literature. The 80 g portions per day is used here instead of direct expression in grams because the ‘5-a-day’ programme has resulted in number of portions per day coming into widespread use. In some cases, the original data were transformed to create new variables for ease of interpretation and comparison with previous studies. Table 1 shows explanations and summary statistics of the continuous variables used in the analysis.
Summary statistics for continuous variables in the sample: data from 11 044 adult individuals in the 2003 Health Survey of England (HSE)

*‘Equivalised income’ is the HSE 2003 income measure used here. Ordinary household income data are reported in the data set only as a categorical variable with broad bands. HSE 2003 calculates a McClement score for each household (a measure that depends on number, age and relationships of adults and children in the household) and divides the raw income data by the McClement score to arrive at equivalised income. More details are available elsewhereReference Blake, Devrill, Prescott, Primatesta and Stamatakis(14).
Several independent variables are of a categorical nature, and for convenience in presentation, some of the category sets were redefined and reduced to a smaller number of categories. The defined categories and category-wise break up of the sample was as follows. Gender: female, 46 %; male, 54 %. Co-habitation: co-habiting (living with a partner/spouse), 56 %; single, 44 %. Highest educational attainment: no qualifications, 23 %; up to GCSE, 32 %; GCSE to A-levels (more than GCSE, up to and including A-levels), 29 %; A-levels to degree or above (more than A-levels, including degree or more), 16 %. Social class:Footnote * routine and manual, 40 %; intermediate, 19 %; managerial or professional, 41 %. Race: white, 94 %; black, 2 %; Asian, 3 %; other/mixed, 1 %. Region: Yorkshire & Humber, 9 %; North, 21 %; West Midlands, 11 %; East, 49 %; South West, 10 %. Location: suburban, 58 %; urban, 17 %; rural, 25 %. Season during which F&V consumption recorded: autumn, 27 %; spring, 25 %; summer, 26 %; winter, 22 %. Self-reported health status: good, 76 %; fair or bad, 24 %. For these categorical independent variables, a number of dummy variables were defined for use in regression analysis. In each of the variables in the category list above, the first category was used as the ‘base’ in defining dummies to measure changes against. For instance, ‘Female’ was the base for gender and coded as 0, and so the gender dummy variable is called ‘Male’ with men coded as 1.
Regression analyses
A multiple linear regression was first estimated using Ordinary Least Squares (OLS) to provide a basis for comparison with the quantile regression. The functional form for all regressions was initially specified as quadratic in all continuous independent variables (i.e. income, household size, total children, BMI and age). This would allow the effect of e.g. household size on F&V intake to grow or dampen as household size rises. The quadratic terms for both the total children as well as the BMI variables were consistently found to be insignificantly different from zero in all regressions, and were subsequently dropped. The continuous variables were centred at their medians to assist interpretation.
In the QR, seventy-three different conditional quantile functions were estimated for F&V intake, starting with the 0·05 (5 %) quantile and proceeding in 0·0125 increments until the 0·95 (95 %) quantile (i.e. 0·05, 0·0625, 0·75, 0·875, 0·1, …, 0·95). The starting and finishing points were set at 0·05 and 0·95 because extreme quantiles are known to encounter problems with stable confidence interval estimation. A Markov chain marginal bootstrap(Reference He and Hu15) was implemented to compute confidence intervals for every quantile estimate. All programming was implemented in the SAS© statistical software package version 9·1 (SAS Institute, Inc., Cary, NC, USA).
Results
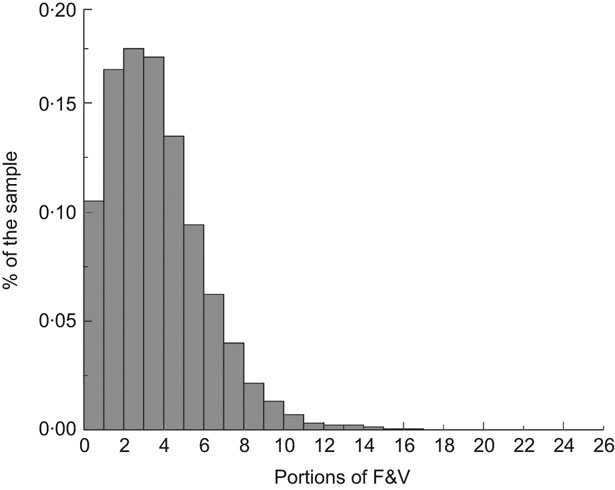
As shown in Table 1, the mean F&V intake in the sample is 3·5 portions/d, well short of the 5-a-day mark. The standard deviation of 2·5 indicates large variance in intakes, which is confirmed by the histogram in Fig. 1. More than 10 % of the sample is extremely deficient in F&V consuming less than 1 portion/d. Fully half the sample has an intake of 3 portions/d or less. This large variance in intakes involving a substantial likelihood of deficiency suggests that the standard regression proposition, that F&V intake response to a socio-economic driver is the same regardless of the baseline intake level, is unlikely to be a realistic representation.
Distribution of fruit and vegetable (F&V) consumption (in 80 g portions/d) in the sample: data from 11 044 adult individuals in the 2003 Health Survey of England
With twenty-eight independent variables and estimates available for seventy-three different conditional quantiles, presentation of results necessarily has to be selective. Graphs plotting estimates against quantiles for individual variables can adequately capture and summarise the cross-quantile variation in estimates. We employ such graphs for a selection of eight independent variables, selected either because of their importance in explaining F&V intake in previous literature or because they demonstrate interesting variation across different levels of F&V intake. These graphs (Figs 2 to 9 below) show the quantile estimates along with the bootstrapped 95 % confidence intervals shown as shaded areas around the estimates. In addition, the OLS estimate and the 95 % confidence interval are also shown as dashed and dotted straight lines, respectively, superimposed on the QR plots. Table 2 presents tabulated results for all variables, for a selected set of quantiles: 0·05 (the lowest conditional quantile function estimated), 0·25, 0·50 (median), 0·75 and 0·95 (the highest conditional quantile function estimated). The final columns of Table 2 also show the multiple linear regression (OLS) estimates.
Effect of gender (men in comparison to women) on fruit and vegetable (F&V) consumption (in 80 g portions/d): data from 11 044 adult individuals in the 2003 Health Survey of England. Quantile regression estimates across quantiles of the F&V intake distribution (–○–) with the bootstrapped 95 % confidence intervals shown as shaded areas around the estimates; Ordinary Least Squares estimates (— — —) and the corresponding 95 % confidence intervals (·······) are also shown
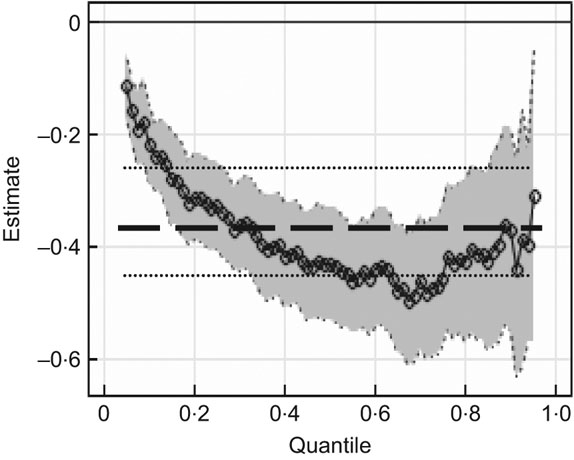
Effect of equivalised income (1000s of £) on fruit and vegetable (F&V) consumption (in 80 g portions/d): data from 11 044 adult individuals in the 2003 Health Survey of England. Quantile regression estimates across quantiles of the F&V intake distribution (–○–) with the bootstrapped 95 % confidence intervals shown as shaded areas around the estimates; Ordinary Least Squares estimates (— — —) and the corresponding 95 % confidence intervals (·······) are also shown
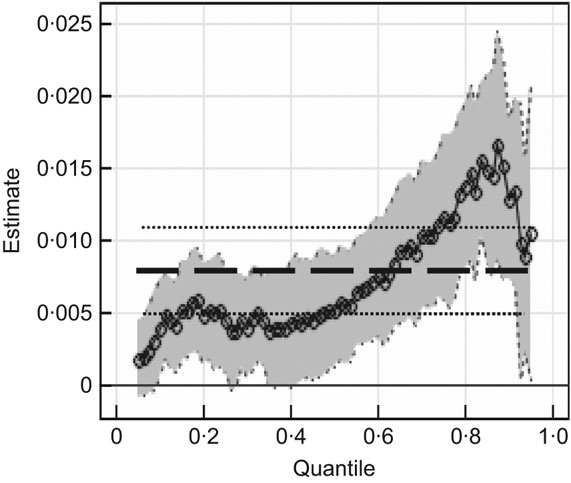
Effect of equivalised income (1000s of £) squared on fruit and vegetable (F&V) consumption (in 80 g portions/d): data from 11 044 adult individuals in the 2003 Health Survey of England. Quantile regression estimates across quantiles of the F&V intake distribution (–○–) with the bootstrapped 95 % confidence intervals shown as shaded areas around the estimates; Ordinary Least Squares estimates (— — —) and the corresponding 95 % confidence intervals (·······) are also shown

Effect of educational attainment (up to GCSE compared with no qualifications) on fruit and vegetable (F&V) consumption (in 80 g portions/d): data from 11 044 adult individuals in the 2003 Health Survey of England. Quantile regression estimates across quantiles of the F&V intake distribution (–○–) with the bootstrapped 95 % confidence intervals shown as shaded areas around the estimates; Ordinary Least Squares estimates (— — —) and the corresponding 95 % confidence intervals (·······) are also shown

Effect of educational attainment (GCSE to A-levels compared with no qualifications) on fruit and vegetable (F&V) consumption (in 80 g portions/d): data from 11 044 adult individuals in the 2003 Health Survey of England. Quantile regression estimates across quantiles of the F&V intake distribution (–○–) with the bootstrapped 95 % confidence intervals shown as shaded areas around the estimates; Ordinary Least Squares estimates (— — —) and the corresponding 95 % confidence intervals (·······) are also shown

Effect of educational attainment (A-levels to degree compared with no qualifications) on fruit and vegetable (F&V) consumption (in 80 g portions/d): data from 11 044 adult individuals in the 2003 Health Survey of England. Quantile regression estimates across quantiles of the F&V intake distribution (–○–) with the bootstrapped 95 % confidence intervals shown as shaded areas around the estimates; Ordinary Least Squares estimates (— — —) and the corresponding 95 % confidence intervals (·······) are also shown

Effect of ethnicity (black compared with white) on fruit and vegetable (F&V) consumption (in 80 g portions/d): data from 11 044 adult individuals in the 2003 Health Survey of England. Quantile regression estimates across quantiles of the F&V intake distribution (–○–) with the bootstrapped 95 % confidence intervals shown as shaded areas around the estimates; Ordinary Least Squares estimates (— — —) and the corresponding 95 % confidence intervals (·······) are also shown

Effect of ethnicity (Asian compared with white) on fruit and vegetable (F&V) consumption (in 80 g portions/d): data from 11 044 adult individuals in the 2003 Health Survey of England. Quantile regression estimates across quantiles of the F&V intake distribution (–○–) with the bootstrapped 95 % confidence intervals shown as shaded areas around the estimates; Ordinary Least Squares estimates (— — —) and the corresponding 95 % confidence intervals (·······) are also shown

Quantile regression estimates for selected quantiles of the fruit and vegetable (F&V) intake distribution and multiple linear regression estimates (Ordinary Least Squares, OLS) of the effects of sociodemographic variables on F&V consumption (in 80 g portions/d): data from 11 044 adult individuals in the 2003 Health Survey of England

It is readily apparent from Figs 2 to 9 that in most cases at least some portion of the QR estimates lie outside the OLS confidence intervals. This suggests that the simple conditional mean shift implied by the OLS model is not plausible. The first socio-economic driver we discuss is gender, which has been linked to F&V intake in previous studies. In the UK, the indication has been that not only do women eat more F&V(Reference Doyle and Hosfield1), but they are also attitudinally better disposed to incorporating more F&V in their diets(Reference Dibsdall, Lambert, Bobbin and Frewer16). Our results confirm this, as shown in Fig. 2. The OLS results show that, after controlling for changes in other variables, males consume approximately 0·37 portions (27 g) per day less than women. This is consistent with the 0·3 portion difference reported by Doyle and Hosfield(Reference Doyle and Hosfield1) based on the HSE 2001, although their analysis did not control for other variables. However, consideration of the QR results presented in Fig. 2 shows that there is significant variation in the gender effect across the intake distribution. At low levels of F&V intake, the gender difference is substantially less marked, with the difference being only 0·11 portions (about 9 g) at the 0·05 quantile. The gender effect peaks at almost half a portion (40 g) around the 0·7 percentile, gently declining in the higher intake area.
The OLS regression as well as QR results in Figs 3 and 4 at any given quantile suggest that increasing income generally increases F&V intake, but that this effect levels off as income gets larger. This is consistent with evidence from previous literature(Reference Ricciuto, Tarasuk and Yatchew17, Reference Giskes, Turrell, van Lenthe, Brug and Mackenbach18). Since the continuous variables have been centred to the median, the parameter estimates of the level (non-squared) terms indicate the marginal effect at the sample median. Thus at the median income in the sample, the OLS results indicate that every £1000 increase in income results in increased F&V intake of 0·007 portions, or approximately 0·6 g. Thus the independent income effect appears to be small, although statistically significant. However, QR shows that this income effect can be even smaller at the lower end of the F&V consumption distribution. At the extreme, for the 0·05 quantile, the computed effect of every £1000 increase from the median income level is only 0·0017 portions (0·13 g) of increased F&V intake. Indeed, the effect at this quantile is statistically insignificantly different from zero.
There exists a significant body of evidence indicating that education has a strong influence on F&V consumption. For example, Ricciuto et al.(Reference Ricciuto, Tarasuk and Yatchew17) used multiple regression on data from Canada to show that a household where the reference person has a university degree purchases 14 % more F&V than one with only basic schooling. Figures 5 to 7 clearly demonstrate the strong influence of education on F&V intake in England. The OLS results indicate that, holding all else constant, an individual with GCSE qualifications consumes about 0·4 portions (32 g) per day more than the base case person with no qualifications. A-level and degree qualifications raise this to approximately 0·8 (64 g) and 1·2 (96 g) portions respectively, compared with the base case. These are significant effects, but the QR results shown in the figures indicate that the OLS results tell only part of the story. The effects are substantially dependent on the part of the F&V intake distribution at which they are computed. Generally, very strong effects at higher levels of intake counterbalance relatively weak effects at lower levels. For example, A-level educated individuals at the 0·95 quantile consume almost 1·5 portions (120 g) more than those with no qualifications all else equal, but this education effect drops to only 0·28 portions (8·5 g) at the 0·05 quantile. In each of the higher educational attainment categories compared with the base case of no qualifications, the effect of the higher education on the bottom fifth of the conditional F&V intake distribution is comparatively weak.
Successive food surveys conducted in the UK have reported that black and Asian minority groups consume more F&V than the general population. The British Heart Foundation(19) notes that vegetable consumption is highest in the Asian and Chinese sub-populations, while fruit consumption is highest in the black and mixed categories. The OLS regression results reported here indicate that, after controlling for other sources of variation, blacks on average consume 0·4 portions (32 g) of F&V more than the base white case, while Asians consume almost a full portion more (0·9 portions, 72 g). The QR results in Figs 8 and 9 reveal that while the effect observed among blacks is relatively constant across quantiles (and constitutes a rare case where the QR results are more or less entirely within OLS confidence intervals), the effect observed among Asians is very quantile-dependent. Thus, at very high intake levels (0·95 quantile), the effect observed among Asians amounts to almost 1·5 portions more compared with whites, while at severe intake deficiency levels (0·05 quantile) this effect amounts to only 0·15 portions. In other words, there is a tenfold difference in the effect observed among Asians across the F&V intake distribution.
An important pattern appears to emerge from Figs 2 to 9 and the associated discussion above. Although all the variables represented in the figures, i.e. gender, income, education and ethnicity, have been found to be key determinants of F&V intake in other studies and have been confirmed so in the present study, the effects of these variables at low levels of intake are generally weak in comparison to the effects of the same variables at higher levels of intake. Interestingly, we found this effect to persist across most of the other variables included in the analysis, as seen in Table 2. Both the OLS and the QR results show that individuals living singly, in comparison to those living with partners, consume less F&V, all else held equal. However, this effect is lowest at the 0·05 quantile where single individuals consume 0·14 portions less, while the effect rises to 0·32 portions at higher quantiles in the distribution, gradually declining to 0·27 portions less at the right tail. Increased household size is found to negatively impact individual F&V intake. The OLS results show that, for every additional person in the household above the median size, there is about a quarter of an F&V portion reduction (after accounting for the quadratic term). However, the QR results show that the effect is almost half that suggested by OLS for the bottom half of the intake distribution. Those involved in ‘intermediate’ or ‘managerial’ socio-economic/occupational classes consume more F&V than those in ‘routine’ class. However again, the effect is relatively muted where baseline intakes are very low and in the case of the intermediate class, is statistically insignificant at the lower extreme.
Conclusions
Quantile regression methods have much to offer the investigation of the determinants of dietary intake. Dietary inadequacy or excess occurs at the tails of nutrient and food intakes, and it seems intuitive that intake responses in these areas will differ from elsewhere along the intake distribution. Our application of regression methods to F&V intake in England confirms that, even after controlling for a range of variables, we can conclude that women consume more F&V than men; Asians, particularly, but also blacks, more than whites; co-habiting individuals more than single-living ones; and rural inhabitants more than suburban and urban. Increased incomes and education, and reduced household sizes, also boost F&V intake, although the income effect appears small when other factors are controlled for. However, the key general finding of the present study is that the influence of most sociodemographic variables on F&V consumption in England is relatively weak in the area of greatest concern, i.e. at the lower tail where intake inadequacy is severe. One interpretation of this is that those in the lower tail of the conditional distribution (i.e. poor performers within reference groups defined by specific values for socio-economic variables) have inherent traits/preferences, unrelated to any particular socio-economic configuration, that cause them to be poor F&V consumers. This is worrisome from the point of view of F&V programmes and policies, since it implies that there are few identifiable levers or easy targets when it comes to shrinking the lower tail that represents gross intake inadequacy. Those with grossly inadequate F&V intake are naturally the ones that the 5-a-day campaign would wish to influence with the greatest urgency. However, given that our results find few socio-economic levers influencing such poor performers within any reference group, campaigns would have to be broad-based rather than finely targeted to effect significant improvements among those with very low intakes. This would mean campaigns spanning the spectrum of geographical areas and social and economic classes, and would inevitably require larger budgets.
Acknowledgements
The reported research was carried out with no specific funding, and there are no conflicts of interest. G.B. reviewed the literature, prepared the data and performed the initial statistical analysis. B.S. carried out further statistical analysis and shared in the writing with W.B.T. W.B.T. contributed conceptual and statistical advice and shared in the writing with B.S.
Appendix
More on quantile regression methods
Koenker and Bassett(Reference Koenker and Bassett8) noted that a set of causal variables could have myriad effects on the distribution of the dependent variable. They proposed that conditional quantiles of the dependent variable be estimated as linear functions of covariates, whereas simple linear regression expresses only the conditional mean as a linear function of covariates. By allowing conditional functions to be defined at any chosen quantile, QR leads allows the effect of a given set of covariates to flexibly vary across the distribution of the dependent variable. Unlike the standard applications of logistic regression methods on intake data, no sacrifice of information is entailed, while assumptions about the form of the parametric distribution (such as the logistic distribution in logistic regressions) are avoided. Classical linear regression reduces to a special case of QR where the effects of covariates are constrained to be the same across the distribution of the dependent variable. As Koenker and Hallock(Reference Koenker and Hallock11) caution, simply dividing the data into subsets based on values of the dependent variable and applying linear regression to the subsets is not statistically appropriate, and not comparable to quantile regressions. QR fitting at any quantile incorporates information from all sample data points.



