Colostrum, defined as the first secretion of the mammary gland after parturition (Jaster, Reference Jaster2005), is characterised by its high content of immunoglobulins (Ig), predominantly IgG (Butler, Reference Butler and Butler1981). Calves are born agammaglobulinaemic since the placenta of dairy cows is impermeable to Ig and consequently depend on timely administration of high-quality colostrum to acquire immunisation. Determination of colostrum quality, i.e. in a narrower sense Ig concentration, on farm must be rapid and give reliable results. Currently, instruments to measure specific gravity (hydrometer/densimeter/colostrometer) or the refractive index of colostrum (Brix refractometer) are used in practice. However, the accuracy in estimation of Ig concentration by using these methods is limited. Relationships between gravity and refractive measurements and colostral protein content were reported to be higher than the correlation with IgG1 concentration that represents most of the Ig in colostrum (Fleenor & Stott, Reference Fleenor and Stott1980; Quigley et al. Reference Quigley, Martin, Dowlen, Wallis and Lamar1994; Morin et al. Reference Morin, Constable, Maunsell and McCoy2001; Gross et al. Reference Gross, Kessler and Bruckmaier2013). Furthermore, temperature of colostrum (Mechor et al. Reference Mechor, Gröhn, McDowell and Van Saun1992; Chigerwe et al. Reference Chigerwe, Tyler, Middleton, Spain, Dill and Steevens2008) and season of calving (Morin et al. Reference Morin, Constable, Maunsell and McCoy2001) affect the validity of gravity measurements.
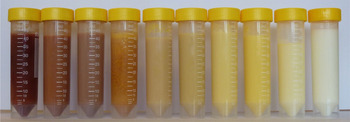
Colostrum colour can have a wide spectrum, from dark brown/red over yellow to pale white (Fig. 1). Brandt et al. (Reference Brandt, Haeussermann and Hartung2010) gave an overview on technical solutions including colour measurement to detect and separate abnormal milk. In the study of Madsen et al. (Reference Madsen, Rasmussen, Nielsen, Wiking and Larsen2004), colour measurement was identified as a potential tool to follow changes from colostrum to marketable milk with respect to identification of unsuitable milk for the dairy industry. Argüello et al. (Reference Argüello, Castro and Capote2005) confirmed the high sensitivity and suitability of colour measurement for predicting colostral IgG concentration in goats. However, Argüello et al. (Reference Argüello, Castro and Capote2005) based their findings on a pool of first and second milking samples. Furthermore, owing to the perceptual differences of colour distances and chroma values, especially in yellow shades, the CIELAB colour system was modified according to the DIN99 formula in order to harmonise sensation of colours (ASTM D2244, 2011).
Spectrum of colostrum colours in dairy cows compared with mature milk (right).

Up to now, no results showing the association between colostrum composition and its colour have been reported for dairy cows. However, the colour measurement was successfully tested to detect elevated milk cell contents in automatic milking systems (Brandt et al. Reference Brandt, Haeussermann and Hartung2010) and for determination of milk quality in dairy industries (Solah et al. Reference Solah, Staines, Honda and Limley2007). The objective of this study was to investigate the relationships between colostral IgG, fat, protein, and lactose concentration and colour measurement (including latest colour system adaptations to DIN99) in first colostrum of dairy cows. Furthermore, sensitivity, specificity, and negative predictive value (NPV) of the colour method were evaluated for suitability to predict IgG concentration in dairy cow colostrum.
Materials and methods
From September to December 2012, 117 colostrum samples of primiparous (n=81) and multiparous (n=36) Holstein dairy cows milked at 4 h 42 min±1 h 30 min post partum (mean±sd) were obtained by machine milking at the Agroscope research farm Posieux, Switzerland. Cows were fed the same lot of hay for ad-libitum intake during the dry period until parturition. Samples were frozen at −20 °C until analysis of IgG by ELISA and content of fat, protein, and lactose by infrared spectroscopy as described recently (Gross et al. Reference Gross, Kessler, Bjerre-Harpoth, Dechow, Baumrucker and Bruckmaier2014). Colostrum colour [CIE 1976 (L*, a*, b*) colour space − CIELAB] was measured in thawed and homogenised samples in triplicate at 25 °C using a calibrated Microflash 200 d spectrophotometer (Datacolor International, Dietikon, Switzerland), with the coordinates L* representing relative lightness (black to white), a* depicting the relative position between green and red, and b* indicating the relative position between blue and yellow. According to the DIN99 formula (ASTM D2244, 2011), measured a* and b* values were transformed using the following equations:
 $${\rm Redness}\,e = a^* \times {\rm cos(16}\deg {\rm )} + b^* \times {\rm sin(16}\deg {\rm )}$$
 $${\rm Yellowness}\,f{\rm = 0} \cdot {\rm 7 \times (} - a^* \times {\rm sin(16}\deg {\rm )} + b^* \times {\rm cos(16}\deg {\rm ))}$$
The parameters e and f were used to calculate the chroma value G (indicating visual perceived colourfulness):
 $$G = \sqrt {e^{\rm 2} {\rm +} f^{\rm 2}}. $$
Data were analysed using the statistical program package SAS (Version 9.2, SAS Institute, Cary NC, USA). The UNIVARIATE procedure was used to check for normal distribution of the data and identification of outliers. Using the CORR procedure, Pearson correlation coefficients were calculated to describe the relationships between colour measurement coordinates (L*, a*, b*, G) and colostral IgG, fat, protein, and lactose concentration. P values <0·05 were considered to be significant. Sensitivity, specificity, and the negative predictive value (NPV) of the colour measurement for testing IgG concentration were calculated using two-way contingency tables according to Argüello et al. (Reference Argüello, Castro and Capote2005). Considering IgG values of the ELISA analysis as true values, the colour method was classified as the test value. For this study, different threshold values between high- and low-quality colostrum were chosen: 50, 75, and 100 mg IgG/ml. Sensitivity was calculated by the proportion of samples identified by the colour method to have an IgG concentration <50 (75 and 100, respectively) mg/ml in all samples with a true IgG concentration <50 (75 and 100, respectively) mg/ml. Specificity represents the probability of samples with an IgG concentration ⩾50 (75 and 100, respectively) mg/ml identified by the colour method relative to all samples classified as high quality by the ELISA measurement. Calculation of the NPV was in agreement with Pritchett et al. (Reference Pritchett, Gay, Hancock and Besser1994) and Argüello et al. (Reference Argüello, Castro and Capote2005), and depicts the portion of truly high samples (estimated via ELISA) in all samples being identified as high-quality colostrum by the colour method. Since cows in the present study were fed the same diet, feed is unlikely to explain variation in the results of colour measurement.
Results and discussion
Colour of milk in dairy cows was shown to be clearly dominated by carotenoids and their transfer from blood to milk (Nozière et al. Reference Nozière, Graulet, Lucas, Martin, Grolier and Doreau2006; Calderón et al. Reference Calderón, Chauveau-Duriot, Martin, Graulet, Doreau and Nozière2007). Though carotenoids were not analysed in milk samples in the present study, hay feeding provided only a small amount of β-carotene in the feed. All cows were of the same breed, and the different parities might contribute to only a small degree on variation in plasma and milk carotenoid content (Nozière et al. Reference Nozière, Graulet, Lucas, Martin, Grolier and Doreau2006). Further factors such as metabolism and transfer rate of carotenoids might lead to considerable individual variation between cows despite a constant feeding management (Nozière et al. Reference Nozière, Graulet, Lucas, Martin, Grolier and Doreau2006; Calderón et al. Reference Calderón, Chauveau-Duriot, Martin, Graulet, Doreau and Nozière2007) and might have an impact on the observations.
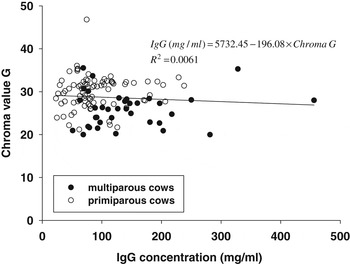
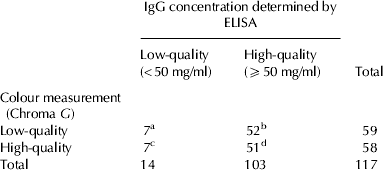
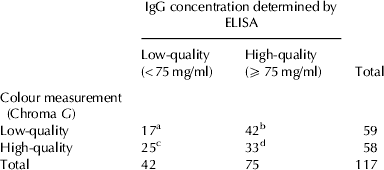
No significant relationship between the Chroma G and IgG concentration in first colostrum of dairy cows was found in the present study (r 2=0·0061; P=0·40; Fig. 2) contrary to the findings in goat colostrum in the study of Argüello et al. (Reference Argüello, Castro and Capote2005). Parity did not have an effect on the relationship between IgG concentration and the Chroma G (P=0·81; Fig. 2). Values for sensitivity, specificity and NPV were highest at the threshold of 50 mg IgG/ml compared to 75 and 100 mg/ml in colostrum (Tables 1–3). The threshold of 50 mg IgG/ml is commonly accepted to classify good colostrum in dairy cows (Tyler et al. Reference Tyler, Hancock, Parish, Rea, Besser, Sanders and Wilson1996, Reference Tyler, Hancock, Thorne, Gay and Gay1999). Similar values for sensitivity and NPV were reported for the usage of a hydrometer to predict IgG1 concentration in dairy cow colostrum by Pritchett et al. (Reference Pritchett, Gay, Hancock and Besser1994), though values for sensitivity, specificity and NPV were markedly lower compared with the findings for colour measurements in goat colostrum reported by Argüello et al. (Reference Argüello, Castro and Capote2005) and Brix refracometry in dairy cow colostrum by Quigley et al. (Reference Quigley, Lago, Chapman, Erickson and Polo2013). As already shown above, IgG concentration was not correlated with Chroma G (P=0·40), but a significant correlation was found with the relative lightness L* (P<0·0001, Table 4). Besides IgG concentration, colostrum constituents (fat, protein, and lactose) contribute to the nutritive value of colostrum. Milk fat content was significantly correlated with L*, a*, b* and G (P<0·0001, Table 4). Milk protein content did not show a significant correlation with a*, but with L*, b* and G (Table 4). Lactose content in colostrum was not correlated with L* and a* (P>0·05), but with b* and G (P<0·0001, Table 4). Low correlations between parameters of colour measurements (a*, b*, G) and colostrum constituents (IgG and protein) might be explained by their high variation compared with the relative concentrations of fat and lactose.
Relationship between colostral IgG concentration and Chroma G for colostrum of primiparous and multiparous dairy cows.

Two-way contingency table [according to Argüello et al. (Reference Argüello, Castro and Capote2005)] for calculation of sensitivity†, specificity‡, and negative predictive value (NPV)§ of colour measurement to estimate colostral IgG concentration at a threshold of 50 mg/ml. Figures in the table show the number of observations

† Sensitivity=a/(a+c)×100=7/14×100=50·0%
‡ Specificity=d/(b+d)×100=51/103×100=49·5%
§ NPV=d/(c+d)×100=51/58×100=87·9%
Two-way contingency table [according to Argüello et al. (Reference Argüello, Castro and Capote2005)] for calculation of sensitivity†, specificity‡, and negative predictive value (NPV)§ of colour measurement to estimate colostral IgG concentration at a threshold of 75 mg/ml. Figures in the table show the number of observations

† Sensitivity=a/(a+c)×100=17/42×100=40·5%
‡ Specificity=d/(b+d)×100=33/75×100=44·0%
§ NPV=d/(c+d)×100=33/58×100=56·9%
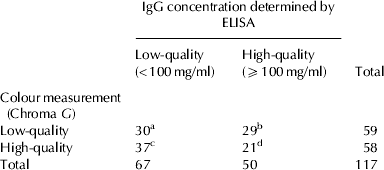
Two-way contingency table [according to Argüello et al. (Reference Argüello, Castro and Capote2005)] for calculation of sensitivity†, specificity‡, and negative predictive value (NPV)§ of colour measurement to estimate colostral IgG concentration at a threshold of 100 mg/ml. Figures in the table show the number of observations

† Sensitivity=a/(a+c)×100=30/67×100=44·8%
‡ Specificity=d/(b+d)×100=21/50×100=42·0%
§ NPV=d/(c+d)×100=21/58×100=36·2%
Pearson correlation coefficients (r) between colostral IgG, fat, protein, and lactose concentrations and the CIE coordinates L*, a*, b* and Chroma G

The predictive value to estimate colostral IgG concentration by colour measurement for dairy cows showed comparable values to sensitivity and NPV obtained by specific gravity (Pritchett et al. Reference Pritchett, Gay, Hancock and Besser1994) and refractive measurements (Quigley et al. Reference Quigley, Lago, Chapman, Erickson and Polo2013). Though not being as accurate as reported for goats by Argüello et al. (Reference Argüello, Castro and Capote2005), colour measurements of dairy cow colostrum might be a new tool to assess colostrum quality. Implementation of this technique on dairy farms is already state of the art in automatic milking systems to separate abnormal milk, e.g. during mastitis (Brandt et al. Reference Brandt, Haeussermann and Hartung2010). Adjustments for colostrum would be the next step. Argüello et al. (Reference Argüello, Castro and Capote2005) suggested a colour fan for visual estimation of IgG concentration by farm personnel.
The present study confirmed the relationship between milk fat content and lightness L* as well as yellowness b* in agreement with Solah et al. (Reference Solah, Staines, Honda and Limley2007). Protein in colostrum contributed to lightness L* in samples of the present study in agreement with findings for mature milk (Quinones et al. Reference Quinones, Barbano and Philips1998; Solah et al. Reference Solah, Staines, Honda and Limley2007). Thus, colostrum with a more yellow and darker colour is very likely to contain more milk fat and protein as well as immunoglobulins compared with a more pale colostrum. However, it needs to be considered that also blood components and dietary composition (e.g. β-carotene) might affect colostrum colour (Madsen et al. Reference Madsen, Rasmussen, Nielsen, Wiking and Larsen2004; Solah et al. Reference Solah, Staines, Honda and Limley2007).
In conclusion, colour measurement of colostrum in dairy cows can be an additional instrument besides colostrometer and refractometer to assess colostrum quality. Sufficient sensitivity, specificity, and NPV of this method anticipate a reliable estimation of colostrum quality though the chroma value alone does not reflect IgG concentration in a satisfactory manner. Though colour measurement does not improve estimation of IgG content in colostrum samples compared with currently available instruments and implies the further development of complementary and more accurate methods, other purposes (e.g. detection of non-deliverable milk) might be addressed in a very sensitive way.
The authors thank the Milchprüfring Baden-Württemberg e.V. (Ravensburg, Germany) and the Milchprüfring Bayern e.V. (Wolnzach, Germany) for coordination, validation, and performance of colostrum analyses.