Introduction
The American Clean Energy and Security Act of 2009, often referred to as the Waxman-Markey bill, is by far the closest that the United States (US) has come to adopting federal legislation to mitigate climate change. The bill passed in the House but later stalled in the Senate. Moreover, Waxman-Markey and other climate bills were the subject of intense lobbying efforts by electric utilities. Although the American Coalition for Clean Coal Energy (ACCCE) spent almost USD 15 million in lobbying activities in the years 2009–2010, mostly to undermine climate legislation,Footnote 1 Duke Energy, an electric utility that had recently tried to reduce its dependence on coal and use more renewable energy, left the group as a protest.Footnote 2 The utility explained the decision to leave the group with reference to ACCCE’s anti-climate policy position and, in particular, the lobbying organisation’s decision to use a public relations firm to send fake letters against Waxman-Markey in the name of various organisations.
The behaviour of Duke Energy highlights the importance of lobbying by individual electric utilities on climate policy. With 40% of America’s carbon dioxide emissions being generated in the power sector, few other industries have such a direct interest in the content of federal climate policy. Coal companies expect huge losses from limits on carbon dioxide, whereas users of natural gas and renewable energy may reap handsome gains owing to their lower carbon dioxide emissions. Given these divisions, there is little reason to expect that electric utilities would remain indifferent. Indeed, the past decade has seen a rapid growth in lobbying, as lobbying spending by electric utilities more than doubled from USD 79 million in 2000 to USD 192 million in 2010.Footnote 3
Given how important the power sector is for climate policy, it is surprising that the literature on environmental policy mostly ignores the lobbying behaviour of this sector. Although much has been written about the political influence of business interests in environmental policy (Bernhagen Reference Bernhagen2008; Gullberg Reference Gullberg2008) and more generally (Martin Reference Martin1989; Hart Reference Hart2004; Culpepper Reference Culpepper2010), the political strategies of utilities have drawn little attention. One possible exception is McFarland’s (Reference McFarland1984) work that provides a largely descriptive overview of energy lobbying in five sectors – oil, natural gas, nuclear energy, coal, and research and development of alternative sources.Footnote 4
We correct this oversight by analysing lobbying disclosure data for electric utilities – the power sector – during the 111th Congress. This Congress is ideal for the study because several major climate bills were introduced, whereas the 110th and 112th Congress did not introduce any major climate bills. We pay particular attention to the case of Waxman-Markey, as it is by far the most frequent target of lobbying among all climate bills for electric utilities, but also analyse three other major climate bills. In 2009, Waxman-Markey was the ninth most lobbied bill among all federal legislation, measured by the number of lobbying disclosure reports that mentioned it. We combine data from the lobbying disclosure records with fuel choice data from the Environmental Protection Agency (EPA) for all electric utilities in the US, including independent power producers.
The empirical analysis focuses on testing hypotheses on the lobbying behaviour of winners (electric utilities that use renewables and natural gas) and losers (electric utilities that use coal) from new federal climate policies. We argue that individual utilities on the winning side have strong incentives to engage in lobbying, because they can try to shape the specific provisions of the legislation to increase their own profits. For these utilities, individual lobbying is an opportunity to shape the details of the legislation. In contrast, expected losers are primarily interested in stopping the climate legislation from being enacted. For these utilities, individual lobbying makes little sense. Instead, they focus their collective efforts on stopping the legislation through Olson’s (Reference Olson1965) collective action.
The results support this interpretation. For all major climate bills under consideration, utilities that generate a lot of electricity from renewables or natural gas lobby more often than other utilities. Increasing net electricity generation from renewables and natural gas by one standard deviation (SD) raises the probability of lobbying by 116 and 121%, respectively. At the same time, higher levels of net electricity generation from coal do not have such an effect. These differences cannot be attributed to differences between expected winners and losers in the existence of opportunities for collective lobbying as an alternative to individual efforts. Organised renewable energy lobbies have existed in the US at least since the early 1970s (McFarland Reference McFarland1984) and utilities have been using natural gas for an even longer time. These long histories mean that not only expected losers, but also expected winners, were able to engage in collective lobbying, as we show in a short qualitative analysis.
For scholars of environmental policy, the results highlight the importance of distinguishing between collective and individual lobbying. Most of the existing literature has shown that both winners and losers from environmental policy lobby for their preferred policies, with no clear difference in their ability to promote their interests (Vogel Reference Vogel1996; Michaelowa Reference Michaelowa2005; Gullberg Reference Gullberg2008; Bunea Reference Bunea2013; Cheon and Urpelainen Reference Cheon and Urpelainen2013). We have shown that, when we train our analytical lens on individual lobbying, the activity levels are much higher for electric utilities expecting to win than for their losing counterparts. This finding emphasises the critical importance of distinguishing between individual and collective lobbying, echoing Gilligan’s (Reference Gilligan1997) argument concerning firm-specific interests in trade policy.
The general picture of lobbying is consistent with earlier results. Our qualitative evidence suggests that there is no difference in collective lobbying between expected winners and losers, similar to the emphasis on interest groups and advocacy coalitions in the literature (Baumgartner and Leech Reference Baumgartner and Leech1998; Mahoney Reference Mahoney2007, Reference Mahoney2008; Baumgartner et al. Reference Baumgartner, Berry, Hojnacki, Leech and Kimball2009; Boehmke et al. Reference Boehmke, Gailmard and Patty2013). In our case, possible reasons for the importance of individual lobbying among expected winners include the technical complexity of the issue, the comprehensive nature of the legislation and the heterogeneity of interests in the power sector. Given these conditions, individual lobbying is attractive to the expected winners. In many other cases, everyone within one industry may have the same broad interests, resulting in the primacy of collective lobbying at the expense of individual efforts.
More broadly, the findings add to the body of knowledge about the lobbying behaviour of businesses. As Hart (Reference Hart2004) argued in a review article published a decade ago, business interests are heterogeneous and individual firms may have fundamental disagreements about economic policies. Although there is a lot of empirical research on lobbying by interest groups in American politics (Galanter Reference Galanter1974; Baumgartner et al. Reference Baumgartner, Berry, Hojnacki, Leech and Kimball2009; Hojnacki et al. Reference Hojnacki, Kimball, Baumgartner, Berry and Leech2012; Boehmke et al. Reference Boehmke, Gailmard and Patty2013), the behaviour of individual firms has been studied less extensively. We show that Hart’s (Reference Hart2004) argument applies to the case of environmental and energy policy.
Electric utilities and climate policy in the American context
Electric utilities are, by their very nature, a core sector for climate policy. In the US, the power sector generated -- largely thanks to its heavy reliance on coal -- 39% of energy-related carbon dioxide emissions in 2012.Footnote 5 The carbon intensity of the power sector is expected to decrease in the coming years owing to the growing use of natural gas (low carbon emissions) and renewable energy (no carbon emissions). Any ambitious climate bill would further reduce the competitiveness of coal and promote the interests of renewable energy and natural gas.
One of the most fundamental factors that influences the interests of electric utilities is their fuel choice. Some fuels, such as solar and wind power, do not emit any carbon. Utilities that have invested in such capacity may expect tremendous benefits from climate policies, such as carbon emission markets or renewable portfolio standards. For example, Cheon and Urpelainen (Reference Cheon and Urpelainen2013) consider renewable electricity generators a core interest group that supports more stringent climate policies in industrialised countries. Others, such as natural gas, have a relatively low carbon content. In contrast, because the burning of coal produces large amounts of carbon, coal users have a lot to lose from new climate policy.
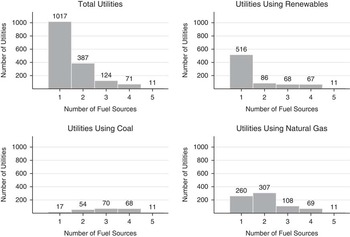
Figure 1 provides a rough summary of the variation in the number of fuel choices based on the Energy Information Administration (EIA) data we exploit in our analysis. Each histogram represents the number of utilities that use a specific fuel type, arranged by the total number of fuel sources these utilities consume. For example, the histogram for utilities using renewables is restricted to the subsample of utilities utilising renewable energy and shows how many utilities in the subsample rely on one or multiple fuel sources. Importantly, the number of the utilities that use more than one fuel varies significantly across the utility types. For example, the majority of renewable energy generators use only renewables, whereas utilities that rely on coal also use many other fuels. This indicates that renewable energy generators may have clearer incentives than coal users with regard to lobbying. Though not shown in the figure, the data also show that most utilities using renewables do not utilise other fuel sources, and only one of those generate electricity using both renewables and coal. In contrast, the utilities using coal heavily rely on other fuel types, as compared with other sources. Again, this emphasises the clearer incentives that renewable energy generators have with respect to lobbying on climate policy.
Number of fuel sources used by different utilities (Energy Information Administration).

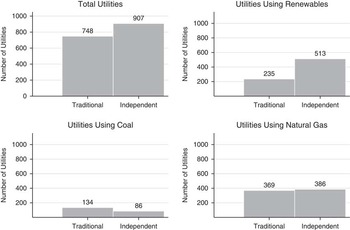
Another key observation is the difference between traditional regulated utilities and independent power producers. Historically, the American power sector has been dominated by the traditional regulated utilities that are either public or private and generate power under regulations set by state and federal regulators (Hirsh Reference Hirsh1999). However, in 1978, Congress passed the Public Utility Regulatory Policies Act aimed at allowing independent power production by co-generators and small power plants. The main motive of this act was to restore energy independence by decreasing the amount of imported oil (Russo Reference Russo2001). The individual power producers are private and are exempted from regulation policies, including gas price increases (Sine et al. Reference Sine, Haveman and Tolbert2005). The differences between different types of producers are illustrated in Figure 2. In total, the number of independent power producers exceed that of traditional utilities. However, in the subsample of the utilities based on coal, there are more traditional utilities than independent power producers. Indeed, the proportion of each type of utility is quite different depending on the type of fuel. In the subsample of utilities that use renewables, there are more independent power producers. For natural gas the number is relatively even.
Different types of utilities in the United States by fuel type used (Energy Information Administration).

The descriptive data presented in this section have important implications for studying lobbying. For one, many utilities rely on multiple fuels, suggesting that any given utility may have mixed incentives with regard to lobbying on climate policy. This is especially true of utilities that burn coal. Second, there are clear differences between traditional utilities and independent power producers in their fuel choices. Although this section does not show data on variation in utility size, it is evident that larger utilities are more likely to rely on multiple fuels than their smaller counterparts.
Electric utilities, lobbying and federal climate legislation in the 111th Congress
To explain lobbying patterns among electric utilities, we train an analytical lens on the federal climate legislation of the 111th Congress (2009–2010). This time period is ideal for the study, because several important climate bills were introduced in the Congress and lobbying on federal climate legislation reached record heights. Although none of the climate bills was enacted in the end, the Waxman-Markey bill passed in the House and there was considerable uncertainty about the prospects of the bill in the Senate. The 111th Congress was simultaneous to President Obama’s first term as a president, and expectations for climate policy were high owing to the dominance of Democrats in the House and Senate. The hopes were also high for the Conference of Parties of the United Nations Framework Convention on Climate Change in Copenhagen, December 2009, to make major progress towards the formulation of a global climate agreement. Federal climate policy was a hot topic for interest groups and individual companies.
In developing the framework for the analysis, we draw on a rich tradition of political-economic literature on lobbying and interest groups. We emphasise the notion of competitive lobbying, with different interest groups competing for influence over policy (Milner Reference Milner1988; Austen-Smith and Wright Reference Austen-Smith and Wright1992; Grossman and Helpman Reference Grossman and Helpman1994; Gullberg Reference Gullberg2008). As shown in studies by Keohane et al. (Reference Keohane, Revesz and Stavins1998) and Cheon and Urpelainen (Reference Cheon and Urpelainen2013), the winners prefer environmental policy owing to their own commercial interest, whereas losers worry about the costs of environmental policy. Our focus is on individual lobbying targeted at a specific bill, as opposed to operations through trade associations or campaign contributions in electoral. In doing so, we have to depart from the typical framework for understanding interest groups as collectives (Olson Reference Olson1965; Grossman and Helpman Reference Grossman and Helpman1994; Baumgartner et al. Reference Baumgartner, Berry, Hojnacki, Leech and Kimball2009) and instead build on works that consider the possibility of lobbying by individual firms (Hansen et al. Reference Hansen, Mitchell and Drope2005; Bombardini and Trebbi Reference Bombardini and Trebbi2012). We do not attempt to theorise about the timing of lobbying activities.
Context of lobbying: identifying winners and losers
Before delving into the details of the theory, we discuss the context and the challenge of identifying winners and losers for our analysis. In the case of the 111th Congress, lobbying was about replacing non-legislation with a federal bill. In the status quo, the executive’s ability to engage in climate mitigation was solely based on the Clean Air Act. The Clean Air Act is a federal law that requires the EPA to establish national ambient air quality standards for pollutants based on the latest science. It was introduced with the 1963 legislation and was expanded with the 1970, 1977 and 1990 amendments.Footnote 6 In the absence of federal climate legislation, an executive’s regulation is only possible under the Clean Air Act. The scope of the Clean Air Act has expanded since the initial introduction, and the EPA has made initial steps under the Act to limit emissions that cause climate change.Footnote 7 Yet, there was no federal legislation designed to address climate change. Against this background, lobbying activities targeted passing a federal bill instead of strengthening the existing policy. A federal climate bill was clearly possible, but not inevitable.
We can reasonably assume that the coal industry expected to lose from climate legislation. On the American Clean Energy and Security Act of 2009 (H.R. 2998), the ACCCE President announced its opposition, saying that “ACCCE cannot support this bill, as it is written, because the legislation still does not adequately protect consumers and the domestic economy or ensure that the American people can continue to enjoy the benefits of affordable, reliable electricity, which has been so important to our nation”.Footnote 8 Legislators also shared this understanding. Charles Wilson, then Representative from Ohio, explained his vote against the American Clean Energy and Security Act of 2009 (H.R. 2454) by noting that, “because we are located in an area of the country that heavily relies on coal to turn on the lights and heat our homes, Ohio families and her energy intensive industries, like steel, will bear the brunt of the cost from this version of climate change legislation”.Footnote 9
Moreover, available economic analyses of the Waxman-Markey bill support this interpretation. According to an EPA analysis in April 2009, it would completely stop the construction of new coal power, with the exception of a small increase in plants with carbon capture and storage, as compared with continued construction over time in the reference scenario (EPA 2009, 24). According to Point Carbon (2009, 2), coal generators are at the greatest risk of failing to recover the cost of carbon pricing. In particular, “a company with many coal power plants in a market where prices are set by natural gas on the margin would not recover all its carbon costs through the price increase” (Point Carbon 2009, 12). These two different analyses point to the general threat that carbon pricing presents to utilities owning coal-powered plants.
Regarding winners from the legislation, the case of renewable energy is clear. The evidence for natural gas is also strong. By 2015, the EPA (2009, 23) analysis suggests that renewable energy power generation increases from a reference case of 230 to 285 TW hours, growth of 23% already. According to Point Carbon (2009, 12), “[a] company with a low-carbon fleet (nuclear, renewable or even natural gas) in a market where prices are set at the margin by electricity from coal-fired generation will potentially recover more than its actual costs because it will benefit from the larger price increase without having to pay for as many allowances”. This basic observation allows Point Carbon (2009, 14) to characterise the winners as utilities whose “[g]eneration fleets that include non-emitting fuels – hydro, nuclear and renewable energy – fare best, followed by fleets with low-emitting plants such as combined cycle gas turbines”.
Lobbying by expected losers
For electric utilities that expect to lose from a climate bill, the primary goal is to reduce the odds of it being passed. These opponents of emissions reductions have a common economic interest in opposing new climate policies, as all of them would see their competitiveness decrease in the face of more stringent constraints on carbon dioxide emissions. In such a setting, Olson’s (Reference Olson1965) “logic of collective action” applies. As no utility can stop federal climate legislation on its own, there is no effective alternative to collective action. Even the largest individual electric utilities are not individually capable of stopping a major federal climate legislation, but together they can undermine environmental regulations. Building on Olson’s (Reference Olson1965) theory, Hansen et al. write that, “a firm would not contribute or lobby to secure a collective good because the individual contribution is unlikely to make a difference to the outcome and because the individual cannot be punished for not contributing” (2005, 151).
In the case of climate policy this logic clearly applies. If coal users manage to coordinate their efforts, they can collectively avoid the cost of constraints on carbon emissions and continue their profitable operations. In the case of climate policy, for example, effective action by utilities that rely on coal could stop legislation implementing an emissions-trading scheme with a binding cap on carbon dioxide emissions in the power sector. Even if the lobby failed to stop the bill from progressing, the efforts of lobbyists could increase the amount of carbon dioxide emissions allowed or delay implementation. As the passing of climate legislation was neither impossible nor inevitable, opponents had an opportunity to prevent future costs through collective action, whereas individual lobbying would have been ineffective.
Given this collective interest, the clear losers from a climate bill would not lobby individually. If the coalition of expected losers is to stop the bill, their primary strategy will be to join their forces and lobby and campaign through a trade association. As no individual electric utility can have a significant effect on the probability that climate legislation is passed and implemented, individual lobbying should be limited. The homogeneity of coal producers means that they can achieve their goals best through collective lobbying.
There is another reason to favour collective action among coal users. For collective lobbying to occur, the net benefits must exceed those of individual lobbying or doing nothing (Olson Reference Olson1965; Sandler and Tschirhart Reference Sandler and Tschirhart1980; Bendor and Mookherjee Reference Bendor and Mookherjee1987; de Figueiredo and Tiller Reference de Figueiredo and Tiller2001; Magee Reference Magee2002; Bombardini Reference Bombardini2008). The economies of scale that favour the burning of coal in large units also facilitate collective action. In the presence of free-rider problem, a small number of large coal users can easily overcome obstacles to collective action and mobilise effectively to combat federal climate legislation.
Hypothesis 1: High coal use does not predict active individual lobbying by electric utilities.
Lobbying by expected winners
In terms of individual lobbying, there is an important difference between expected losers and winners. Although the former have little to gain from acting individually, the latter have a strong interest in the details of the climate legislation. Users of renewable energy prefer specific provisions to promote renewables, whereas users of natural gas want policies that create demand for their products. As lobbying is not very expensive relative to the large scale of operations for many electric utilities, they have an incentive to request specific beneficial legislative provisions even if they believe their probability of success to be small. For example, the version of the most important legislative bill we consider, H.R. 2454, was 1,428 pages long when it passed the House in a roll call vote, illustrating the detailed nature of the provisions.Footnote 10 As Representatives are selected by district and Senators by House, it is plausible that they have the ear of specific policymakers on Capitol Hill. As de Figueiredo and Tiller (Reference de Figueiredo and Tiller2001) point out, when an individual firm wants the government to tailor specific policies according to its needs, the firm is more likely to lobby individually.
Hypothesis 2: High renewable energy use predicts active individual lobbying by electric utilities.
Hypothesis 3: High natural gas use predicts active individual lobbying by electric utilities.
Although the relatively small size of many renewable energy and natural gas generators may complicate collective action, the presence of this problem itself would not promote individual lobbying. The alternative to collective action is to do nothing. Our argument emphasises individual lobbying as an activity that has a different goal than collective action. If anything, there should be a certain complementarity relationship between individual and collective lobbying among the expected winners. Without any collective action, individual lobbying activities for specific provisions may prove futile because the climate bill is never passed by the Congress.
Research design
The basic idea of our research design is to combine lobbying disclosure data with detailed information on the fuel choice and other characteristics of electric utilities in the US. We then use the fuel choice to predict lobbying activity on a series of major climate bills introduced during the 111th Congress (2009–2010).
The analysis captures both traditional regulated utilities and independent power producers. We exclude industrial and commercial co-generators because, for them, power generation is a side activity. These firms often have significant other interests in lobbying climate policy. For example, heavy industry often has some electricity co-generation alongside their industrial operations. Including such operators in the sample would prevent us from focusing on utilities. Letting i indicate utility and j state, we estimate probit models of the following type:
 $$\eqalign{ Pr(Y_{{ij}} =1)=\Phi (\alpha {\plus}\beta _{1} {\rm Coal}_{{ij}} {\plus}\beta _{2} {\rm Renewables}_{{ij}} \cr\quad \ {\plus}\beta _{3} {\rm Natural \ gas}_{{ij}} {\plus}\gamma X_{{ij}} {\plus}\delta Z_{j} {\plus}\mu )$$
where Φ denotes the normal distribution. Each utility i is located within state j based on the largest annual net generation across states. We expect β 1 to be negative and β 2 and β 3 to be positive. Vectors X and Z denote control variables at the utility and state level, respectively. Finally, μ is a vector of region fixed effects. Some specifications also include state fixed effects.
Dependent variable
Our dependent variable is a binary indicator for whether or not an electric utility lobbied a given piece of climate legislation introduced in the 111th Congress. We collected all the lobbying reports from this period that mention a given climate bill and then matched the lobbying data set with the electric utilities data set. We examined whether an electric utility lobbied a given bill and constructed a binary variable taking the value of 1 if the electric utility lobbied for at least one out of eight quarters in the years 2009–2010 and 0 otherwise. Unfortunately, we lack information about how much money utilities spent in lobbying any specific bill. Although the lobbying disclosure records provide quarterly data on total lobbying, the lobbyist is not required to disaggregate this total amount by legislative item. Therefore, we cannot use the sum spent on lobbying as the dependent variable.
We use data on whether an electric utility i lobbied for each of the major climate bills: (i) the American Clean Energy and Security Act (H.R. 2454) that would have imposed a cap on greenhouse gas emissions and implement emissions trading, (ii) the Clean Energy Jobs and American Power Act (S. 1733), the first senate version of H.R. 2454, (iii) the Carbon Limits and Energy for America’s Renewal (CLEAR) Act (S. 2877) that aimed to promote clean energy jobs and economic growth through the establishment of a programme to regulate commercial usage of fossil carbon and (iv) the American Clean Energy Leadership Act (S. 1462) that would have established a renewable energy standard.
These key bills are from the list of key climate legislation selected by the Center for Climate and Energy Solutions. The centre provides a summary of climate-related legislative activities and depicts key climate legislation for each congressional term from the 106th Congress to the 112th Congress.Footnote 11 Among over 200 climate or energy bills, resolutions and amendments in the 111th Congress, a total of eight bills and one discussion draft were highlighted as key legislation during the 111th Congress.Footnote 12 The centre chose the key legislative activities by excluding activities that amend previous legislation or codes and by focusing on bills targeted at (i) limiting greenhouse gas emissions, (ii) promoting clean energy jobs and (iii) supporting a transition to a clean energy economy through a cap-and-trade programme or other clean technology policies.
We collected all the relevant lobbying reports on these bills. However, only four of them turn out to have been lobbied by a substantial number of electric utilities: H.R. 2454, or the American Clean Energy and Security Act, was the most frequently lobbied bill among the nine key bills (7% of electric utilities in our data set lobbied for this bill), followed by the Clean Energy Jobs and American Power Act (S. 1733), the senate version of H.R. 2454 (4% of utilities lobbied), the American Clean Energy Leadership Act (S. 1462, 4% of utilities lobbied) and the CLEAR Act (S. 2877, 2% of utilities lobbied). We do not consider the other four bills that were lobbied by less than 1% of electric utilities.Footnote 13
We estimate binary probit models separately because it allows a stringent empirical test. Using count models, however, we also check if the amount of net generation using different fuel types affects the frequency of lobbying activities across the bills. In the Supplementary Appendix, we estimate zero-inflated negative binomial models that account for lobbying and non-lobbying decisions, thereby addressing concerns about excessive zeros in the dependent variable. Across all the specifications, the results show that the amount of renewable net generation and that of natural gas net generation predict the probability of lobbying, whereas the amount of coal net generation has little impact.
Explanatory variables
The primary explanatory variables are quantities of electricity generated from coal, renewable energy and natural gas in 2008. The raw data for net electricity generation in 2008 are from the EIA and are measured in megawatt hours.Footnote 14 As the EIA data set gives the net generation data at the plant level, we use the sum of net generation across the plants operated by any given utility.
The value of net generation at the utility level is logarithmised for the analysis.Footnote 15 An alternative would have been to use the share of a certain fuel, such as renewables, by the utility. However, this measurement strategy would deviate from our theory. We do not expect tiny utilities to lobby even if they only rely on renewables, natural gas or coal. Instead, we expect the increased importance of renewables, natural gas or coal to change the behaviour of a utility. For example, if renewable energy use increases in the plants operated by a utility, we expect more lobbying. The renewable energy sources included are solar, hydro, wind, geothermal, biomass and biogenic components of municipal solid waste.
Control variables
We include a series of control variables to account for confounding influences. To control for utility size, we also include the logarithm of all electricity generation other than coal, renewable energy and natural gas. Fuels such as hydroelectric power, petroleum, agricultural waste and preexisting nuclear power do not generate as clear incentives for or against climate policy as the fuels under consideration, although we recognise that new nuclear power potential could, at least in principle. Considering these fuels allows us to account for utility size, while still allowing coal, natural gas and renewables to have differing effects for scientific hypothesis testing.
We include an indicator for independent power producers. Traditional utilities may, owing to their being subject to federal regulations, have stronger incentives to lobby than independent power producers. Moreover, we noted above that renewable energy tends to be produced by independent power producers. To avoid confusing utility type with the renewable energy choice, this control variable is useful.
We also include a series of state-level control variables based on the state where a given electric utility’s largest annual net generation is located. From the Database of State Incentives for Renewables and Efficiency, we include data on whether or not a state has an active renewable portfolio standard. Such a policy could influence an electric utility’s interest in renewable energy policy at the federal level, as federal legislation could supersede the state legislation. From the EIA, we also include control variables for active and suspended electricity deregulation to account for the possibility that higher levels of regulation induce lobbying by traditional utilities. As Republican legislators could play a pivotal role in stopping climate policies under a Democrat President, we also include the percentage of Republican Senators and Democrats in the state. Region fixed effects are included for the Atlantic, Northeastern, Northwestern, Midwestern and Southeastern states.
Findings
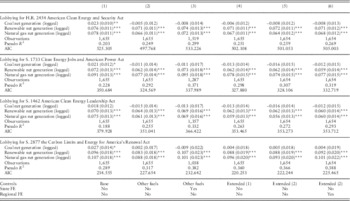
This section presents our main results on individual lobbying. These results, presented in Table 1, are in line with our theoretical expectations. Across all estimated models, we find the amount of coal net generation to have little impact on the probability of lobbying on climate bills. In contrast, the amounts of renewable energy and natural gas used in electricity generation increase the probability of lobbying.
Probit regressions on electric utilities and lobbying on climate bills

Notes: In model (1), we include a binary indicator for independent generators. In models (2) and (3), we control for net generation with fuels other than coal, renewables and natural gas. We include state fixed effects in model (3). In model (4), we add state-level control variables. In models (5) and (6), we, in addition, control for the share of Republicans among House Representatives and Senators. The coefficients for control variables are shown in the supplementary appendix. SEs are in parentheses.
AIC=Akaike information criterion; FE=fixed effects.
*p<0.10, **p<0.05, ***p<0.01.
The first subtable in Table 1 summarises the estimation result from the probit regression models for lobbying on the American Clean Energy and Security Act (H.R. 2454). The following subtables are for lobbying on the Clean Energy Jobs and American Power Act (S. 1733), the American Clean Energy Leadership Act (S. 1462) and the CLEAR Act (S. 2877).
In our base model (1), we control for the binary indicator for independent generators. In models (2)–(6), we control for the amount of other fuels used in electricity generation. We add state fixed effects in model (3). We control for state-level energy policies – renewable portfolio standards, power sector deregulation and suspension of deregulation – in model (4). We control for the share of Republican House Representatives and the share of Republican Senators in model (5). Finally, we add regional dummy variables – Atlantic, Northeast, Northwest, Midwest and Southeast – in model (6) to control for unobserved regional differences.
Across all six models for each of the four bills, the results provide empirical support for our hypotheses. The amount of coal net generation does not obtain a conventional level of statistical significance in explaining the lobbying decision of electric utilities in any of the estimated models; moreover, the sign on the coefficient flips across models. The amounts of net generation from renewable energy and natural gas have a consistently positive association with the probability of lobbying on climate bills at conventional levels of statistical significance. This result shows that expected winners are more likely to engage in individual lobbying than other utilities.
We compare the performance of models based on the Akaike information criterion (AIC) (Akaike Reference Akaike1998). A smaller value of the AIC indicates a better model. We present the calculated AIC value for each model in Table 1. In explaining the utilities’ lobbying on the American Clean Energy and Security Act (H.R. 2454), model (2) appears to be the best among the six estimated models. This model includes the logarithmised values of coal net generation, renewable energy net generation and natural gas net generation, with an additional control variable for the logarithm of other energy net generation, as well as a binary indicator for independent utility. When we include additional controls or state fixed effects in models (3)–(6), the model fit becomes poorer, as indicated by the higher AIC values. This suggests that the additional control variables included in models (3)–(6) do not add much explanatory power for the lobbying behaviour of electric utilities.
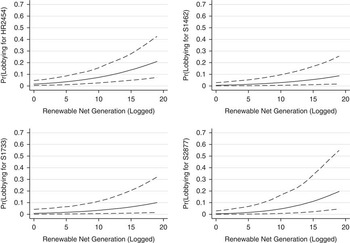
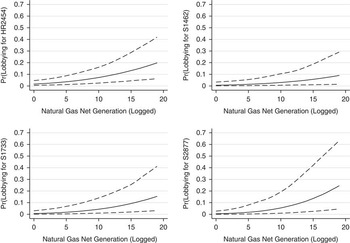
We assess the substantive effect of energy use in renewable and natural gas on the probability that an electric utility lobbies on a given climate bill. We calculate the probability that an electric utility with characteristics of the sample mean (or median for categorical variables) lobbies a given climate bill based on model (6), setting the regional indicator to Midwest. The results are based on 1,000 simulations. Figure 3 shows that the amount of renewable net generation has a positive effect on the probability of lobbying for all four climate bills. An electric utility with a mean level of renewable net generation is on average 3.7% likely to lobby on the American Clean Energy and Security Act, but 1 SD increase in renewable energy generation (from 4.7 to 10.1 in logarithmised amounts) raises the probability to 7.9%, more than doubling the probability to lobby. In regard to natural gas, Figure 4 shows that an increase of 1 SD from the mean level of power generation (from 4.6 to 10.4 in logarithmised amounts) raises the probability to lobby from 3.7 to 8.1%, again more than doubling the probability. The substantive effect appears more or less similar for the other climate bills.
Renewable energy net generation and probability of lobbying on climate bills.
Notes: We estimate the predicted probability based on model (6) in Table 1 and set all continuous variables at their mean values and other categorical variables at their median values. The region is set to Midwest and the utility type is set to independent utility. The calculation is based on 1,000 simulations using Clarify software (Tomz et al. 2003).

Natural gas net generation and probability of lobbying on climate bills.
Notes: We estimate the predicted probability based on model (6) in Table 1 and set all continuous variables at their mean values and other categorical variables at their median values. The region is set to Midwest and the utility type is set to independent utility. The calculation is based on 1,000 simulations using Clarify software (Tomz et al. 2003).

Given that electric utilities rely on multiple fuels, it is also worth looking at the lobbying behaviours of different types of electric utilities. Among the 1,655 electric utilities under examination, about half of them rely on only one type of fuel source. These utilities tend to be small in their net generation. They rarely lobbied on climate bills, probably because they have far fewer resources to spend on lobbying activities owing to their small size. This is consistent with the previous literature that shows that smaller interests in general do not individually lobby, as they lack the resources and the political power to influence outcomes (de Figueiredo and Richter Reference de Figueiredo and Richter2014).
None of the utilities relying only on coal sources lobbied on any of the four climate bills, and about 2% of utilities relying only on renewable sources or only on natural gas lobbied for the American Clean Energy and Security Act (H.R. 2454). This suggests the importance of the size of utilities in understanding their lobbying activities, yet also underscores the role of renewable energy use in increasing the probability of lobbying by utilities. Despite the relatively low baseline rates, the difference between renewable and coal generators is clear from the data.
It is also notable that 14% of coal generators that use either renewable energy sources or natural gas in combination with coal lobbied on the American Clean Energy and Security Act. Given that none of the coal generators that use only coal sources participated in the lobbying, this again shows that the use of renewable energy or natural gas was an important factor that motivated utilities to lobby individually. Utilities that use multiple fuels become more active as the importance of renewable energy and natural gas grow.
Qualitative evidence on lobbying: winners and losers
The above quantitative analysis provides detailed evidence on the determinants of individual lobbying. In this section, we provide case studies of collective lobbying and the specific goals of lobbying by major expected winners. This evidence provides insights into the causal mechanisms supporting the statistical associations characterised above.
Collective lobbying
If the primary opponents of federal climate policy in the power sector did not lobby the bills, what did they do instead? Based on anecdotal evidence, they certainly did not sit still and accept their fate. As we noted in the introduction, for example, ACCCE – a group of electric utilities expecting heavy losses from new climate legislation – was active in lobbying against the Waxman-Markey and related bills. This pattern is consistent with the idea that the expected losers largely focus on collective action to stop new climate legislation.
As expected, there is plenty of evidence for lobbying through associations. Beyond ACCCE, opponents of Waxman-Markey organised themselves under the US Chamber of Commerce, which called the Waxman-Markey approach of a cap on greenhouse gas emissions a “terrible option” for the US.Footnote 16 According to our data, the group spent a total of USD 145 million on lobbying in 2009 alone. Although we cannot separate between climate and other bills, the Chamber took an openly hostile stance against H.R. 2454, “strongly” urging Congressmen to reject it.Footnote 17
To summarise, the behaviour of expected losers accords with the analytical logic posited above. If the opponents were fundamentally interested in stopping or weakening climate legislation, individual action would be much less effective than collective action. Although winners both engage in collective action to support legislation and lobby individually to secure rents in the event of a new policy, losers join forces to stop the adoption of federal climate policy. Although we do not have enough data to test hypotheses on the behaviour of trade associations on climate legislation in the 111th Congress, the examples provided above show that joint lobbying by opponents of climate legislation was common at the time.
To be sure, we are not arguing that the winners did not engage in any collective lobbying. We do not claim that individual lobbying is a weak substitute for collective action, as the Olson (Reference Olson1965) prediction is that the alternative to collective action is no action at all. The expected winners lobby individually because they want to promote their individual interests, not because they are incapable of collective action. The evidence clearly shows that the expected winners also engaged in collective lobbying. During the 2009–2010 period, the American Wind Energy Association spent USD 10.8 million in lobbying, and all lobbying disclosure reports by the association specifically mentioned the Waxman-Markey bill as one of their key targets. The Renewable Fuels Association lobbied with USD 1.3 million, whereas the American Gas Association spent USD 2.2 million on lobbying activities. The Solar Industries Association spent USD 2.4 million. All these groups expected clear benefits from the Waxman-Markey bill, and while their individual members lobbied on their own, the associations also engaged in collective lobbying through standard channels.
Goals of winners and losers
Expected winners and losers had different goals in regard to climate legislation. On the American Clean Energy and Security Act of 2009, for instance, renewable energy producers, expected winners as we identified above, expressed support for the bill, whereas expected losers, mostly coal producers, showed a strong opposition to the bill as described above. It was not the case, however, that expected winners merely showed support for the bill. In fact, both renewable energy and natural gas users had several specific requests that they wanted to be included in the bill.
Exelon, one of America’s largest utilities, has made major investments in renewable energy and also distributes natural gas to customers. On 15 May 2009, the company’s Chief Executive Officer, John W. Rowe, gave a speech on the Waxman-Markey legislation. In addition to offering his strong endorsement, he outlined a few specific goals that Exelon had in the legislative process, reiterating “Exelon’s longstanding position that a large percentage of allowances be given to local utilities so they can sell them and use the proceeds for rebates, low-income assistance, energy efficiency and other measures to help customers most affected by energy prices” (Exelon 2009). He also noted that “a renewable portfolio standard is a down payment toward a sound climate policy but is not enough” (Exelon 2009). For a company with major renewable energy investments, a natural gas distribution network and a large pool of more than five million customers, these policies would furnish direct benefits both in terms of profitability and public relations.
Another major electric utility, PSE&G, based in New Jersey, also supported Waxman-Markey. Having made large recent investments in renewable energy, the company had a specific interest in a federal renewable portfolio standard. In a February 2009 testimony to the House Committee on Energy and Commerce, Subcommittee on Energy and Environment, Chief Executive Officer Ralph Izzo emphasised that a cap-and-trade system would not be enough, as “effectively combating global warming will require a comprehensive package of policy solutions … a federal [renewable electricity standard] will create demand for technologies that will transform the way we generate electricity” (Izzo Reference Izzo2009). Although the standard economic approach to carbon abatement suggests that a cap-and-trade system is the most cost-effective approach to carbon abatement, Izzo was arguing for complementary policies that would enhance the profitability of renewable energy.
Until it merged with Duke Energy in 2012, a third company, Progress Energy, was a major user of natural gas. In a public statement made on 18 May 2009, Chief Executive Officer Bill Johnson emphasised that the utility supported Waxman-Markey and emphasised that, whereas “the bill being debated has improved markedly … we must all understand that reducing carbon emissions will increase energy costs for all energy users in the future. We will continue to support positive changes that achieve emissions reductions while preserving our ability to provide reliable and affordable electricity to homes and businesses” (Progress Energy 2009). The press release containing this statement emphasised that Progress Energy was pursuing a “balanced strategy” including energy efficiency, renewables and an improved electricity system (Progress Energy 2009). Of course, Progress Energy was also a nuclear energy generator with plans to expand.
Conclusion
This article has evaluated the lobbying behaviour of individual electric utilities with respect to four major climate bills in the 111th Congress, 2009–2010. The analysis combines lobbying disclosure and fuel choice data for all electric utilities in the US, including independent power producers. This unique data set allows us to examine the individual lobbying choices of the power sector, which is responsible for four-tenths of all energy-related carbon dioxide emissions in the US, in great detail filling an important gap in the existing literature.
The empirical analysis uncovers a large difference between the expected winners and losers from climate policy. Although high electricity generation from coal, which would make climate policy costly to an electric utility, does not predict individual lobbying, high electricity generation from renewable energy or natural gas does. These two fuels are among the expected winners from federal climate policy and, thus, have an incentive to lobby for specific provisions that maximise their gains. A qualitative analysis shows that the expected losers, while shying away from individual lobbying, acted collectively to undermine the progress of climate legislation through political channels in the Congress. This is consistent with the notion that expected winners lobbied because they wanted to secure specific concessions in case new climate policy would be formulated, whereas expected losers focused on the collective good – from their perspective – of preventing new legislation from coming into being.
Our results motivate various extensions in future research. Collecting appropriate data, a future extension of our research would focus on the effects of individual lobbying on the legislative process and final provisions of various climate bills. This extension would focus on the effects, as opposed to causes, of lobbying. To better understand utility incentives to lobby, another extension would focus on measuring the size threshold above which utilities become active in lobbying. Such an extension would provide useful insights into the expected benefits from lobbying for individual firms.
The behaviour of expected winners is also important for evaluating the prospects of federal climate legislation in the future. On the one hand, individual lobbying by expected winners promises some hope for the supporters of more ambitious action at the federal level, as individual lobbying would not make a lot of sense if the expected winners think the legislation is hopeless. On the other, individual lobbying may divert attention from collective action that would improve the odds of the enactment of new climate legislation. In this regard, the practice of individual lobbying could undermine the development of new climate legislation. Moreover, individual lobbying could undermine the substantive effectiveness of climate legislation by increasing the number of “pork barrel” (Ferejohn Reference Ferejohn1974) provisions that generate targeted benefits to specific constituencies at the expense of the general public. The common practice of individual lobbying could be a dysfunctional feature of the political system.
Acknowledgements
The authors are grateful to Kyle Meng for his advice on data collection for this project and comments on a previous draft. The authors also thank Miranda Yaver and the audience at the 2014 IPES Conference for their comments on an earlier draft.
Supplementary material
To view supplementary material for this article, please visit http://dx.doi.org/10.1017/S0143814X15000033.