INTRODUCTION
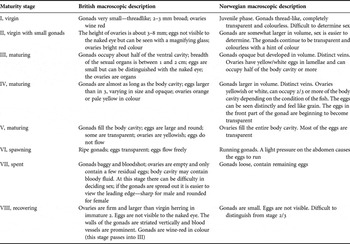
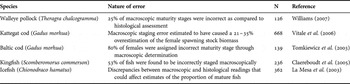
The maturation process is most often described through routine macroscopic assessment of the gonad using a maturity scale based on the appearance of the gonad when observed with the naked eye (e.g. Table 1). Macroscopic staging is the quickest method for assigning maturity status and is therefore routinely used, particularly at sea. High accuracy of macroscopic maturity staging is critical for drawing correct inferences about the magnitude of the spawning stock biomass (SSB), size and age at maturity and length of the spawning season (Carrassón & Bau, Reference Carrassón and Bau2003). However, it can be highly subjective and involves intensive training (West, Reference West1990) which may or may not be given to personnel working in the field. Due to these constraints, the reliability of macroscopic staging has been questioned by a number of studies (McQuinn, Reference McQuinn1989; West, Reference West1990; Saborido-Rey & Junquera, Reference Saborido-Rey and Junquera1998; Bromley, Reference Bromley2003; Hunter & Macewicz, Reference Hunter and Macewicz2003; La Mesa et al., Reference La Mesa, Caputo, Rampa and Vacchi2003). Very few studies have tested the accuracy of macroscopic staging against relatively unambiguous microscopic assessments of maturity stage. Without this verification, macroscopic staging should be regarded as potentially unreliable (Bromley, Reference Bromley2003). The few studies that have been carried out comparing histological and macroscopic assessments have often found that the error, or percentage of fish incorrectly staged, is high (Table 2). Systematic errors between virgin and adult fish are of particular concern as they can lead to consistent over- or under-estimation of the spawning stock biomass (SSB).
British and Norwegian scales for macroscopic maturity staging Atlantic herring (Clupea harengus). These macroscopic scales are both based on the staging scale from Bowers & Holliday (Reference Bowers and Holliday1961).

Studies of error in routinely used macroscopic maturity staging methods for different species. Macroscopic maturity staging was compared to histological maturity staging for all studies.

N, sample size.
Histology is the most accurate method for determining the maturity stage of fish (West, Reference West1990). Histological staging involves studying structures within oocytes or testes and so gives an unambiguous interpretation of maturity status (West, Reference West1990; Vitale et al., Reference Vitale, Svedäng and Cardinale2006). Bowers & Holliday (Reference Bowers and Holliday1961) used histology to modify the Lea macroscopic maturity staging scale for Atlantic herring (Clupea harengus) (Lea, Reference Lea1910). This was to ensure that macroscopic stages accurately reflected changes in gonad development as described by microscopic evaluations. Very little histological work has been undertaken on Atlantic herring since this study was carried out in 1961. Furthermore, no studies have been carried out to estimate the incongruities between macroscopic and microscopic staging techniques. This is most likely due to the labour-intensive, expensive and time consuming nature of histology (West, Reference West1990; Tomkiewicz et al., Reference Tomkiewicz, Tybjerg and Jespersen2003).
Due to the impracticalities and costs of histological maturity staging, it has been suggested by Vitale et al. (2006) that proxies should be used in an attempt to make macroscopic staging more accurate. One potential proxy of maturity stage may be the gonadosomatic index (GSI), which is the weight of the gonad expressed as a percentage of the total weight or somatic weight of the fish. GSI is known to increase throughout gonadal development (Potoschi et al., Reference Potoschi, Renones and Cannizzaro1999) and so a model using GSI may be able to accurately describe maturity stages. As whole weight and gonad weight are quick and easy to measure this method would be less laborious than histological staging. This method has been employed by McQuinn (Reference McQuinn1989) who created a GSI model which was able to successfully separate spring- and autumn-spawning north-western Atlantic herring. However, the use of GSI as a proxy has been criticized, in part because GSI can be correlated with fish size in some species (DeVlamming et al., Reference DeVlamming, Grossman and Chapman1982; Erickson et al., Reference Erickson, Hightower and Grossman1985; West, Reference West1990). However, if GSI is not related to fish size it could potentially be used to correct macroscopic maturity staging if the accuracy of the staging is not satisfactory.
The aim of this study was to assess the accuracy of macroscopic maturity staging of female North Sea herring. Macroscopic maturity stages from research vessels and commercial catches were compared to histological maturity stages to quantify the percentage of incorrectly staged fish, termed here as the total error. The percentage agreement between macroscopic and microscopic assessments after chance agreement has been removed was then calculated. Finally, GSI cut-off points that could be used to separate immature and mature-active fish and mature-inactive and mature-active fish were derived by means of multinomial regression models and their use was validated using fish that had been histologically staged. The potential for systematic over- or under-estimation of SSB due to incorrect maturity staging and the use of GSI to correct any errors was then considered.
MATERIALS AND METHODS
Sampling at sea
Female North Sea herring were collected during the North Sea Herring Acoustic Survey (HERAS) in 2006 and 2007. Samples were collected on-board FRV ‘Scotia’ (UK) from 1–21 July 2006 and 29 June–19 July 2007 and RV ‘Johan Hjort’ (Norway) from 21 June–19 July in 2007. All fish obtained at sea were sampled immediately after capture. Mid-water trawl nets were used and, in some cases on the FRV ‘Scotia’, a multi-sampler was employed which has three cod-ends that can be opened and closed remotely and independently. On-board FRV ‘Scotia’, for each fish total wet weight, gutted weight (gonad, stomach and viscera removed) (to the nearest 1g) and gonad wet weight (to the nearest 0.1g) were measured. For each fish sampled on-board RV ‘Johan Hjort’ total wet weight (to the nearest 1g) was measured. On-board both ships, the trained technician sexed each fish and categorized them into macroscopic maturity stages using two eight-point scales based on the gross appearance of the gonads (Table 1). The scales of the two nations are very similar and should be interchangeable. It should be noted that the technician that assigned maturity stages on-board FRV ‘Scotia’ in 2006 was different from the two technicians that assigned maturity stages on-board FRV ‘Scotia’ and from market samples in 2007. It is normal to have several technicians assigning maturity stages within and across surveys and so this can be considered as a random source of background error.
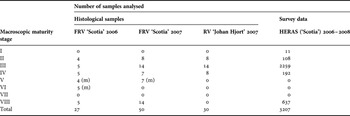
In 2006 up to five ovary samples of each maturity stage were taken for histological analysis. In 2007 up to 14 ovary samples of each maturity stage were taken (Table 3). A small section (between 0.5 and 1.5 cm2) was removed from the central portion of each gonad and was immediately fixed in 40% formalin. It was not possible to obtain samples from all maturity stages due to restrictions in time and location during surveys. However, the stages collected are representative of the stages that are routinely sampled on-board FRV ‘Scotia’ and RV ‘Johan Hjort’ during HERAS.
Sample sizes by macroscopic maturity stage on the three cruises (FRV ‘Scotia’ 2006, FRV ‘Scotia’ 2007 and RV ‘Johan Hjort’ 2007) and from the Scottish Herring Acoustic Survey (HERAS) data. Samples were staged and sexed by experienced technicians on-board. Samples for histological analysis were chosen at random. Market samples were obtained from Marine Scotland, Aberdeen. The full survey data from the Scottish HERAS was also obtained from Marine Scotland.

(m), market samples.
Market sampling
As not all maturity stages were observed during the survey cruises, it was necessary to sample fish from commercial fishing vessels. Commercial samples were obtained by the Marine Scotland, Aberdeen in August 2006 and 2007 from day-trips. These fish were caught by commercial trawl and placed on ice until sampling. All fish were sampled within 24 hours of capture at the Marine Scotland. Biological information was obtained in the same way as on FRV ‘Scotia’ and, again, a trained technician assigned sex and maturity stage as part of routine sampling. Gonad samples were removed and fixed using the same method as on-board the vessels. It was not possible to collect market samples from Norway (see Table 3 for market sample sizes for each maturity stage and year).
Histological slide preparation and staging
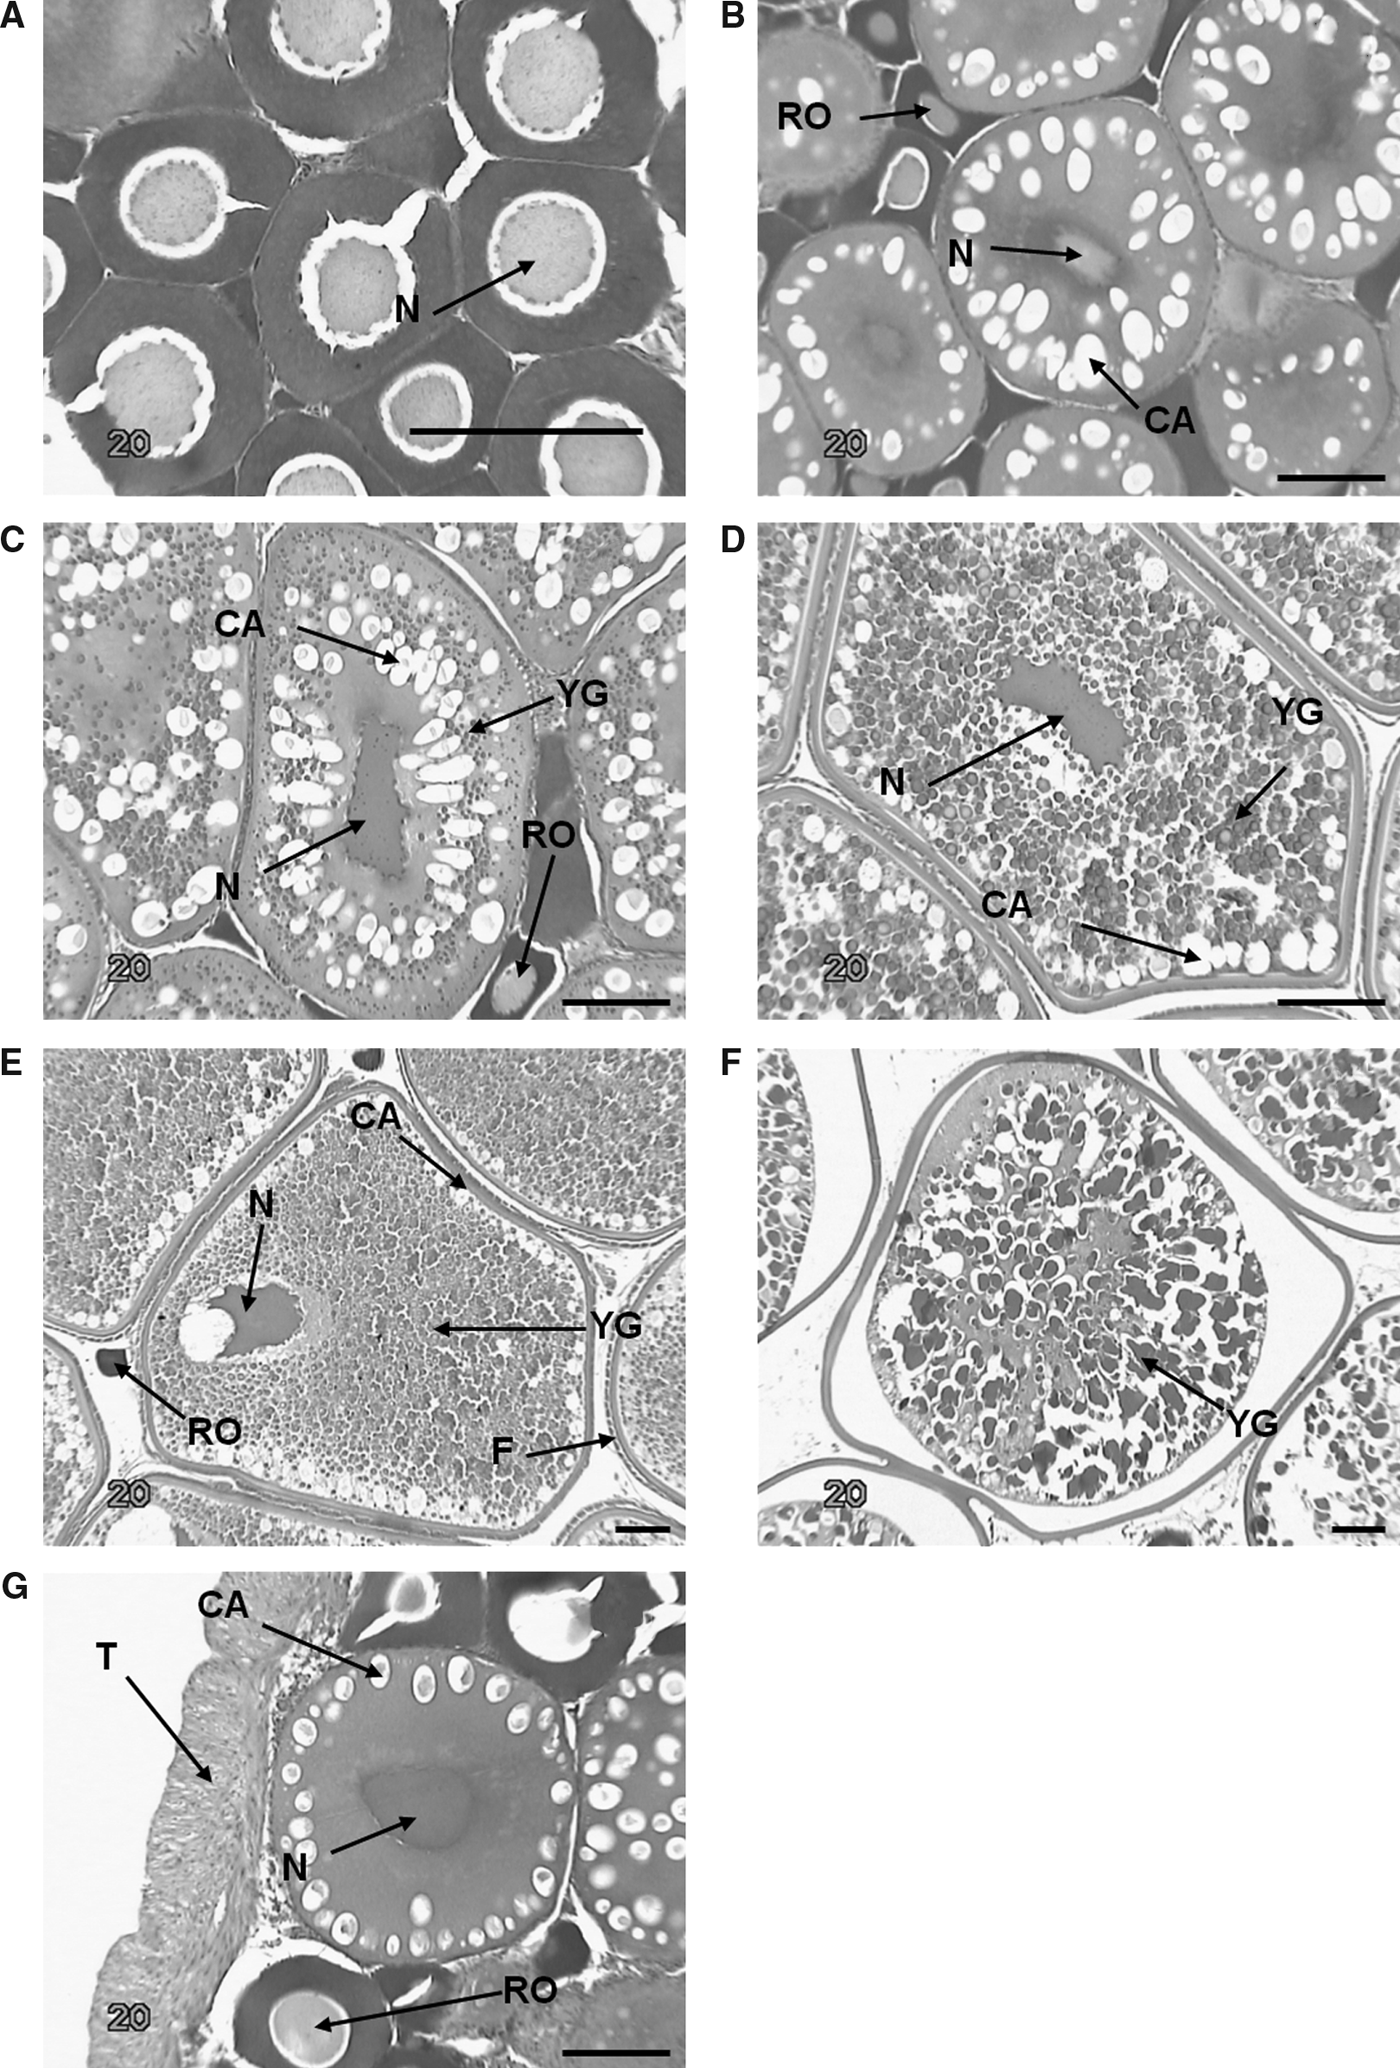
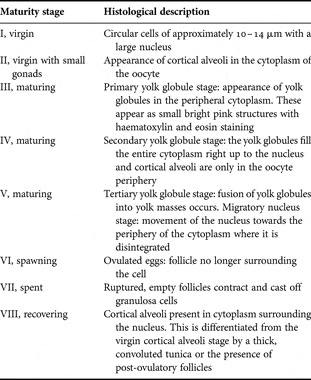
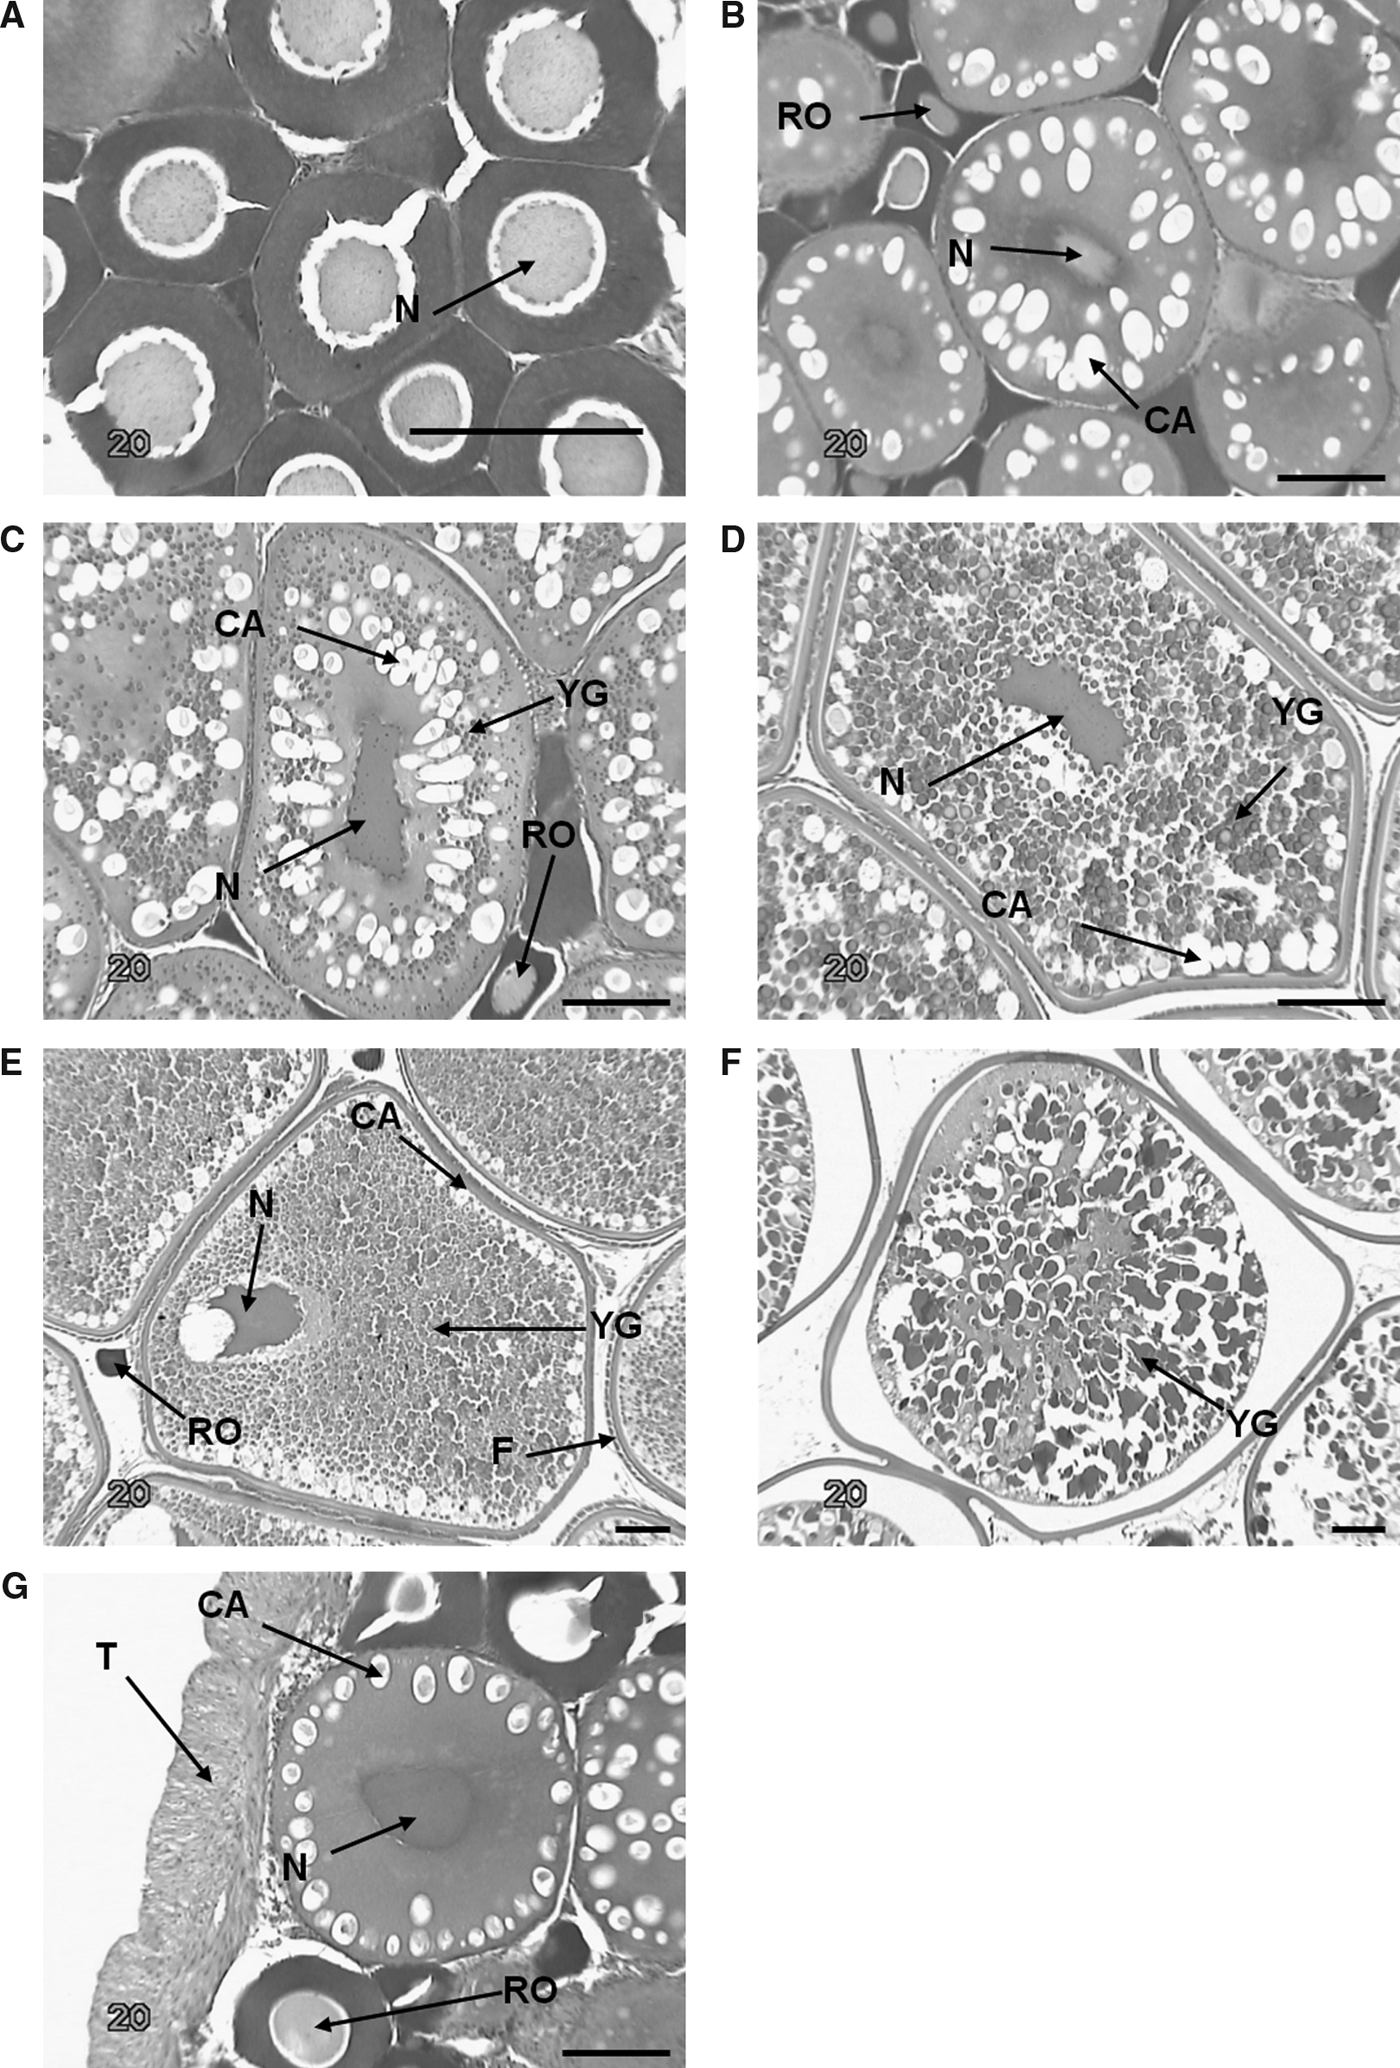
All samples were processed in the Histology and Electron Microscopy Core Facility of the Institute of Medical Sciences (IMS), Aberdeen University. Altogether, 107 wax histological slides were created (Table 3). Gonad samples were transferred to 70% ethanol and left overnight in 95% ethanol before dissecting to block size to prevent tissue damage from trimming. After trimming, samples were embedded in wax, sectioned at 5 µm and stained with haematoxylin and eosin. Histological maturity staging was carried out based on work by Bowers & Holliday (Reference Bowers and Holliday1961), Landry & McQuinn (Reference Landry and McQuinn1988), Tyler & Sumpter (Reference Tyler and Sumpter1996) and Koya et al. (Reference Koya, Soyano, Yamamoto, Obana and Matsubara2003) (see Table 4 and Figure 1 for histological staging scheme).
Micrographs of sections (5 µm) of Atlantic herring (Clupea harengus) ovaries at different stages of development. Stain, haematoxylin and eosin. (A) peri-nucleolus stage (stage I); (B) cortical alveolus stage for virgin herring (stage II); (C) primary yolk globule stage (stage III); (D) secondary yolk globule stage (stage IV); (E) migratory nucleus stage (stage V); (F) ovulated egg (stage VI); (G) cortical alveolus stage for recovering herring (stage VIII). N, nucleus; CA, cortical alveoli; RO, resting oocyte; YG, yolk granules; F, follicle; T, tunica. Scale bars = 100 µm (B, C, D, E, F & G); 20 µm (A).
Histological scale for maturity staging of Atlantic herring (Clupea harengus). This scale is based on work by Bowers & Holliday (Reference Bowers and Holliday1961), Landry & McQuinn (Reference Landry and McQuinn1988), Tyler & Sumpter (Reference Tyler and Sumpter1996) and Koya et al. (Reference Koya, Soyano, Yamamoto, Obana and Matsubara2003).

Analysis of error
The percentage of fish incorrectly staged for each maturity stage was calculated and this was termed the stage-specific error. Total error is the percentage of fish incorrectly staged across all maturity stages. Cohen's (Reference Cohen1960) coefficient of agreement kappa (κ) was also calculated for each vessel in each year in order to determine the proportion of agreement once chance agreement had been taken into consideration. It should be noted that κ gives the proportion agreement and this is, therefore, the opposite of the proportion error. κ is given by:
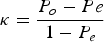
where P o is the observed proportion of agreement and P e is the expected proportion of agreement by chance. P e is given by:
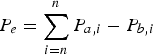
where P a,i is the proportion of the sample macroscopically attributed to category i and P b,i is the proportion of the sample attributed to category i histologically. A κ value of 1 indicates complete agreement whereas a κ value of –1 indicates complete disagreement. A κ value of 0 indicates that all agreement is due to chance.
Re-estimation of spawning stock biomass
The SSB is calculated as the estimated total number of fish (N) multiplied by the mean weight at age (W a) and the proportion of fish mature at age (M a). Data on N, W a and M a estimated from the HERAS surveys in July 2007 were taken from Table 2.3.1.2. of the 2008 Herring Assessment Working Group report (ICES, 2008). Data on the macroscopic maturing staging error was not available by age. Therefore the M a was then recalculated for each age using the total error observed between immature and mature fish (including stage VIII) in 2007, i.e. the error applied was the same for every age-class. It should be noted that this assumes that the maturity staging error is equivalent for females and males. The SSB was calculated with the published M a and then again with the re-estimated M a to estimate the difference in the SSB caused by maturity staging errors. The SSB was not re-calculated for 2006 as there were no macroscopic maturity staging errors that would lead to incorrect estimation of M a in that year (see Results section).
Validation of GSI
The GSI (%) was estimated as the gonad weight (W go) divided by the gutted weight (W gt), and multiplied by 100. In order to assess if GSI could be used as a predictor of maturity we first needed to validate its use, i.e. test whether GSI is affected by fish size. To do so, the nature of the relationship between the W gt and W go for each maturity stage was analysed. In order to have a larger sample size for this, the dataset containing all females that were routinely sampled on FRV ‘Scotia’ during HERAS in 2006 and 2007 was used (N = 3207; Table 3). Analysis using the HERAS dataset only took into account stages I, II, III, IV and VIII since all other stages (i.e. V, VI and VII) were not recorded. For this analysis, immature fish (stages I and II) were amalgamated into one class as there were relatively few samples in these stages and both stages are assumed not to have potential to mature in the SSB estimation.
The relationship between W gt and W go in the i th maturity stage is described by the formula (DeVlamming et al., Reference DeVlamming, Grossman and Chapman1982):
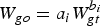
For the GSI to be valid, the slope b i of the relationships should not be different among maturity stages and isometry should be apparent (i.e. b i = 1) (DeVlamming et al., Reference DeVlamming, Grossman and Chapman1982; Erickson et al., Reference Erickson, Hightower and Grossman1985; Somarakis et al., Reference Somarakis, Ganias, Tserpes and Koutsikopoulos2004). We estimated a i and b i on a logarithmic scale in order to use linear modelling techniques:

In order to test for a difference between slopes, an analysis of covariance (ANCOVA) was carried out using the HERAS dataset. This ANCOVA had logW gt as the dependent variable and logW go, maturity stage and the interaction between logW go and maturity stage as the explanatory variables. If the interaction between logW go and maturity stage was significant, then the slopes between different maturity stages were significantly different. In order to compare the slopes of all maturity stages, the ANCOVA was carried out multiple times with different maturity stages as the base comparison to ensure that comparisons between all stages were made.
We then tested for isometry by comparing coefficient b i in each maturity stage with unity by means of a t-test. In the case of isometry the GSI would be equal to a i and thus independent of female weight. As maturity stage IV had the lowest stage-specific error (see Results section), we tested for isometry in the above relationship (Equation 4) mainly using this stage.
Estimation of GSI cut-off scores
Multinomial logistic regression (MLR) was subsequently used to distinguish between immature (stages I and II), mature-active (stages III and IV) and recovering (stage VIII) classes through calculating multiple cut-off GSI scores between the different maturity classes again using the HERAS dataset. This kind of analysis was judged as preferable to using separate binary logistic regression models because in the MLR models, the likelihood function utilizes the data involving all categorical variables in a single function. Mature-active fish were designated as the reference category and each of the other categories (immature and recovering) were compared with this baseline.
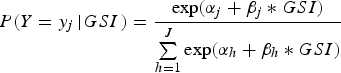
The predicted conditional probability of being in the y i maturity class using GSI as the single predictor variable is given by the formula:
j = 1,2… .J
where α j and β j are the intercept and the slope respectively corresponding to GSI. The parameters corresponding to the reference category are equal to zero.
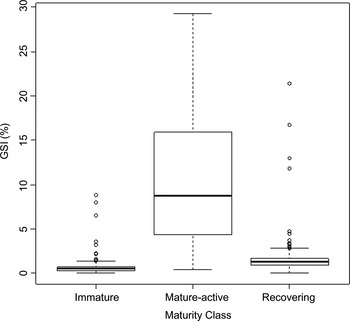
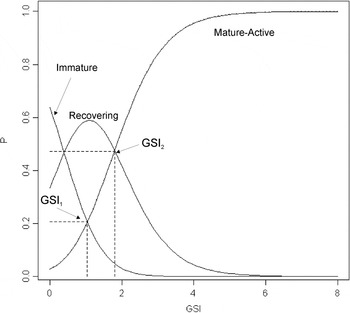
A cut-off GSI score can be defined as the test score at which an individual is as likely to be in category j as in category j + 1. GSI is increasing as fish pass from immature to the mature-active state but decreases as fish pass from the mature-active to the recovering state (Figure 2). In that respect, the cut-off scores could not be estimated by splitting the predictor (GSI) in the ordered categories that correspond to the intersection of the adjacent curves (immature and recovering and recovering with mature-active). As a consequence, GSI1 and GSI2 were estimated as the test scores that correspond to the intersection of the immature and recovering curves to the mature-active curve respectively, using the formula:

Relationship between maturity status (immature, stages I–II; mature-active, stages III–IV; recovering, stage VIII) and gonadosomatic index for Atlantic herring (Clupea harengus) during the Scottish Herring Acoustic Survey (HERAS) in June/July 2006–2009.

In order to test if these GSI cut-off values were valid, the GSI of females that had been histologically assessed (i.e. with accurate maturity stages) were examined to see if the maturity stages and GSI corresponded to the estimated cut-off values. All statistical analyses were carried out using the R statistical software version 2.9.2. (R Development Core Team, 2009).
RESULTS
Accuracy of macroscopic assessments
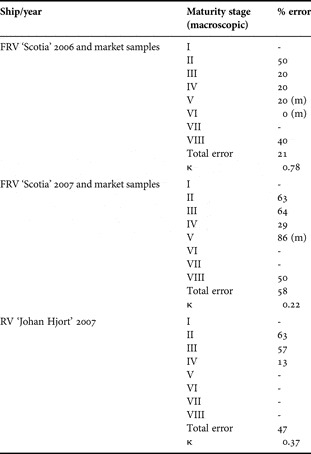
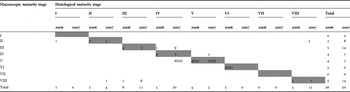
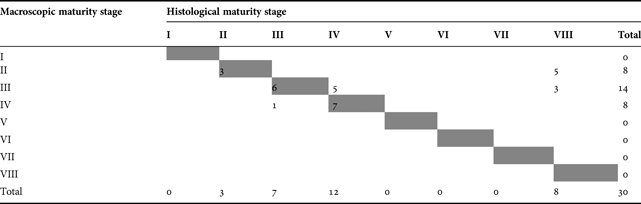
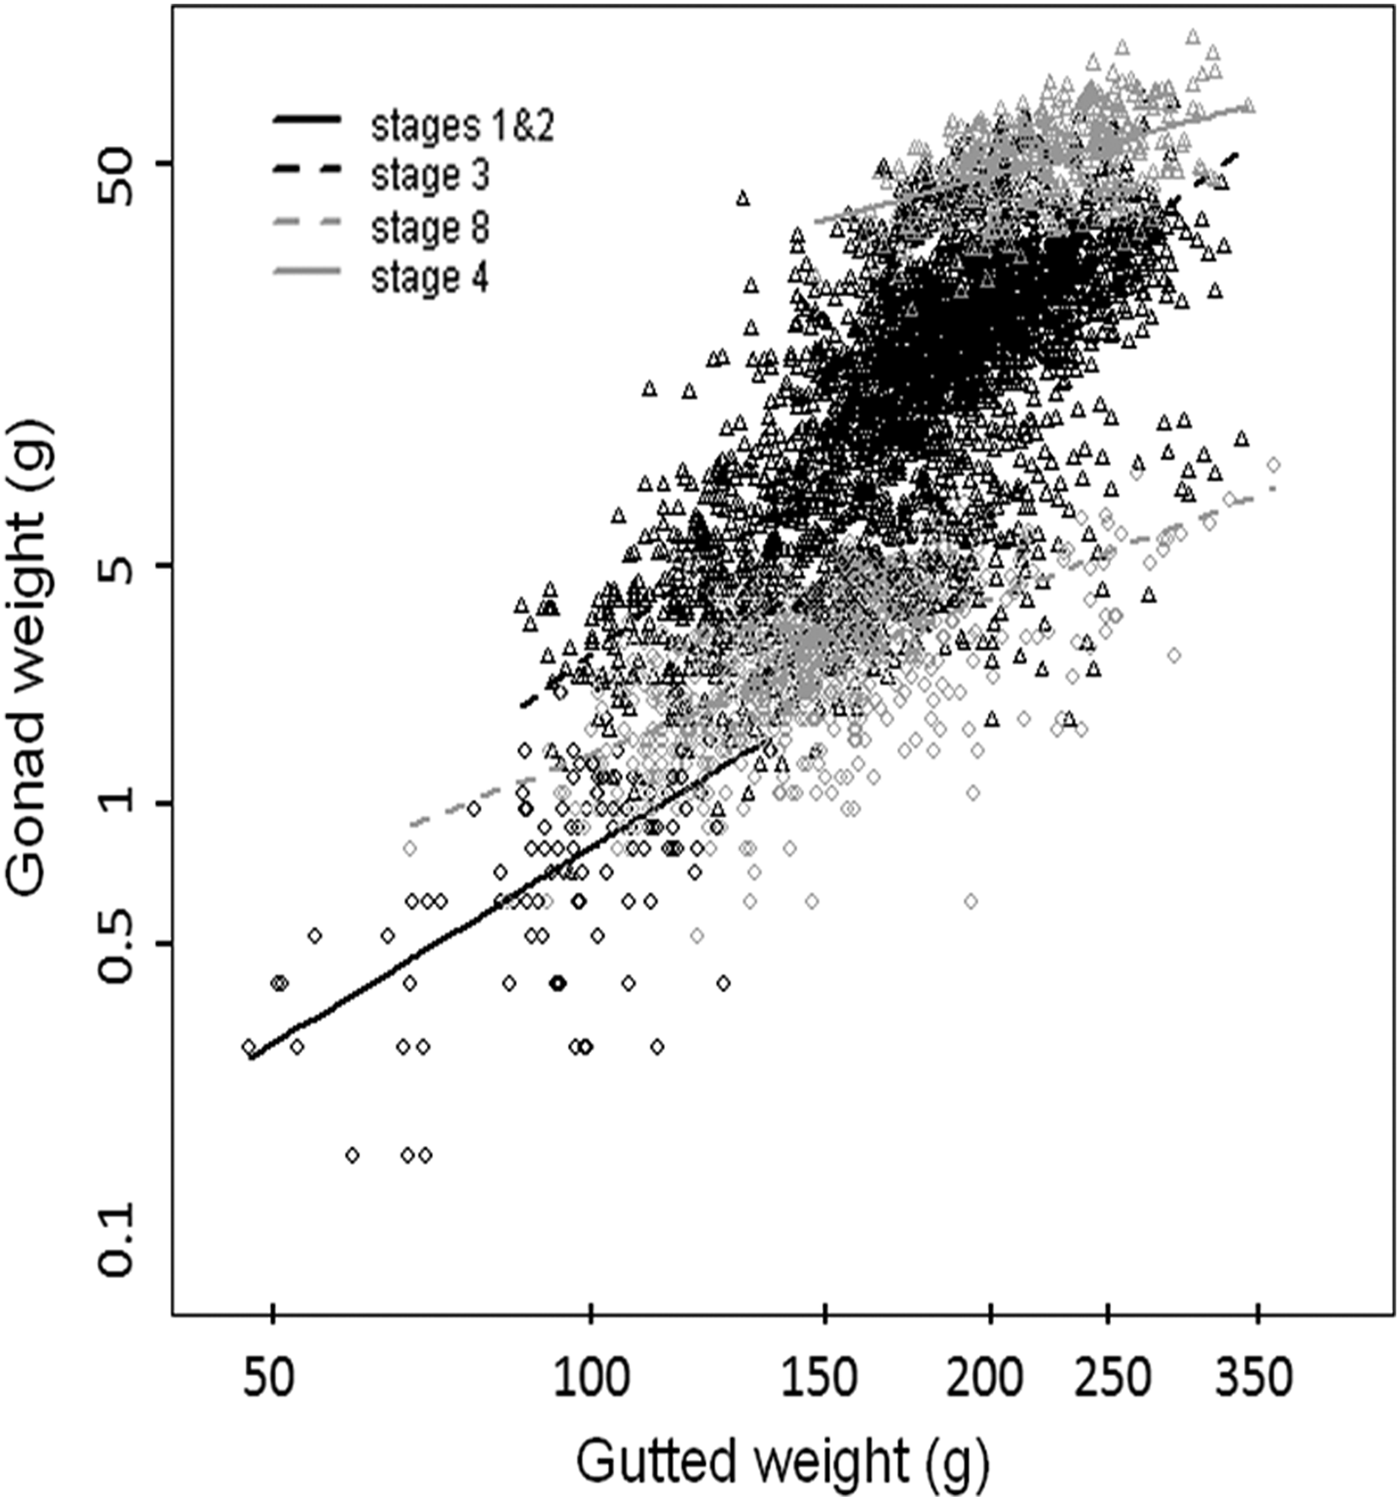
Macroscopic maturity assessments differed in accuracy both between ships and years. On-board FRV ‘Scotia’ and from market samples in 2006 the total error was 21% (Table 5). In 2006 all stage-specific errors apart from one were due to macroscopic assessments being less mature than they were (Table 6). In 2006, the κ value was 0.78 and there was no disagreement between virgin fish (stages I and II) and adults (stages III–VIII) (Table 6). However, it should be noted that one fish that was macroscopically assessed to be female stage II was, in fact, a male. The total error was much higher on-board FRV ‘Scotia’ and in market samples in 2007 at 58% (Table 5). There was much confusion in assignments of maturity stage between stages VIII and III (Table 6), so fish assigned as recovering individuals were actually maturing. One individual that was classified as a repeat spawner (stage VIII) was a juvenile (stage II). The total error reduced to 49% if market samples were not included in the calculation. This was due to a total error of 86% in market sample maturity staging in 2007. The κ value calculated for all samples on-board FRV ‘Scotia’ and market samples was 0.22. Some errors that were found in macroscopic maturity staging on FRV ‘Scotia’ could be clearly seen in a simple scatterplot of gutted weight versus gonad weight from the years 2006–2009 (Figure 2).
Stage-specific error, total error and Cohen's κ (kappa) for North Sea herring on all three acoustic survey cruises. % error is the percentage of fish that were incorrectly staged (stage-specific error). Total error is the total percentage of all fish of all stages that were incorrectly staged and κ (kappa) values show the proportion agreement between macroscopic and histological staging after chance agreement is removed. Market samples were obtained from Marine Scotland, Aberdeen.

(m), market samples; κ, Cohen's coefficient kappa; -, no samples obtained.
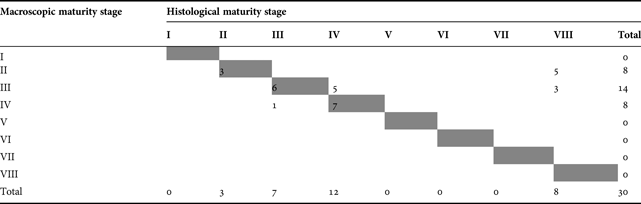
Histological versus macroscopic maturity stage determination of female North Sea herring sampled on-board FRV ‘Scotia’ in 2006 and 2007, from market samples assessed at Marine Scotland in 2006 and 2007. The values outside of the shaded cells represent misidentification in macroscopic evaluation.

(m), market samples.
On RV ‘Johan Hjort’ in 2007 there was a total error of 47% (Table 5). The largest stage-specific error on RV ‘Johan Hjort’ was that 63% of stage II ovaries were actually stage VIII (Tables 7). 57% of macroscopic stage III's were incorrectly staged. This stage-specific error for stage III's went in both directions with 35% actually being more mature (stage IV) and 21% actually being less mature (stage VIII) suggesting that the error on-board RV ‘Johan Hjort’ is non-directional (Table 7). The κ value for maturity staging on-board RV ‘Johan Hjort’ in 2007 was 0.37.
Histological versus macroscopic maturity stage determination of female North Sea herring sampled on-board ‘RV Johan Hjort’ in 2007. The values outside of the shaded cells represent misidentification in macroscopic evaluation.
Re-estimation of spawning stock biomass
Firstly, it should be noted that there was no error in the distinguishing between immature and mature (both active and inactive) fish in 2006 and so the SSB was not re-calculated as there would be no change. The SSB was estimated from the July 2007 data taken from ICES (2008) to be 1.18 million tonnes with the published M a and 1.50 million tonnes with the recalculated M a incorporating maturing staging error. Therefore, macroscopic maturing staging error led to an under-estimation of the SSB of 27%. With data from only two years it is not possible to know if this is a random or systematic error. However, any inter-annual variation in staging error could be caused by the differences in accuracy between individual technicians.
Gonadosomatic index model
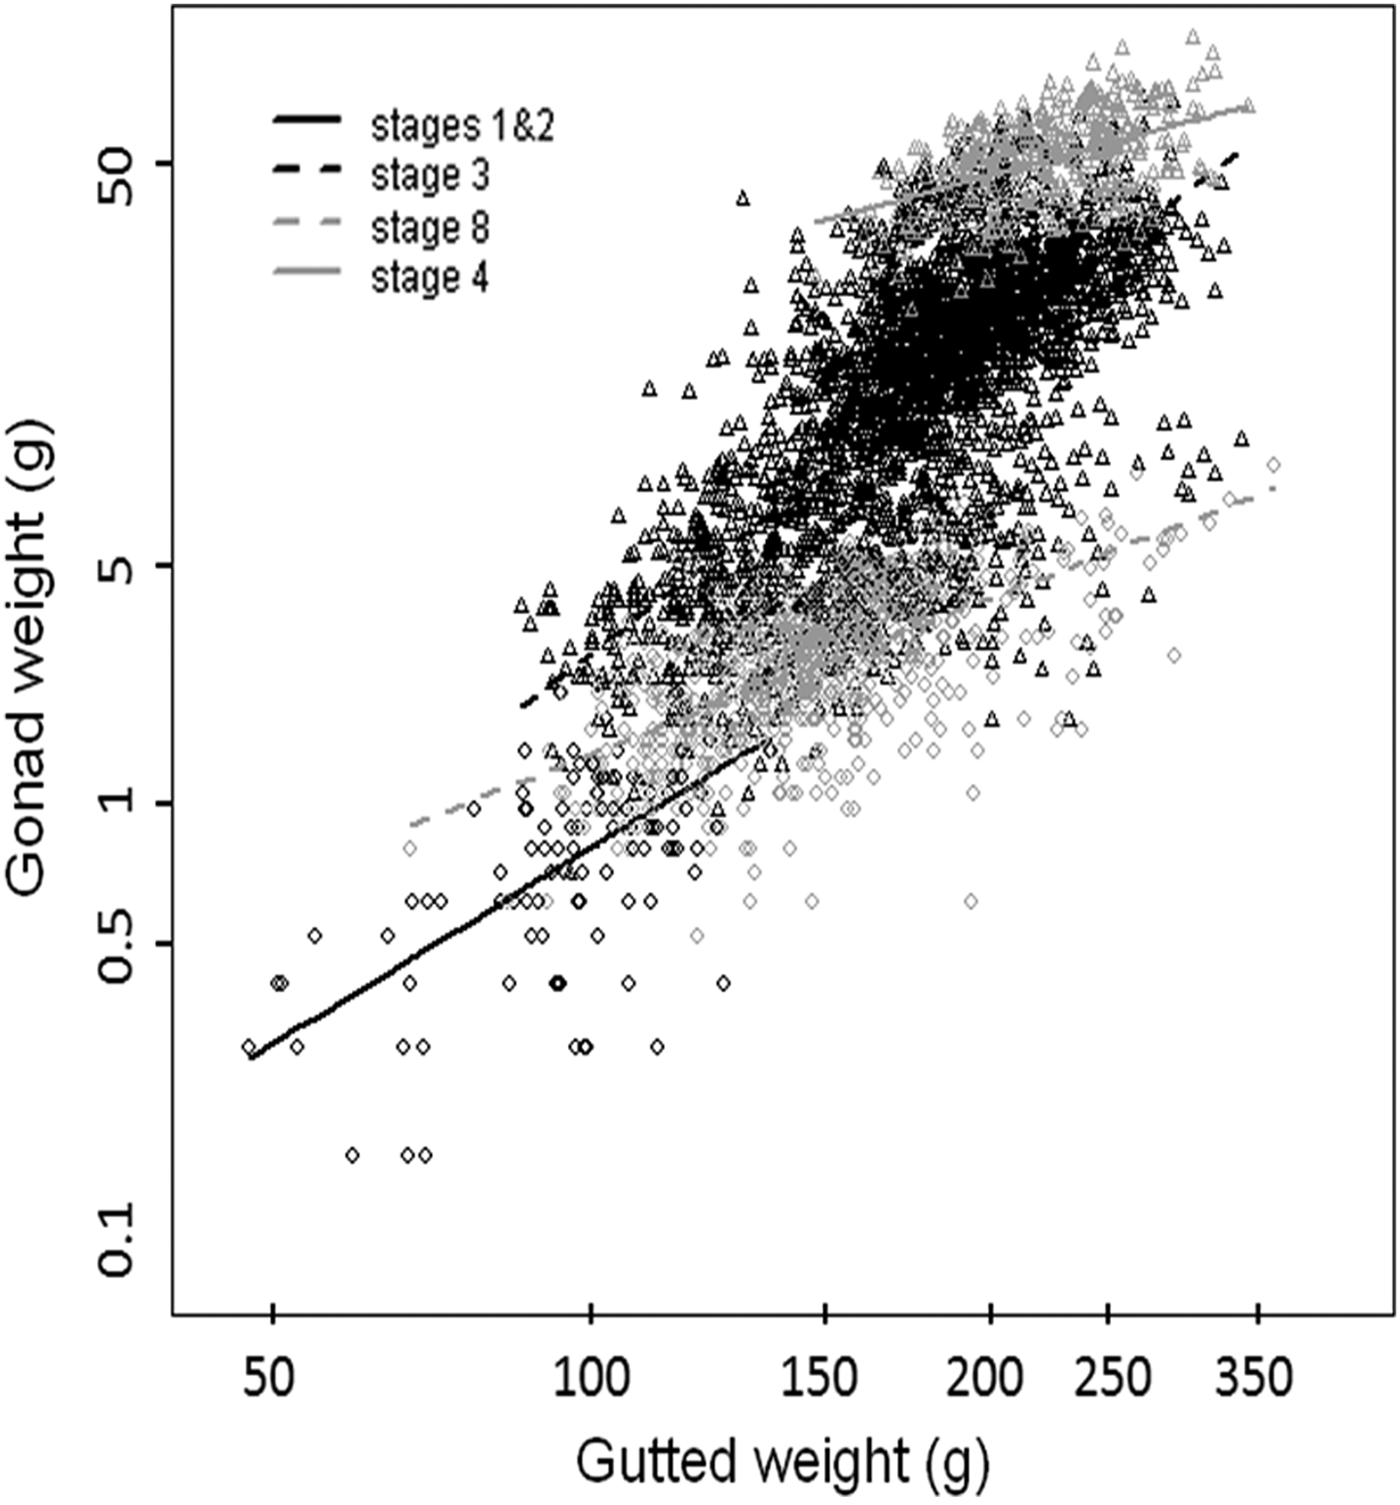
For differences in GSI between immature, mature-active and resting/recovering individuals see Figure 2. The ANCOVA results showed that there was no significant difference in the slope of the relationship between logW gt and logW go between stages II and III (ANCOVA, P = 0.7) or between stages IV and VIII (ANCOVA, P = 0.1). However, all other stage combinations displayed significant differences in their slopes (ANCOVA, P < 0.05) (Figure 3). As the staging accuracy was highest for stage IV fish on FRV ‘Scotia’ (Table 5), a linear model was fitted for just stage IV samples to test for isometry (linear regression, r2 = 0.2, P < 0.05, N = 192). The slope of the relationship between logW gt and logW go for stage IV fish was not significantly different from unity (t-test, P = 0.44, estimate = 0.93, SE = 0.09) suggesting that the relationship is isometric. Therefore, the use of GSI to predict maturity stage would not be biased by fish size.
Relationship between log gutted weight and log gonad weight for all stages present in the Atlantic herring (Clupea harengus) during the Scottish Herring Acoustic Survey (HERAS). Data are from the HERAS survey June/July 2006–2009. Lines represent simple linear models. Black circles, immature (stages I & II); black triangles, stage III; grey triangles, stage IV; grey circles, stage VIII.
The output of the MLR model for estimating GSI cut-off scores is illustrated in Figure 4. The lines in Figure 4 represent the probability of being in each maturity class at a given GSI value. The goodness of fit of the MLR model was analysed using the likelihood ratio test, G = D 0–Dm, where D m = 1355.8 is the residual deviance and D 0 = 2538.8 is the deviance of the null model which includes only the intercepts. G has a large-sample Chi-square distribution with degrees of freedom equal to the difference in the number of parameters estimated. The value of G was very large (G = 2538.8 –1355.8 = 1187.1; df = 2; P < 0.0001), indicating a highly significant decrease in the deviance when GSI is included in the model. The pseudo r2 value (r2 = 1–D m/D 0) was 0.467 suggesting that the inclusion of GSI decreased the model's deviance by 46.7%.
Results from multinomial logistic regression for Atlantic herring (Clupea harengus) using the North Sea Herring Acoustic Survey dataset (N = 3207). P, probability of being mature.

Despite the fact that the overall performance of the MLR model was very good the degree of overlap between immature and recovering classes was large and their maximum fitted probability was lower than 1, only reaching ~0.6 (Figure 4). On the other hand, both immature and recovering classes were clearly distinguishable from the mature-active class and the GSI cut-off scores were estimated to be 1.042 and 1.798 respectively.
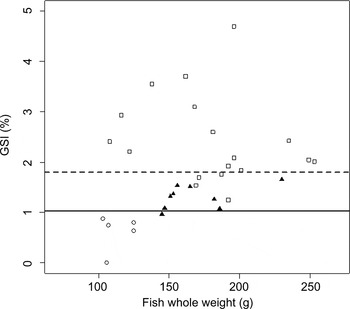
When the cut-off values were validated using histologically staged samples, the immature fish were successfully separated from the mature-active and recovering fish as all immature fish were below the lower GSI cut-off value (Figure 5). Furthermore, 90% of recovering fish (nine of the ten fish) were within the two GSI cut-off values. 90% of mature-active fish were above the upper GSI cut-off value, and so 10% of mature-active fish would be classed by the model as recovering fish (Figure 5). No recovering fish were above the upper GSI cut-off.
Validation of gonadosomatic index (GSI) cut-off values estimated from multinomial logistic regression for Atlantic herring (Clupea harengus). All samples were histologically staged. Circles, immature (stages I–II); filled squares, mature-active (stages III–IV); triangles, recovering (stage VIII). Plotted data come from samples that have been maturity staged histologically (N = 51). Solid line, lower GSI cut-off value (all fish below are predicted to be immature); dashed line, upper GSI cut-off value (all fish above are predicted to be maturing). Fish between the two GSI cut-off values are predicted to be recovering. GSI cut-off values were calculated using data from the North Sea Herring Acoustic survey (N = 3207).

DISCUSSION
The magnitude of the total error in 2006 on-board FRV ‘Scotia’ was low relative to other studies (Table 2). However, the magnitude of the total errors on-board FRV ‘Scotia’ and RV ‘Johan Hjort’ in 2007 were of similar levels to those found by Claereboudt et al. (Reference Claereboudt, Mcllwain, Al-Oufi and Ambu-Ali2005) who found 47% accuracy in kingfish (Scomberomorus commerson) and Tomkiewicz et al. (Reference Tomkiewicz, Tybjerg and Jespersen2003) who detected an accuracy of 20% for Baltic cod (Gadus morhua) staging. The sample sizes in all of these studies are relatively small and similar to the current study, due to the expensive, time-consuming nature of histology (West, Reference West1990). Collectively, these results suggest a lack of standardization in training and expertise between maturity readers.
Inaccuracies were found in differentiating between juvenile and adult fish, an error that will affect the SSB. A large proportion of fish were macroscopically staged as recovering (stage VIII) but were, in fact, immature (stages I–II) (Tables 6 & 7). All of these fish were sampled on-board FRV ‘Scotia’ in 2007 and RV ‘Johan Hjort’ in 2007. However, only one fish that was macroscopically staged as immature was found to be recovering after histological examination. Therefore, the inaccuracies found in this study would lead to an under-estimation of the SSB as the proportion of immature individuals would be inflated. Although there was no change in SSB estimates in 2006, maturity staging errors were estimated to cause an under-estimation of SSB of 26% in 2007. These results are in contrast to both Gerritsen & McGrath (Reference Gerritsen and McGrath2006) and Vitale et al. (Reference Vitale, Svedäng and Cardinale2006) who observed maturity staging errors that would lead to over-estimation of the SSB for whiting (Merlangius merlangus L.) and cod, respectively. The extent of the over-estimation of SSB was not calculated for whiting but the Kattegat cod female spawning biomass was found to be over-estimated by up to 35% (Vitale et al., Reference Vitale, Svedäng and Cardinale2006). While the macroscopic maturity staging errors found in this study would not lead to over-estimation of the proportion mature, and therefore potential overfishing of the stock, these errors could have implications for studies that use these data.
In order to accurately estimate the SSB, it is essential that the proportion mature is estimated correctly. Therefore, a tool that can split immature and recovering fish would be valuable, as this is where the most critical maturity staging errors lie. In the calculation of the proportion mature, maturing/spawning and recovering individuals are grouped into one class, ‘mature’, as they all have the potential to mature that year. Therefore, the crucial point at which the fish need to be split is between immature and maturing/recovering. The use of GSI cut-off points was successfully validated in this study with 91% fish correctly categorized. While there was some variability in the ability to separate recovering fish from maturing-active fish, the model was able to accurately assign 90% of the mature-active fish into the correct category. This has no implications now, but if recovering fish are classed as ‘skip spawners’ (e.g. Kennedy et al., Reference Kennedy, Skjæraasen, Nash, Thorsen, Slotte, Hansen and Kjesbu2010) rather than ‘mature’ in the calculation of the proportion mature, which is one possibility for the future, then the ability to split these two groups will become critical. This tool could be routinely and easily used to successfully correct errors in the macroscopic maturity stages between immature and recovering fish. McQuinn (Reference McQuinn1989) also found that GSI could be used successfully to crudely separate maturity stages of Atlantic herring in the north-west Atlantic when macroscopic maturity staging data are not available. Gutted weight and gonad weight are routinely collected for every fish sampled on-board FRV ‘Scotia’ during HERAS; however, neither are collected on-board RV ‘Johan Hjort’ during the same survey. It is therefore recommended that all vessels taking part in HERAS collect these data as they are not time consuming to collect and the GSI could be a valuable tool to increase the accuracy of maturity data.
The slopes of the relationship between logW gt and logW go for different maturity stages have previously been found to be equal for Atlantic herring (McQuinn, Reference McQuinn1989). However, in the present study there was a significant difference between the slopes of the relationship between logW gt and logW go across maturity stages which casts doubt on size-independence of the GSI model. It should be noted, however, that there are clear overlaps in the maturity staging data between immature stages and stage VIII, stages III and VIII, and stages III and IV (Figure 3). This overlap may be caused by maturity staging errors as there was a high degree of error with regard to separating maturity stages III and VIII, stages III and IV, and immature stages and stage VIII. This could, therefore, be causing the differences in slope estimates. Therefore, we suggest that if the accurate maturity stages had been assigned to all fish in this analysis, all of the slopes would be likely to be equal to the slope of the stage IV relationship, as stage IV was the most accurate macroscopic maturity stage (Table 5). We suggest that if the slope of the relationship between logW gt and logW go for any maturity stage is the same as it is for stage IV (i.e. equal to 1) then this may be an indication that this maturity stage has low staging error. Furthermore, we suggest that a simple scatterplot of logW gt and logW go can give a clear impression of where errors may lie without the need for modelling (Figure 3).
Maturity staging carried out on market samples at Marine Scotland exhibited much higher error than samples staged on-board FRV ‘Scotia’ by the same reader in 2007. This suggests that market samples are more difficult to stage than those sampled at sea. The market samples used in this study came from commercial vessels and had often been kept on ice for several hours before maturity assessments were carried out. In contrast, samples staged on-board FRV ‘Scotia’ were very seldom put on ice and are always sampled immediately upon capture. Freezing has been found to increase oocyte diameter and the weight of ovarian tissue in Atlantic cod (Klibansky & Juanes, Reference Klibansky and Juanes2007). Therefore, it may be much more difficult to assess maturity stage if fish are not fresh or have been on ice, possibly due to water uptake or freezing of the gonad tissue. This finding highlights the importance of using fresh samples for maturity staging data that will be used in SSB estimates.
The results of this study show that there are errors in the maturity staging of North Sea herring. The errors lead to under-estimation of the SSB, highlighting the unreliability of these data. The use of an 8-point scale implies a higher resolution of maturity data than can be achieved macroscopically. It is proposed that either more training is given to maturity readers or all countries involved in HERAS should switch to the four-point scale, i.e. immature, mature-active, spawning and spent/recovering. Spawning fish were absent from our analysis but this stage is easily discernible (Bowers & Holliday, Reference Bowers and Holliday1961). Bromley (Reference Bromley2003) has argued for the importance of using one universal key to reduce uncertainty about North Sea plaice (Pleuronectes platessa) maturity staging. A four-point scale would provide less fine-scale data but the data collection procedure and training of new technicians may be reduced. This may be a more cost- and time-effective means of gathering maturity staging data. Furthermore, GSI cut-off values can be used to correct macroscopic maturity staging in an objective manner. The GSI model is not only useful for validation of macroscopic maturity staging but would also be valuable in cases where there is no maturity staging data or the maturity staging data available are known to be unreliable.
ACKNOWLEDGEMENTS
The authors are grateful to Dr P. Fernandes and Dr E. Torstensen who organized the Scottish and Norwegian surveys, respectively, and all scientists and crew on-board FRV ‘Scotia’ and RV ‘Johan Hjort’ for their help at sea and during market sampling. Dr A. McKinnon and all other histology staff at IMS are gratefully acknowledged as well as Dr O. Kjesbu and Dr R. Nash for helping with histological analyses. This study was funded by the Nuffield Foundation (L.R.M.) and Fisheries Research Fund (FRS) (C.T.M.). This work was partly funded by a BBSRC PhD studentship (L.R.M.).