Introduction
The vast deployment of photovoltaic (PV) technologies in soiling-prone areas with increased air pollution levels, like China, India, or the Middle East, leads to an increasing relevance of the problem of soiling.[Reference Ilse, Figgis, Micheli, Wolfertstetter, Daßler, Hanifi, Naumann, Lange, Hagendorf, Gottschalg and Bagdahn1] The accumulation of dust and other contaminants on the front glass surfaces of PV modules leads to a reduction of the transmitted light to the solar cells and with that to reduced energy yields, which are reported to reach levels of more than 1% loss per day.[Reference Ilse, Figgis, Micheli, Wolfertstetter, Daßler, Hanifi, Naumann, Lange, Hagendorf, Gottschalg and Bagdahn1–Reference Sarver, Al-Qaraghuli and Kazmerski3] Various soiling mechanisms influencing soiling rates have been identified during soiling experiments, including rebound (particles bouncing off from the surface during impact) and resuspension (particles being removed from the surface by wind), as well as dew-related processes such as particle caking, cementation, and self-cleaning.[Reference Ilse, Figgis, Micheli, Wolfertstetter, Daßler, Hanifi, Naumann, Lange, Hagendorf, Gottschalg and Bagdahn1, Reference Ilse, Figgis, Naumann, Hagendorf and Bagdahn2, Reference Figgis, Ennaoui, Ahzi and Rémond4] The interplay of these processes is complex, and the assured prediction of actual soiling rates from only environmental parameters and surface properties is not possible yet.
Anti-soiling coatings (ASCs) are regarded as an attractive way of soiling mitigation, as they have the potential of passively reducing the accumulation of dust and therefore the need for cleaning.[Reference Ilse, Figgis, Micheli, Wolfertstetter, Daßler, Hanifi, Naumann, Lange, Hagendorf, Gottschalg and Bagdahn1] The anti-soiling performance of such coatings strongly depends on the coating properties (e.g., surface roughness and chemistry), as well as on the specific environmental conditions of the application area. In addition to coatings, also the PV module front glass itself can possess distinct surface structures, which potentially influence soiling.
In order to assess these influences, industry-relevant, solar-grade rolled glass substrates with three different surface morphologies were investigated and coated with three different ASCs. The used ASCs, which also possess anti-reflective properties, are based on sol–gel technology. They were proved to reduce dust accumulation in laboratory soiling experiments and field tests in Germany and Saudi Arabia over several years and potentially withstand typical abrasion damages from harsh cleaning.[Reference Bahattab, Alhomoudi, Alhussaini, Mirza, Hegmann, Glaubitt and Löbmann5–Reference Lange, Bahattab, Alqahtani, Mirza, Glaubitt, Naumann, Hagendorf and Ilse7] All three comprise thin, nanoporous silica layers, consisting of SiO2 particles of different sizes in the nm range, and reach coating thicknesses in the range of 100–150 nm.
Since outdoor testing can be strongly influenced by variations in weather conditions or site specifications, laboratory soiling test procedures were developed for a reproducible assessment of ASC in research and development.[Reference Ilse, Khan, Voicu, Naumann and Hagendorf8–Reference Ilse, Khan, Lange, Gurumoorthy, Naumann and Hagendorf10] This includes the processes of controlled dust deposition at defined environmental parameters (e.g., fixed relative humidity), as well as dust removal by drag forces during wind blow testing or by centrifugal forces in a rotational force test, as well as large-area light microscopy and image analysis for particle detection. The wind blow tests are considered to accurately simulate natural resuspension by wind, whereas the rotational force test allows for a statistical assessment of particle adhesion forces. However, the physics for the two dust removal approaches by wind drag and centrifugal forces differs considerably;[Reference Ilse, Khan, Lange, Voicu, Naumann and Hagendorf9] therefore, results from both methods are compared within this study.
Experimental
Sample set
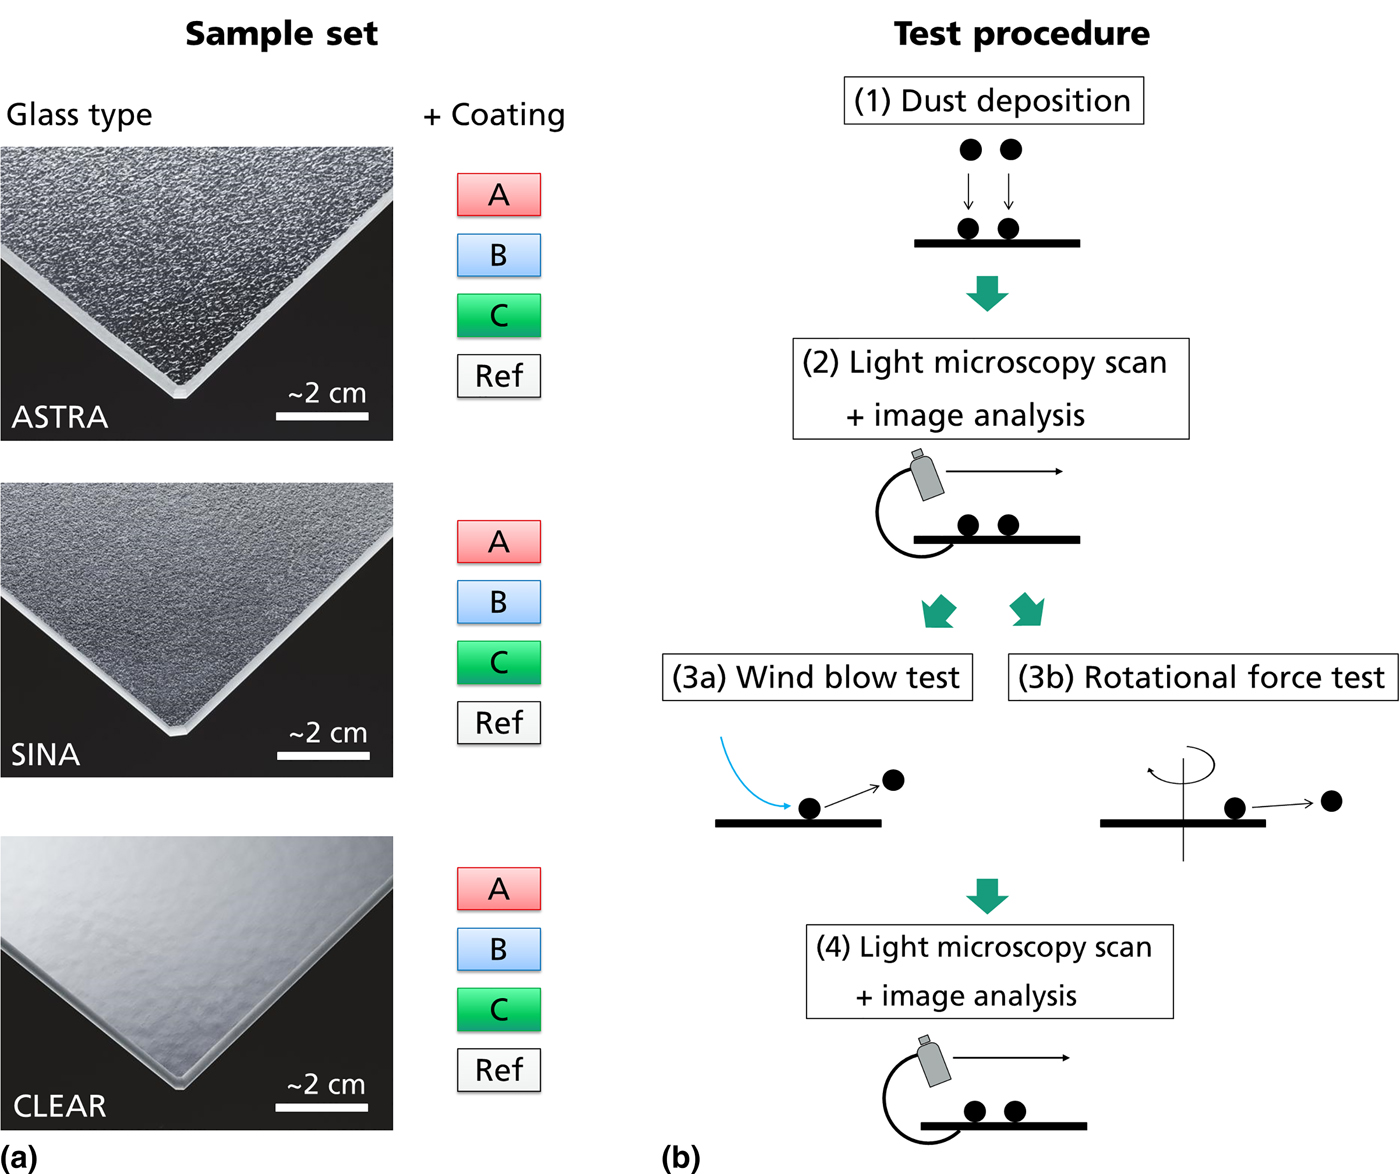
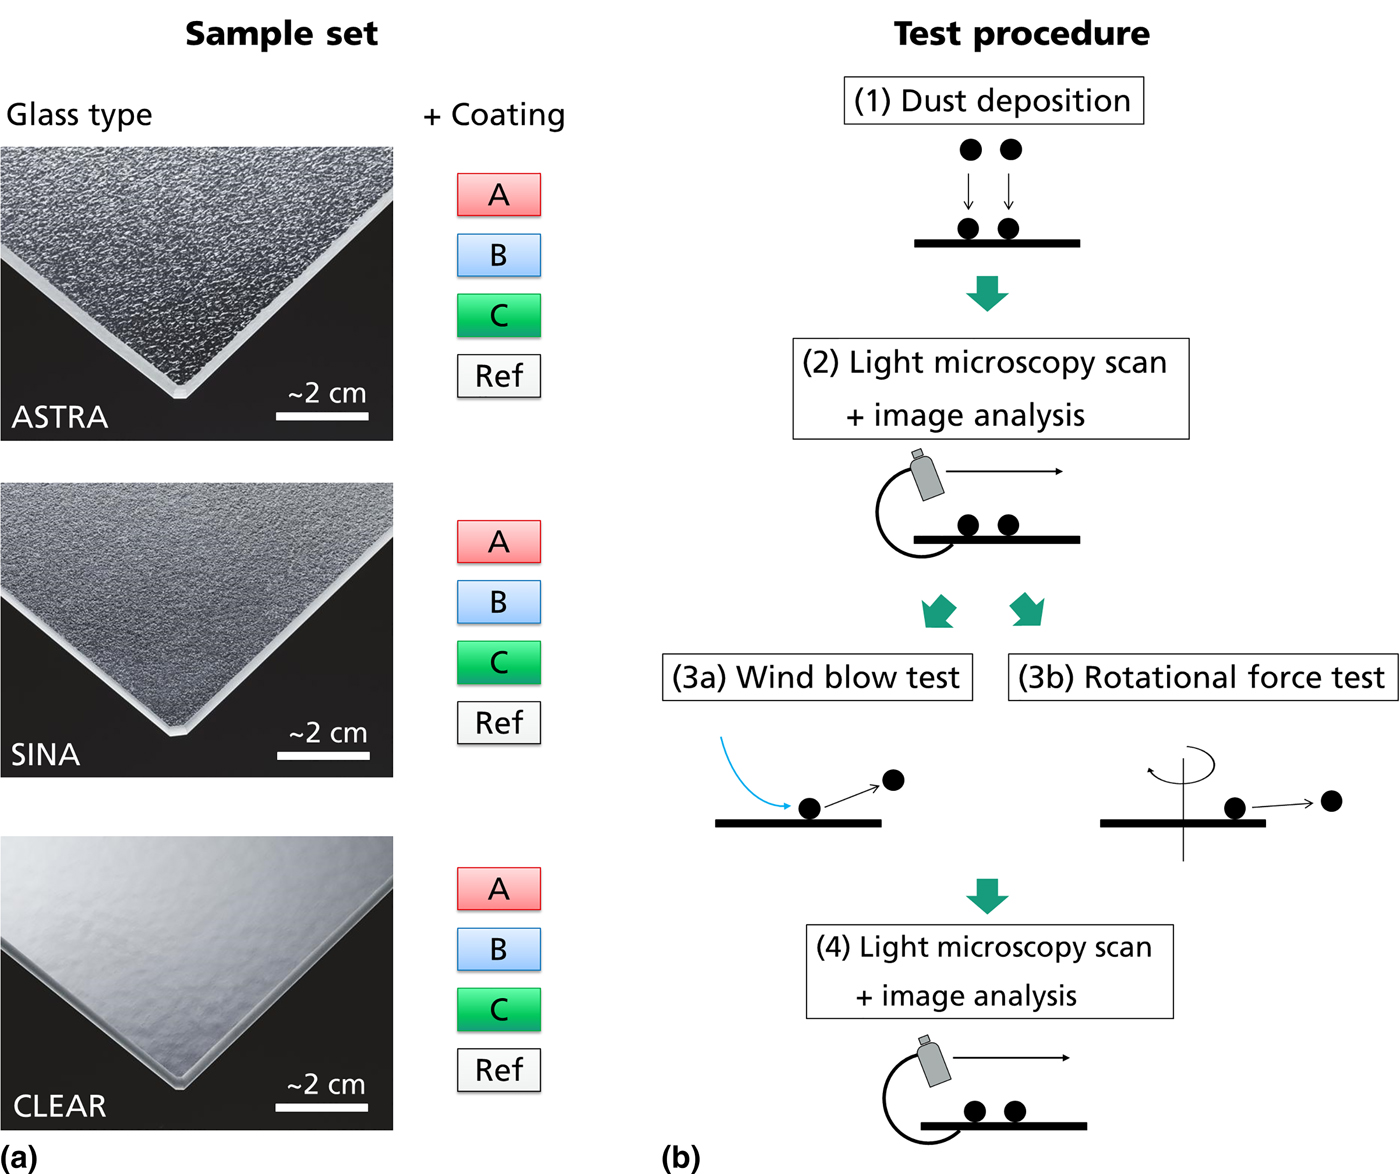
Three different solar-grade rolled glass substrates with different surface structures were provided by Interfloat Corperation/GMB Glasmanufaktur Brandenburg GmbH: ASTRA (high surface roughness, root mean square (RMS) = 3.8 μm), SINA (medium surface roughness, RMS = 3.0 μm), and CLEAR (low surface roughness, RMS= 1.1 μm) (see Fig. 1(a)). The surface roughness was measured with a Dektak XT profilometer using a scanning length of 10 mm. Each glass type was coated with three different anti-soiling coatings (ASCs), called A, B, and C, respectively. The samples were coated from sol–gel processes by dip-coating and are characterized by nanoporous silica coatings with different morphologies and surface properties. Coating A possesses a bimodal particle size distribution, resulting in a relief structure of hills with a height of approximately 30 nm at a distance of about 200 nm, which are covered by a fine granular matrix. In contrast, coating B contains nanoparticles with a broad particle size distribution, and coating C has a more granular structure with a narrow particle size distribution. Further details on the coating technologies used are provided in previous studies.[Reference Bahattab, Alhomoudi, Alhussaini, Mirza, Hegmann, Glaubitt and Löbmann5,Reference Glaubitt and Löbmann6] Besides the coated samples, also uncoated reference glasses (Ref) of each glass type were used. For each glass type, two sets of samples (A, B, C, and Ref) of the size 10 × 10 cm² were prepared and used for soiling tests with dust removal by wind blow and by rotational force tests, respectively.
(a) Sample set used for soiling experiments: three different glass substrates, coated with three different ASCs and one uncoated reference. (b) Schematic illustration of the soiling test procedure including (1) dust deposition, (2) light microscopy line scans and image analysis, (3a) wind blow testing, (3b) rotational force testing, and (4) again light microscopy and image analysis.
Test procedure
The test procedure to determine the anti-soiling functionality of the samples comprises four steps as shown in Fig. 1(b):
In step (1), dust particles were deposited from an aerosol by dry sedimentation in a dust chamber. For this, a defined amount Middle East Test Dust (ME Test Dust)Footnote 1 from KSL staubtechnik GmbH was dispersed with an aerosol generator RBG 1000I from Palas GmbH and blown into an enclosed dust chamber (see Ref. [Reference Ilse, Khan, Voicu, Naumann and Hagendorf8] for a detailed description of the test setup). Subsequently, the dust was allowed to settle onto the horizontal sample surfaces (0° tilt) for 30 min at defined environmental conditions of 23.4 ± 1.4 °C air temperature, 55 ± 2% relative humidity (RH) and 23.4 ± 2.1 sample surface temperature. As the dust chamber can cover up to four samples of 10 × 10 cm² at the same time, six subsequent deposition experiments were performed on the same day to assure comparable environmental conditions for the complete sample set.
In step (2), the soiled surface of each sample was analyzed with two perpendicular light microscopy line scans running from the edges through the sample center over the full sample width. For this, a Carl Zeiss Axio Scope.A1 with a 20× objective and a dark-field imaging mode was used. Subsequently, the images were analyzed with the image analysis software ImageJ with respect to the percentage of surface area covered by dust (surface coverage), also using single-particle detection and size analysis, determining the equivalent particle diameters of spherical particles with the same cross-sectional area. For this, the default auto-threshold function and particle size analysis tools were used. Thus, the number of particles of certain particle size classes present on the surface was determined for each image, also with respect to the position on the sample, which is needed for the evaluation of the rotational force tests.
In step (3), two different dust removal experiments were performed with sample sets of each glass type. During wind blow testing (3a), the samples were individually exposed to a homogeneous wind field as produced with an air knife, reaching wind speeds of about 15 m/s in parallel to the surface on all sample positions as measured by a hotwire anemometer at a sample distance of about 1 cm. For rotational force tests (3b), the samples were rotated horizontally at a maximum rotational speed of 6000 rpm using a commercial spin coater. More details on the test procedures as well as theoretical considerations on the acting forces and particle removal mechanisms are provided in other studies.[Reference Ilse, Khan, Voicu, Naumann and Hagendorf8–Reference Ilse, Khan, Lange, Gurumoorthy, Naumann and Hagendorf10] Both removal experiments were performed at comparably low relative humidity (<40% RH).
In step (4), the samples were reinvestigated by light microscopy in the same way as in step (2). The number of particles remaining on the sample surfaces was determined depending on the sample position. For the rotational force tests, the same data evaluation procedure as described in Refs. [Reference Ilse, Khan, Lange, Voicu, Naumann and Hagendorf9,Reference Ilse, Khan, Lange, Gurumoorthy, Naumann and Hagendorf10] was used in order to calculate the median necessary force (equivalent to the adhesion force) of particles on the surfaces depending on the particle size. For this, the rotation radius (distance from the center) was determined where 50% of particles of a specific size class are removed, together with a force–balance approach taking only van der Waals adhesion forces and centrifugal forces into account.
Results and discussion
Surface coverage analysis
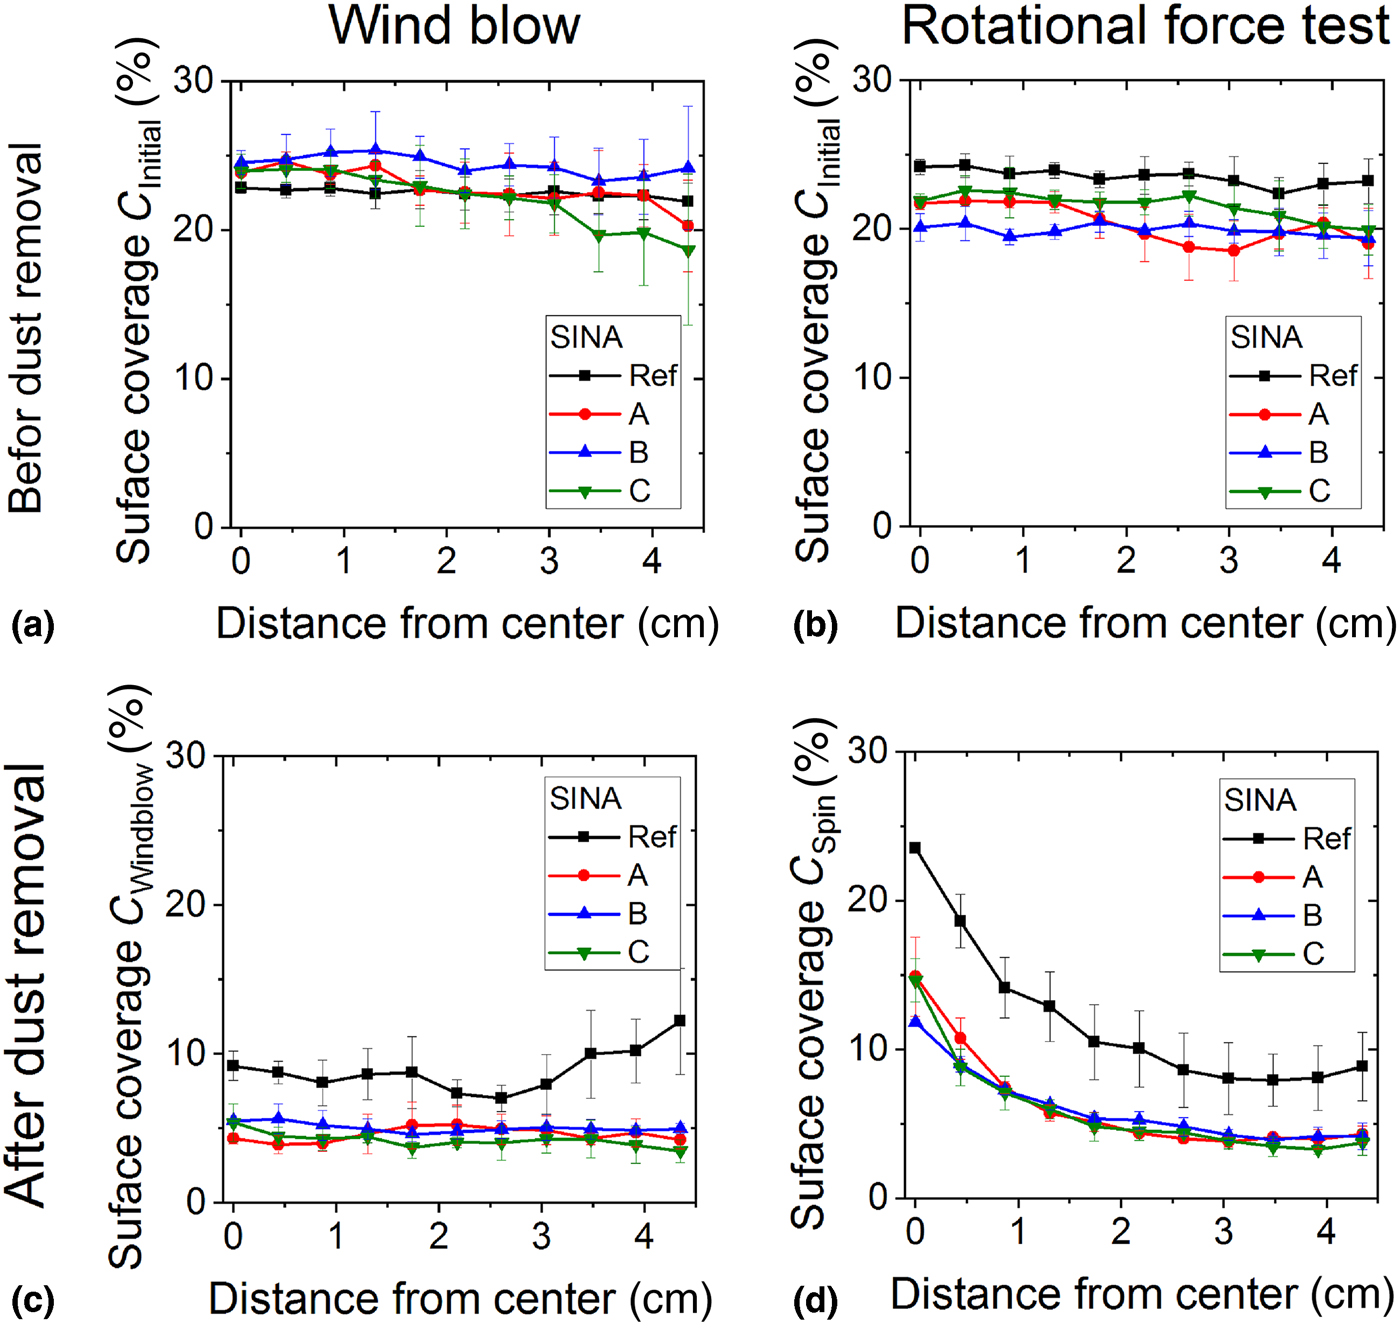
Dry soiling experiments were performed for three different glass types, which were coated with three different coatings A–C each. The applied test procedure is described in the Test Procedure section. In Fig. 2, exemplary results for the samples of the glass substrate SINA are shown, including surface coverage (percentage of surface area covered by dust) directly after dust deposition [Figs. 2(a) and 2(b)] and after particle removal by wind blow [Fig. 2(c)] or rotational force tests [Fig. 2(d)]. The surface coverage is displayed as a function of the rotation radius/distance from the sample center, which was chosen to reflect the radial dependence of the centrifugal forces in the rotational force test.
Exemplary surface coverage results from soiling tests of samples with a SINA glass substrate including values after dust deposition (a,b) and after dust removal by wind blow (c) and rotational force tests (d) for coatings A–C and an uncoated reference Ref.
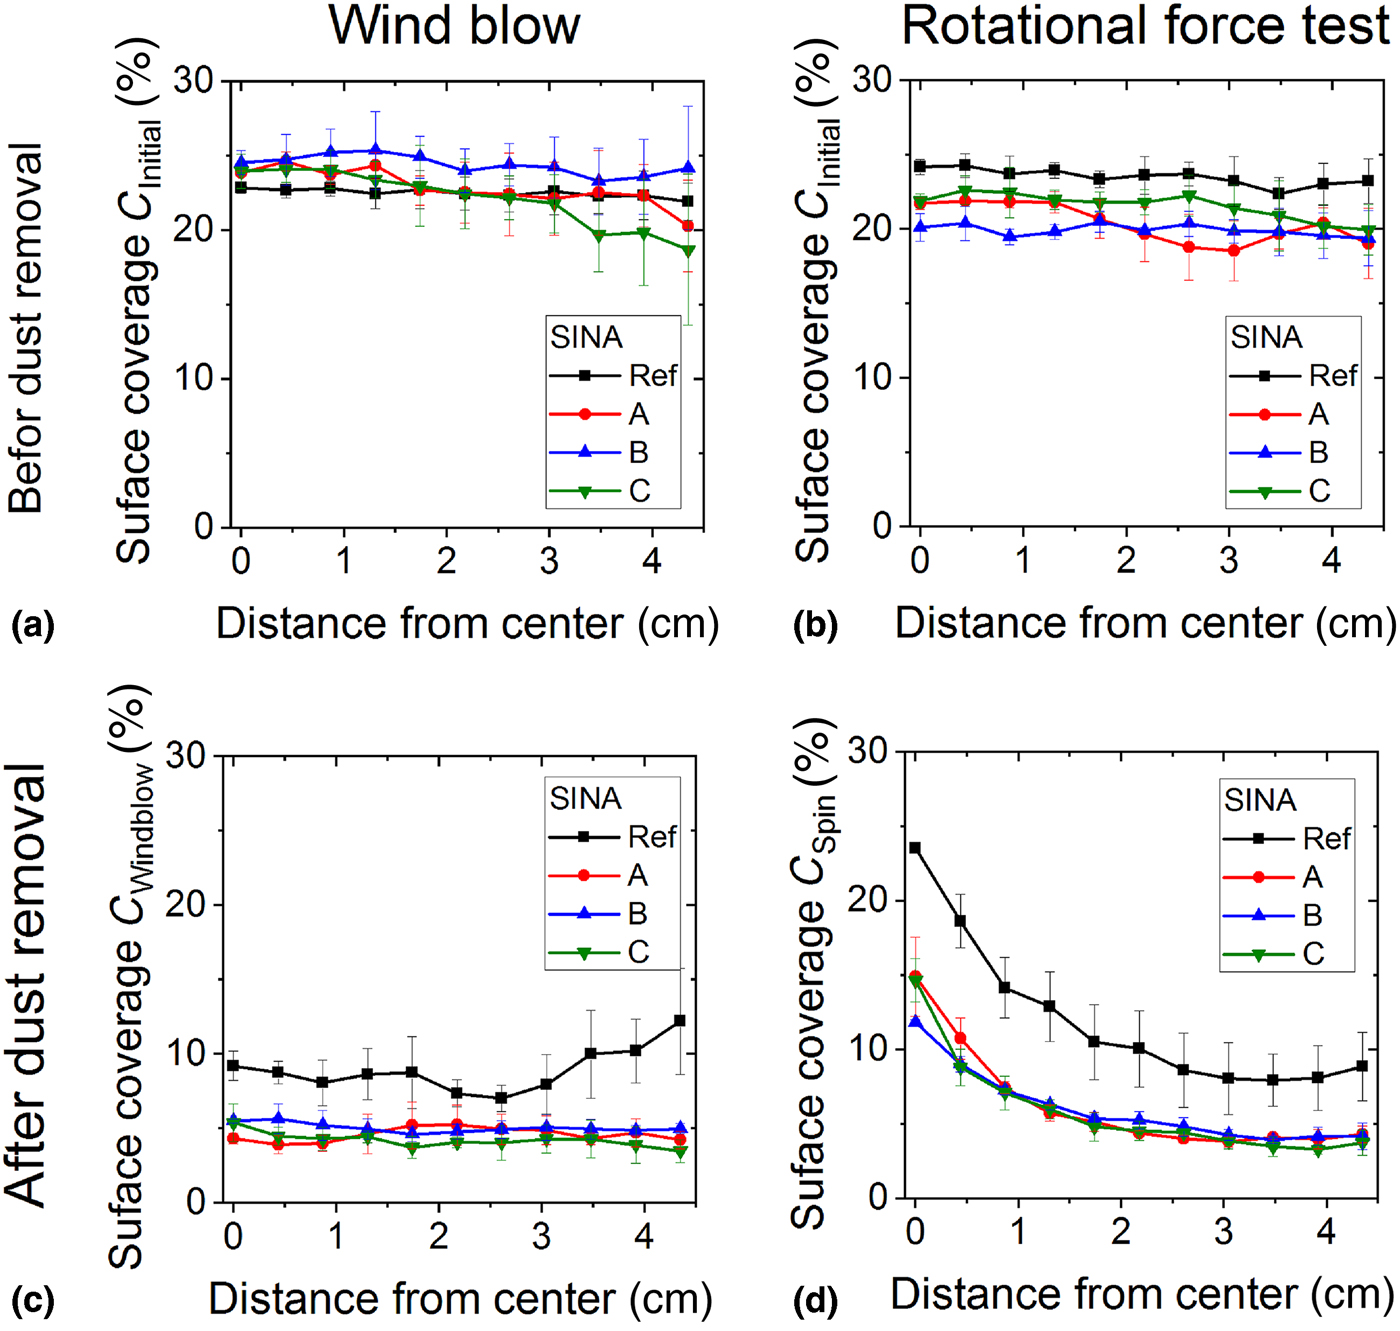
After dust deposition, all samples show a surface coverage of about 20–25%, with small variations for the different sample positions. The variations between the coatings could be attributed to inhomogeneity in the dust deposition process, as well as rebound effects during deposition. For uncoated glasses, the same deposition process typically leads to much smaller deviations between different sample positions (not shown here, see also Ref. [Reference Ilse, Khan, Voicu, Naumann and Hagendorf8]), which indicates that rebound could be an important influencing factor and potentially also changes the particle size distribution of accumulated dust for the different samples after deposition.[Reference Ilse, Khan, Lange, Voicu, Naumann and Hagendorf9] Accordingly, no assured conclusions on ASC performance can be drawn from the results directly after dust deposition, as the ranking of coatings changes in between dust deposition experiments. It should be noted that the coating positions were varied from test to test in order to avoid misinterpretation arising from the dust deposition process itself.
In contrast, the results after dust removal experiments show a clear difference between the dust removal efficiency of the coated samples and the uncoated reference. After the wind blow test, the surface coverage of all samples was significantly reduced for all sample positions to about 10% for the uncoated reference and about 5% for the coated samples [see Fig. 2(c)]. Accordingly, it can be concluded that the coatings reduce soiling by about 50% relative for the given test conditions (dry environment, high near-surface flow velocity of about 15 m/s).
For the rotational force tests, similar results can be observed. Here, a clear radially decreasing surface coverage towards the sample edges can be seen [see Fig 2(d)]. This is attributed to the radial dependence of the dominating particle removing force, which is the centrifugal force in the present case.[Reference Ilse, Khan, Lange, Voicu, Naumann and Hagendorf9] Towards the sample edge, the resulting surface coverage was about 8–10% for the uncoated samples and 4–5% for the coated samples, resulting again in a relative soiling reduction of about 50%.
According to our previous studies using the same measurement methodology, the surface coverage correlates well with optical transmittance losses, whereby 1% surface coverage corresponds to approximately 0.3% loss in transmittance.[Reference Ilse, Khan, Voicu, Naumann and Hagendorf8] However, it should be noted that this relation strongly depends on the parameters used for light microscopy and image analysis and therefore is not universally applicable.
From the surface coverage results, no clear differences or ranking of the coatings can be observed for both test methods. However, previous studies have shown that variations in particle size distribution, e.g., after dust deposition, can lead to strong variations in the removal efficiencies.[Reference Ilse, Khan, Lange, Voicu, Naumann and Hagendorf9,Reference Ilse, Khan, Lange, Gurumoorthy, Naumann and Hagendorf10] This is mainly related to a strong particle size dependence of particle adhesion and removal forces. Therefore, in the following, wind blow and rotational force testing results are analyzed after dust deposition and after dust removal with respect to individual particle sizes for all tested samples. Thus, by analyzing the relative removal efficiency with respect to particle sizes, the influence of potentially disturbing factors like different particle size distributions after dust deposition can be reduced.
Particle removal efficiency during wind blow testing
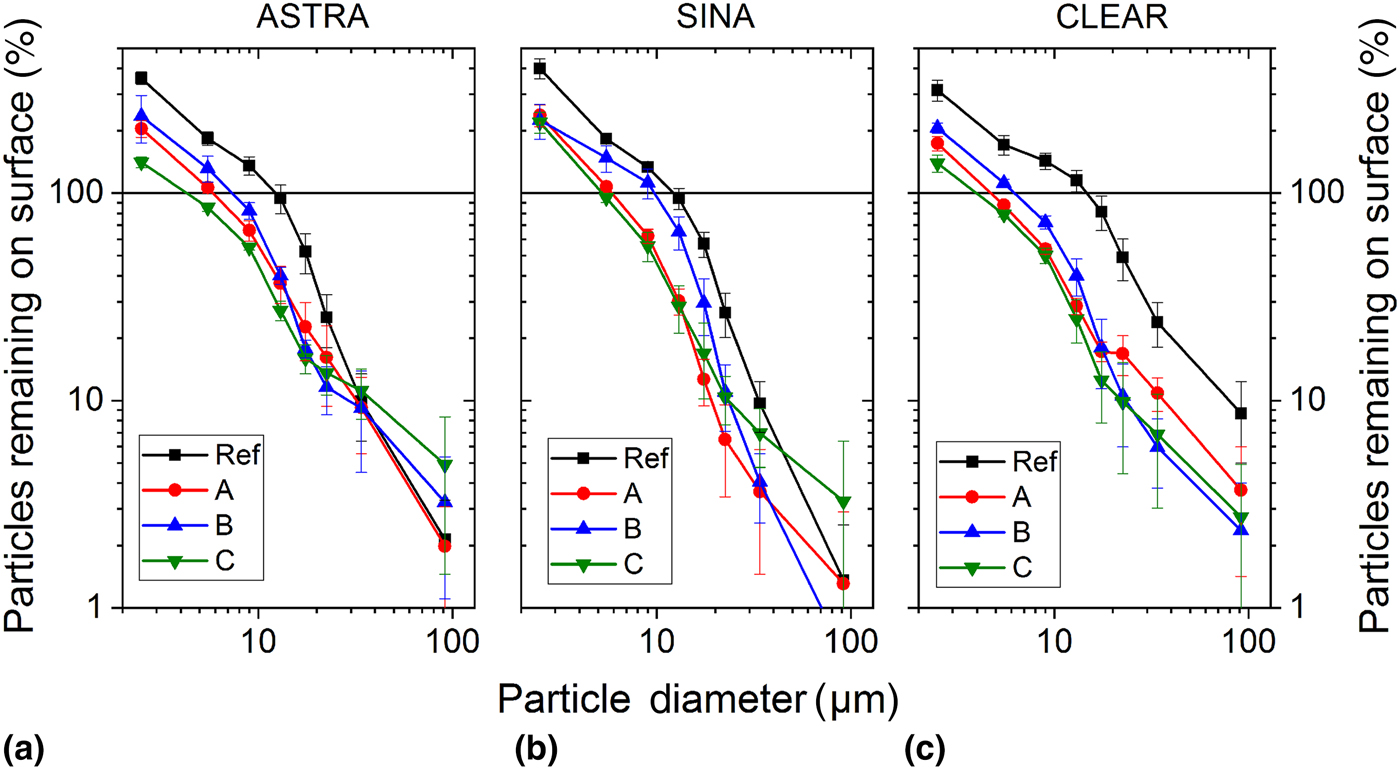
In Fig. 3, the data show results from experiments at different glass types and ASC exposed to wind blow tests. The remaining particle coverage is presented as a function of particle size, ASC, and glass substrate type, i.e., ASTRA [Fig. 3(a)], SINA [Fig. 3(b)], and CLEAR [Fig. 3(c)], respectively. For all samples, an increased amount of removed particles is found with increasing particle size. This is attributed to the fact that the particle adhesion force scales with the particle diameter d, whereas the wind drag forces, which enable particle resuspension, scale with d².[Reference Ilse, Figgis, Naumann, Hagendorf and Bagdahn2,Reference Ilse, Khan, Lange, Voicu, Naumann and Hagendorf9] Accordingly, smaller particles are much harder to remove from sample surfaces by wind blow compared to large ones. In addition, for very small particles, even increased numbers of particles remaining on the surface are detected. These are attributed to smaller particles which were previously shaded by larger ones which got removed during wind blow testing. In addition, parts of particle agglomerates (which were detected only as one large particle in light microscopy) and small particles from surface contaminations of the larger ones remain on the surface and lead to an increase in surface coverage. Similar results were found in another study.[Reference Ilse, Khan, Lange, Voicu, Naumann and Hagendorf9]
Relative number of particles remaining on the tested surfaces (coating A–C and uncoated reference glass Ref) after wind blow experiments, depending on the equivalent particle diameter and the three different glass substrates (a) ASTRA, (b) SINA, and (c) CLEAR, respectively.
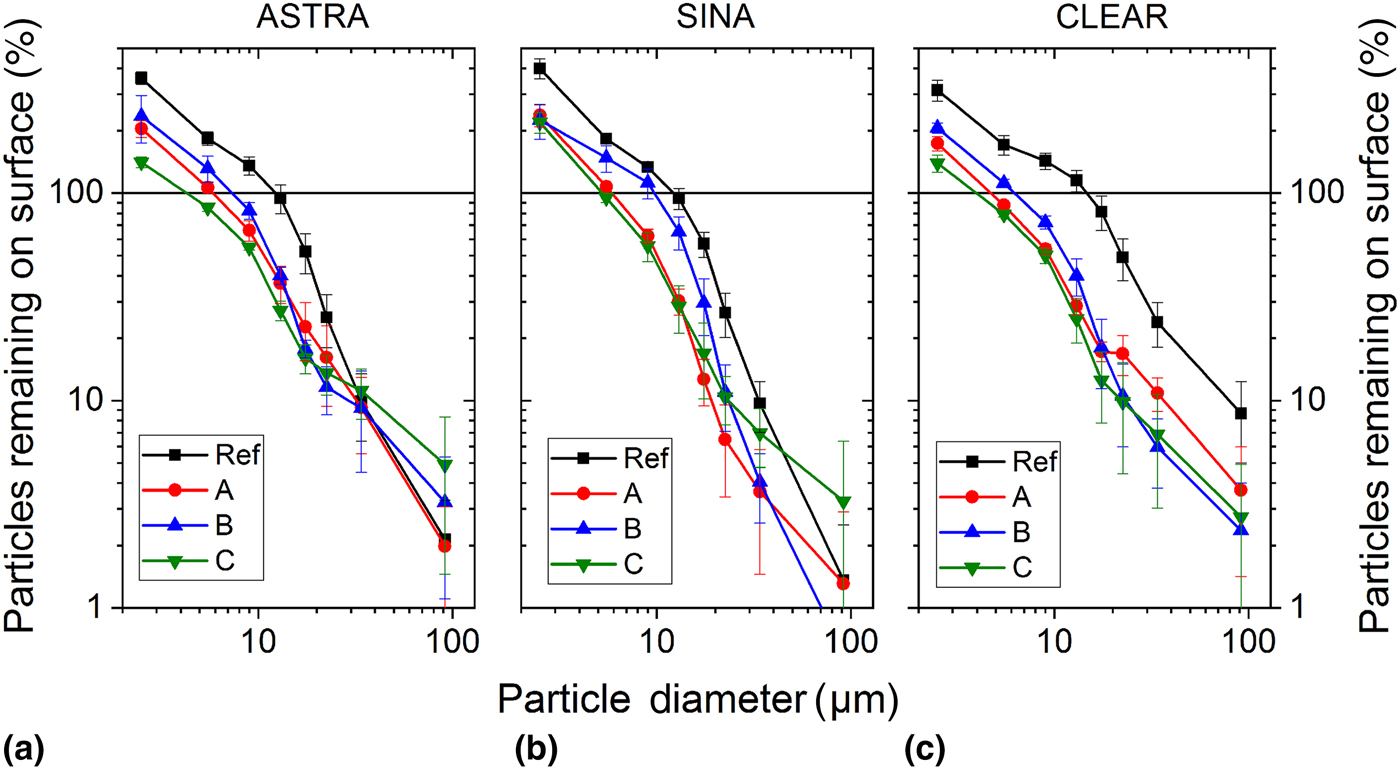
Comparing the different ASC of each sample set, a clear coating ranking is observed for particles smaller than 30 μm. Coating C shows the best removal efficiency, followed by B, A, and the uncoated reference. In addition, it can be seen that the ranking of coatings remains constant for all used glass types. According to the coating ranking, the shoulders in the curves of the coated samples are shifted to smaller particle sizes. This indicates that lower adhesion forces of the coatings (see the next section) cause higher removal efficiencies for a wide range of particle sizes, at least for d < 30 μm.
For larger particle diameters, higher uncertainty and deviation in the coating ranking are observed. This is possibly because larger particle size classes are more prone to statistical variation as the number of particles per image area is much smaller compared to the small particles (e.g., two particles per image compared to 50). In addition, particle adhesion forces are typically distributed over a wide force range, e.g., as Weibull or log-normal distributions, even for narrow particle size classes.[Reference You and Wan12,Reference Götzinger and Peukert13] These distributions are assumed to be much broader for larger particles because arbitrary particle shapes can lead to much larger variations in effective contact areas between particles and the substrate for larger particles with higher surface areas. Furthermore, rebound effects could also play an important role, as the low-adhesive, high kinetic particles may have rebounded from coated surfaces but not from the uncoated glasses. Accordingly, the rebound effect could introduce an additional uncertainty regarding the relative number of particles removed. However, as especially the large particles contribute a lot to particle-surface coverage (e.g., one particle with d = 100 μm equals 2500 particles with d = 2 μm), statistical effects can easily lead to deviations which complicate the interpretation of the surface coverage results, as already indicated in the previous section.
Comparing the results of the different uncoated glass substrates, there is no clear evidence that the substrate structure fundamentally changes the particle resuspension behavior. All uncoated reference glasses show effectively no particle removal for particle sizes smaller than about 20 μm. For larger particle sizes, which are more prone to statistical uncertainty, the uncoated CLEAR sample indicates the least removal efficiency. It could be postulated that the comparably flat structure increases particle-surface contact area and possesses a different, unfavorable turbulence of the blowing wind at the surface. However, further investigations are needed to falsify such assumptions.
From the results, it can be concluded that for particle resuspension, the differences in substrate roughness at the microscale are not decisive, but the coating properties at the nanoscale dominate particle adhesion and particle removal.
Particle adhesion forces as determined from the rotational force test
The results from rotational force tests were evaluated with respect to particle sizes. The median removal force F rem was determined for each particle size class of the respective coating from the distance from sample center r 50% at which 50% of the particles are removed:

with d being the particle diameter, ϱparticle being the density of the particle material (here ϱparticle = 2500 kg/m³), and f = 6000 rpm being the maximum rotational speed.
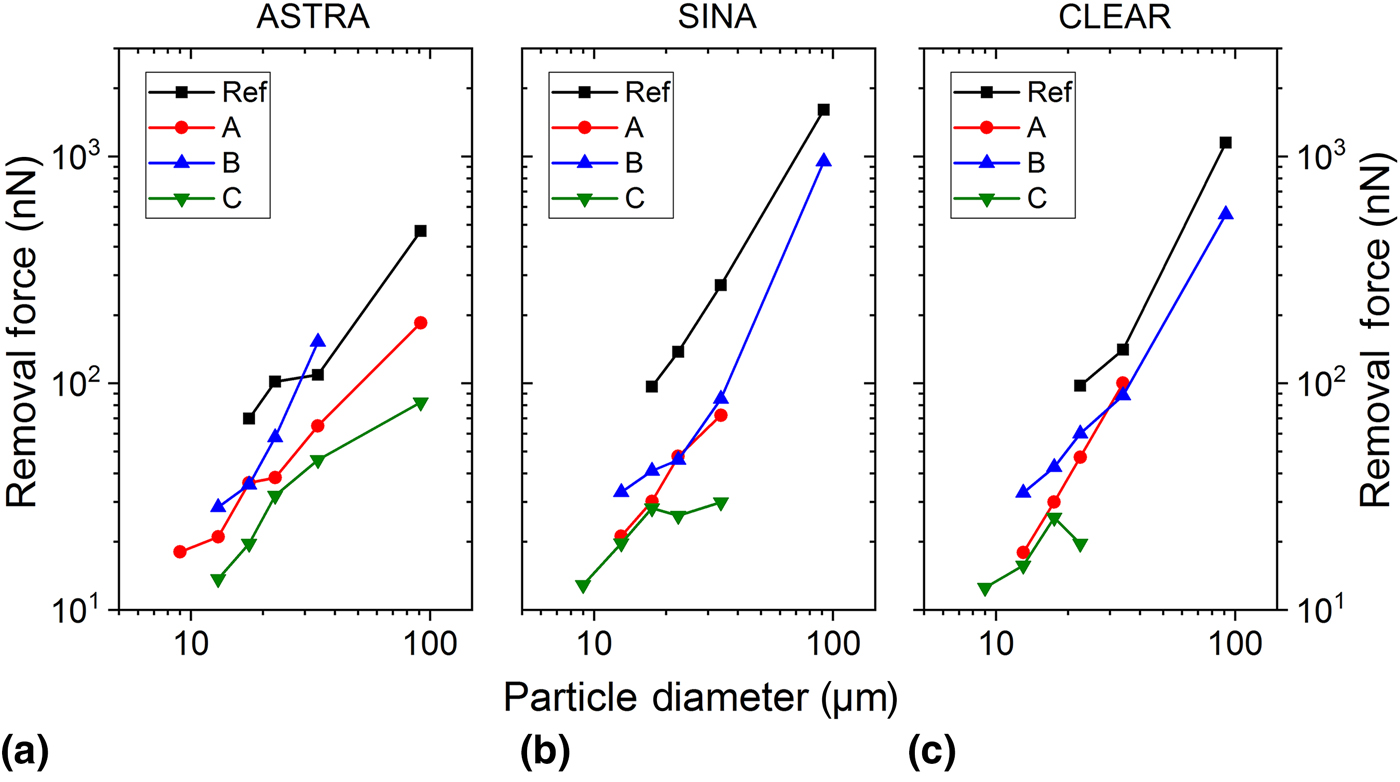
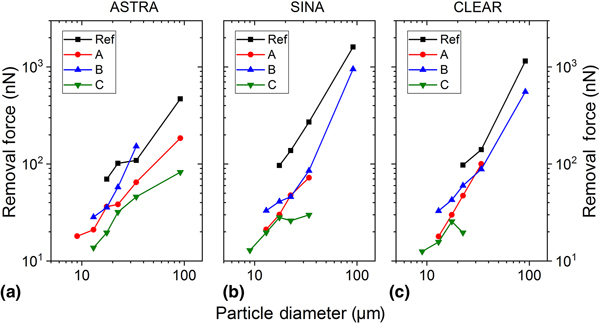
The results are displayed in Fig. 4 for the substrate types ASTRA [Fig. 4(a)], SINA [Fig. 4(b)], and CLEAR [Fig. 4(c)]. Assuming a particle removal by sliding, this removal force would be equivalent to the median adhesion forces F adh between the particles and the surface.[Reference Ilse, Khan, Lange, Gurumoorthy, Naumann and Hagendorf10] The corresponding adhesion forces, e.g., for the uncoated reference glasses, are in the region between 70 and 2000 nN for particle diameters between 10 and 100 μm. These are expected values for particle adhesion of the respective sizes, as has been indicated by several atomic force microcsopy (AFM) studies with dust particles sliding or tipping on the glass.[Reference Ilse, Khan, Lange, Gurumoorthy, Naumann and Hagendorf10, Reference Kazmerski, Diniz, Maia, Viana, Costa, Brito, Dias Campos, de Morais Hanriot and de Oliveira Cruz14–Reference Moutinho, To, Jiang, Engtrakul, Einhorn, Sellinger, Yemam, Al-Jassim and Simpson18] The dry adhesion forces for ASC glasses can be roughly one order of magnitude lower, and similar behavior for different coatings was also found in other studies.[Reference Ilse, Khan, Lange, Voicu, Naumann and Hagendorf9,Reference Moutinho, To, Jiang, Engtrakul, Einhorn, Sellinger, Yemam, Al-Jassim and Simpson18]
Calculated forces, which are necessary for particle removal from coated (A–C) and uncoated glasses (Ref) in the rotational force test, depending on the equivalent particle diameter and the three different glass substrates (a) ASTRA, (b) SINA, and (c) CLEAR, respectively.
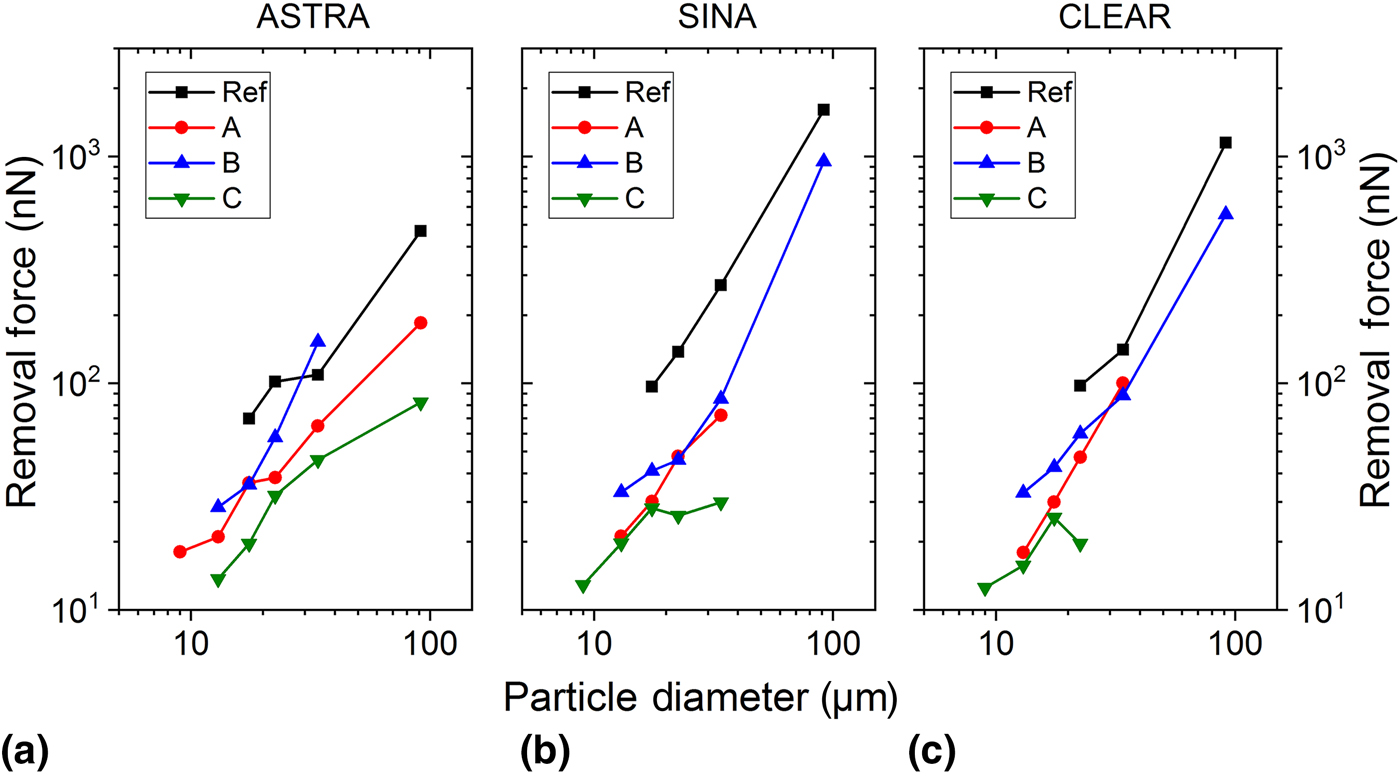
Complementary to the observations in the previous section, Fig. 4 clearly indicates that the particle adhesion force increases with increasing particle size. In addition, the same ranking of ASC performance is demonstrated as in the Particle Removal Efficiency During Wind Blow Testing section, irrespectively of the used glass substrate. Some overlapping of curves of some coatings can be detected, suggesting that the coating surface properties lead to similar particle adhesion forces at least for some specific particle size ranges. This behavior also justifies that the combined surface coverage and particle size analyses are helpful for a comprehensive understanding of ASC performance and ranking. Quantitative differences of observed removal forces for different substrates are not further investigated in detail, as the samples were subject to different deposition processes with slightly deviating environmental parameters. Thus, more extensive studies and statistical data would be required.
In the Surface Coverage Analysis section, no clear coating ranking was evident from the surface coverage results. The fact that the investigations in Particle Removal Efficiency During Wind Blow Testing and Particle Adhesion Forces as Determined from the Rotational Force Test sections indicate a clear ranking is possibly attributed to the additional information on the particle–sample interaction that may be gained from particle size-dependent investigations. In particular, the size analysis reduces uncertainties arising from variations in particle size distributions on different samples after dust deposition. One possible reason for inhomogeneous lateral distribution of different particle sizes is rebound of larger particles. Due to sufficient kinetic energies, they can bounce off the surface during impact overcoming adhesive interactions at the surface. Subsequently, resettlement on different surface areas may occur. Accordingly, the usage of test dusts with smaller particle sizes could improve testing results by reducing rebound effects for surfaces with low-adhesive forces. However, a particle size-dependent analysis is recommended to assure a correct interpretation of test results.
Summary and conclusion
Within this study, the resuspension behavior of dust particles from three different ASCs, which were deposited onto three glass substrates with different structures in the micrometer range, was investigated for dry soiling conditions and two different dust removal tests. For this, a test procedure was used comprising the steps of dust deposition, light microscopy characterization, dust removal by either wind blow or a novel rotational force test, and again light microscopy. Both surface coverage (surface area fraction covered by particles) and the number of particles remaining on the sample surfaces after dust removal, also depending on particle size, were determined from the light microscopy results.
The surface coverage results clearly indicate an enhanced anti-soiling functionality of all coated samples compared to the uncoated glass references with a soiling reduction of about 50% relative for both dust removal by wind (wind speed of approximately 15 m/s) and by rotational force tests (rotational speed of 6000 rpm). However, it should be noted that this relative soiling reduction could change considerably for other test parameters (e.g., relative humidity, used test dust, and wind speeds), which was not investigated in detail in this study.
A particle size-dependent analysis of the resuspension behavior revealed clear differences among coatings and a consistent ranking of ASC for all tests. Additionally, the rotational force test results were used to assess particle removal forces, which were reduced for the ASCs by about one order of magnitude compared to uncoated reference glass surfaces. Based on a sliding model for particle removal, the corresponding adhesions forces are in the range of 10–2000 nN for particle diameters between 10 and 100 μm. Accordingly, a particle size-dependent analysis of the rotational force test can be regarded as a feasible measure to investigate the ranking of ASCs for dry resuspension by wind, irrespective of the glass surface structures.
Acknowledgments
This study was financially supported by King Abdulaziz City for Science and Technology. The development of the methodology used in this study was funded in part by the Federal Ministry of Education and Research of Germany (BMBF) in the project WÜSTENMODUL (project number 03FH014IX4).