Introduction
Disparities in health services utilisation for older Americans have been widely studied for many years and continue to be heavily investigated. Most certainly, some of this can be attributed to the baby-boom generation fast approaching retirement and the ensuing policy implications. In addition, with the recent Supreme Court decision to uphold parts of the Patient Protection and Affordable Care Act (ACA) and state-level debates surrounding Medicaid expansion, costs and budgets, examining health services utilisation is a worthwhile research goal (see Flower and Nonnemaker Reference Flower and Nonnemaker2010). This paper investigates differences between older Blacks/Whites by employing a methodological approach that provides a comprehensive analysis of utilisation; more specifically, an estimation procedure employing Quantile Regression (QR). Because this approach models the entire distribution function, researchers and policy analysts can obtain a deeper understanding of which groups are the most disadvantaged.
Objective: why this is an important topic?
Demographic changes and ageing
A recent United States (US) Census Bureau (Bernstein and Edwards, Reference Bernstein and Edwards2008) press release states the 65 and older age group will increase from 38.7 million to nearly 88.5 million by 2050. Stated differently, this means nearly one in five US residents will be 65 years or older. Along the same lines, the 85 and older age group (referred to as the oldest-old) will increase nearly 300 per cent from 5.4 million to 19 million. Census projections also show the national median age continues to increase and if this is examined by race, the projection is striking. For Whites, the median age increases slightly from 38.4 to 39.4; but for Blacks, it increases from 31.7 to 38.9 (see Bernstein and Edwards, Reference Bernstein and Edwards2008).
A final demographic characteristic to note is life expectancy, which has been steadily increasing in the US at a rate of two years per decade (White Reference White2002). Census projections show life expectancy for Whites will increase from 78.9 in 2010 to 83.3 by 2050. Once again, this is striking for Blacks, with life expectancy increasing from 73.8 to 81.8 years. As Cohen (Reference Cohen, Anderson, Bulatao and Cohen2004: 1) highlights, ‘life expectancy [between 1950 and 2000] at age 65 rose 31 percent for men and 28 percent for women’ due to advances in medicine, healthier lifestyles and greater access to care. Clearly, the USA is steadily progressing in median age and life expectancy for both Whites and Blacks. This upcoming demographic shift provides an excellent opportunity to address a wide range of ageing issues.
Background on disparities in health services utilisation: economic access, usual source of care, individual beliefs
Dunlop et al. (Reference Dunlop, Manheim, Song and Chang2002) provide a solid contribution in the area of health disparities and utilisation for older adults. Employing data from the Asset and Health Dynamics of the Oldest Old (AHEAD) survey, these scholars examine ethnic/racial differences in utilisation due to economic access. The logistic regressions show older African American males are significantly less likely to engage in any contact with a physician even after controlling for demographic characteristics, chronic conditions and functional limitations when compared to White males (the reference group). These scholars suggest that economic access ‘continues to influence the use of some health services’ and their findings also ‘indirectly suggest that geographic barriers do not play a significant role in the observed utilization disparities [due to the significant gender/ethnic interactions in medical care utilisation], except perhaps in outpatient surgery’ (Dunlop et al. Reference Dunlop, Manheim, Song and Chang2002: 231). To a large extent, other scholars have corroborated these findings (see Bernstein Reference Bernstein2004; Chen et al. Reference Chen, Diamant, Pourat and Kagawa-Singer2005; Walker et al. Reference Walker, Steers, Liang, Morales, Forge, Jones and Brown2010).
Usual source of care (USC) has also been considered a factor in explaining health disparities and utilisation (see Corbie-Smith et al. Reference Corbie-Smith, Flagg, Doyle and O'Brien2002; DeVoe et al. Reference DeVoe, Fryer, Phillips and Green2003; Escarce and Mcguire Reference Escarce and Mcguire2004; Escarce et al. Reference Escarce, Epstein, Colby and Schwartz1993; Lambrew et al. Reference Lambrew, DeFreise, Carey, Ricketts and Biddle1996). In this context, USC refers to a particular health-care provider an individual seeks for medical advice and treatment. This is analogous to registering with a primary care clinic or general/family practice (GP/FP) office in the case of the United Kingdom, the Netherlands and New Zealand (see Schoen et al. Reference Schoen, Osborn, Doty, Bishop, Peugh and Murukutla2007). Scholars have found individuals with a regular physician are more apt to use preventive services and, in turn, maintain better health. In fact, Sox et al. (Reference Sox, Swartz, Burstin and Brennan1998) suggest USC may be a stronger predictor of health access when compared against health insurance. This is an important consideration because Blanchard and Lurie's (Reference Blanchard and Lurie2005) analysis of data from the Commonwealth Fund 2001 Health Care Quality Survey shows over 80 per cent of Whites list a doctor's office as USC while less than 66 per cent of Blacks do so. Another noteworthy study examines the impact of USC on the utilisation of preventive services after controlling for endogeneity (Xu Reference Xu2002). More specifically, this study recognises ‘individuals who are likely to use more preventive services may choose to have a regular doctor or site’ and this is ‘driven by unobservable preferences’ (Xu Reference Xu2002: 1513). Results suggest the impact of USC decreases after controlling for unobserved characteristics. Nevertheless, the presence of a USC is beneficial for blood pressure and cholesterol screenings, and important preventive services for coronary artery disease, kidney damage, stroke and atrial fibrillation. These findings are important for they also show having a regular site can be as effective as a regular doctor for other preventive screenings.
Ayalon and King-Kallimanis (Reference Ayalon and King-Kallimanis2010) provide another important contribution in understanding health disparities and utilisation for older adults. Instead of focusing on access to care, socio-economic characteristics (socio-economic status (SES)), insurance or USC, these researchers examine time and value preference. Employing the time-tradeoff module of the 2002 Health and Retirement Study, these researchers show Blacks are ‘more willing to live longer in imperfect health [and] relative to Whites, Blacks are more likely to report a longer time-tradeoff’ (Ayalon and King-Kallimanis Reference Ayalon and King-Kallimanis2010: 1184). In other words, Blacks are willing to trade more years of life at worse health as compared to fewer years of life in perfect health. Equally important, this work suggests ‘in this sample of community dwelling older adults, it is the subjective perception of one's health that is associated with one's preferences, rather than one's objective medical or cognitive states' (Ayalon and King-Kallimanis Reference Ayalon and King-Kallimanis2010: 1194). If this is the case, then racial disparities in health utilisation may originate due to relative differences. Perhaps, some of this could be reconciled by controlling for individual attitudes regarding health insurance and health intervention. More recent work by Bibb, Padden and Ferguson (Reference Bibb, Padden and Ferguson2012) encourages researchers to investigate such factors. Based on a homogenous convenience sample of 202 older adults from data collected using questions from the Behavioral Risk Factor Surveillance System Survey (BRFSS 2007–2009), these scholars find that both social determinants of health (i.e. race, income, education) and moderators (i.e. perceived health status, obesity) impact health utilisation but variation still exists. They conclude by suggesting future research should explore the association between non-social determinants and utilisation.
Conceptual framework
This research paper applies the Andersen (Reference Andersen1968) and Wolinsky et al. (Reference Wolinsky, Mosely and Coe1986) behavioural model of health services utilisation, where
 $$U = f\,(P,E,N),$$
specifically, utilisation (U) as a function of predisposing factors (P), enabling factors (E) and need characteristics (N). Predisposing factors include sex, marital status, race, education and labour-force participation; enabling includes income, type of residence, Census region; and need includes perceived health status and limited activity. This author's approach most closely resembles this framework. More specifically, health utilisation consists of demographic characteristics (predisposing), economic factors (enabling) and health attributes (need). These are described in greater detail in the sections on dependent and independent variables. However, this analysis is able to refine perceived health status as having a (a) physical health component, as well as (b) mental health component, and both are continuous measures. Unlike previous research, this study also includes two variables examining (a) beliefs regarding the need of medical insurance and (b) the ability to overcome illness without medical intervention.
In terms of a formal hypothesis, the study examines the following:
• Hypothesis O1: Utilisation rates for older Blacks and Whites do not differ across the distribution function.
• Hypothesis A1: Utilisation rates for older Blacks are significantly lower at the front of the distribution function.
Since this study also examines the importance of health-related behaviours/beliefs, the following supplementary hypothesis is tested:
• Hypothesis O2: Beliefs about needing medical insurance and medical intervention are not associated with utilisation rates for older adults across the distribution function.
• Hypothesis A2: Not needing medical insurance and medical intervention are associated with lower utilisation rates for older adults across the distribution function.
Methods
Data
This analysis uses data from the Medical Expenditures Panel Survey (MEPS) to examine health services utilisation for older adults (i.e. age 65 and over). MEPS data series, which are projects at the Agency for Healthcare Research and Quality, consist of a ‘set of large-scale surveys of families and individuals, their medical providers, and employers across the United States. MEPS is the most complete source of data on the cost and use of health care and health insurance coverage’ (MEPS survey background homepage at http://www.meps.ahrq.gov/mepsweb/). MEPS consists of three parts, which correspond to: (a) Household Component (HC); (b) Insurance Component (IC); and (c) Medical Provider Component (MPC). The HC includes ‘detailed information for each person in the household on the following: demographic characteristics, health conditions, health status, use of medical services, charges and source of payments, access to care, satisfaction with care, health insurance coverage, income, and employment’. The IC includes ‘the number and types of private insurance plans offered (if any), premiums, contributions by employers and employees, eligibility requirements, benefits associated with these plans, and employer characteristics'. The MPC provides information regarding ‘dates of visits/services, use of medical care services, charges and sources of payments and amounts, and diagnoses and procedure codes for medical visits/encounters’.
MEPS also serves as a good dataset due to concordance between self-reported health-care utilisation and provider reports. As Bhandari and Wagner (Reference Bhandari and Wagner2006) warn, self-reported data may lack accuracy and managing administrative data requires significant resources. Among the several suggestions, these scholars recommend shorter recall time (less than 12 months) and questionnaire design as factors that can affect accuracy. Fortunately, MEPS takes full advantage of these aspects by pre-testing data collection instruments, training interviewers and structuring field assignments to reduce the impact of length of recall. In addition, MEPS maintains utilisation records at both the household and provider level. Cohen and Wun's (Reference Cohen and Wun2005: 120) analysis of self-reported utilisation levels with provider records revealed ‘high levels of agreement between the two sources, and when there were differences, they were more likely to be characterised by household under-reporting of use’. More specifically, their analysis of household-reported counts for (a) hospital inpatient, (b) office-based doctor visits, (c) outpatient department and (d) emergency room visits found almost no difference when compared with provider events from the 10th to 90th percentile. In short, measurement error relating to self-reported utilisation is not as pronounced as with other datasets.
Analytic sample
This analysis pools cross-sections of the 2004 and 2005 HC data files, which correspond to H89 and H97. The overall response rates for these point-in-time, full-year consolidated HC files approximates 68.2 per cent for 2004 and 66.5 per cent for 2005. The extraction includes typical demographic variables (age, gender, marital status, race, Metropolitan Statistical Area, Census region), socio-economic characteristics (education, income, social security income), various health attributes (physical health, mental health, functioning, Body Mass Index (BMI), smoking) and several variables relating to health behaviours (having a USC, valuing the need for insurance). Since this analysis focuses on older adults, individuals younger than 65 years of age are excluded. Due to this, the overall pooled sample reduces from 9,538 observations to 3,128. Because the focus of this paper is on differences in utilisation by race for individuals with health coverage, those without Medicare (N=25) or without any type of health insurance (N=19) are removed. Lastly, to ensure this sample is representative of the general population, self-rated physical health and mental health scores that do not meet acceptable population ranges are excluded (see Hanmer et al. Reference Hanmer, Lawrence, Anderson, Kaplan and Fryback2006; Jakobsson Reference Jakobsson2007; Larson et al. Reference Larson, Schlundt, Patel, Hargreaves and Beard2008). The final dataset consists of 2,525 observations with 303 corresponding to Black and 2,222 corresponding to White (see Table 1).
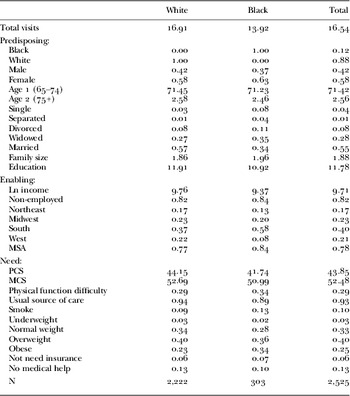
Descriptive statistics by race (mean)

Notes: MSA: Metropolitan Statistical Area. PCS: Physical Component Summary. MCS: Mental Component Summary.
Measures
Before developing the analysis, defining and operationalising key variables will aid in understanding the results and limitations of this research. The main variables of interest are Total Visits and Physical Component Summary (PCS) with respect to Black/White. MEPS uses the Short-Form 12 version 2 (SF-12v2) to provide two distinct measures of self-rated health – PCS and Mental Component Summary (MCS) (see Ware, Kosinski and Keller Reference Ware, Kosinski and Keller1996). The 12-item form focuses on general health, mobility, physical health, emotional problems, pain, anxiety, depression and social activities. A recent analysis by Cheak-Zamora, Wyrwich and McBride (Reference Cheak-Zamora, Wyrwich and McBride2009) evaluated the reliability and validity of SF-12v2 in MEPS. Results suggest both PCS and MCS scores have high internal consistency reliability and high to moderate test–retest reliability. The advantages of using PCS and MCS relate to not only the broad dimensions of health encompassed in the SF-12 or high reliability, but these measures are also continuous. In other words, typical self-rated health variables generally fall into categories (i.e. excellent, good, fair or poor). As such, the researcher is limited in selecting regression models when self-rated health is the dependent variable. If it is an independent variable, dummy variables need to be constructed and, in some cases, information can be lost. MEPS is among the very few nationally representative, panel datasets with a continuous self-rated health measure.
Although some scholars may have reservations in using the PCS and MCS measures since the SF-12 was derived from a largely homogeneous sample of Whites, recent work by Larson et al. (Reference Larson, Schlundt, Patel, Hargreaves and Beard2008) suggests otherwise. Their analysis shows construct, convergent, discriminate and concurrent validity are satisfactory and ‘the SF-12 appears to be a valid measure for assessing the health status of low-income African Americans’ (Larson et al. Reference Larson, Schlundt, Patel, Hargreaves and Beard2008: 1). Other scholars have also found the SF-12 to be reliable in low-income, minority populations (Franks et al. Reference Franks, Lubetkin, Gold and Tancredi2003) and community-dwelling older African Americans (Cernin et al. Reference Cernin, Cresci, Jankowski and Lichtenberg2010).
Dependent variable
Utilisation is operationalised as the number of visits to access medical services. Specifically, these are ‘encounters that took place primarily in office-based settings and clinics. Care provided in other settings such as a hospital, nursing home, or a person's home are not included in this category’ (MEPS codebook) see http://meps.ahrq.gov/mepsweb/data_stats/data_overview.jsp. This author sums Office-based Physician and Office-based Provider Visits to measure utilisation and this new variable, denoted Total Visits, encompasses visits to physician, non-physicians and unknown.
Independent variables
Other key variables refer to Usual Source of Care, Do Not Need Health Insurance, Overcome Illnesses Without Medical Help and Obesity. Initially, the author extracted Insurance Status, which refers to the respondent being covered for medical services (such as hospitalisation, surgery, prescriptions) and belonging to a health maintenance organisation, private plan, Medicare or any other type of provider. However, this variable is not in any of the models since the entire sample maintains insurance. Of course, this is to be expected since all individuals are at least 65 years of age. Usual Source of Care refers to the particular ‘medical person, doctor's office, clinic, health center, or other place a person would usually go to if he or she was sick or needed advice about his or her health’ (MEPS glossary) http://meps.ahrq.gov/mepsweb/data_stats/data_overview.jsp. This dummy variable is coded 0=No USC and 1=USC. Do Not Need Health Insurance is an important attitude/behaviour measure. Respondents are asked if they ‘do not need insurance’ and replies are coded as disagree strongly, disagree somewhat, uncertain, agree somewhat and agree strongly. In general, over 80 per cent of respondents answer disagree strongly or disagree. As such, the five categories are recoded into a dummy variable, which is listed as Not Need Insurance, with those responding uncertain or disagree as 0=need insurance and those responding agree as 1=do not need insurance. Overcome Illness Without Medical Help is another important attitude/behaviour measure. Respondents are asked if they ‘can overcome an illness without seeking medical services’ and replies are coded similar to the Do Not Not Need Insurance question. In general, over 80 per cent of respondents answer disagree strongly or disagree. Once again, the five categories are recoded into a dummy variable, which is listed as No Medical Help, with those responding uncertain or disagree as 0=need medical help and those responding agree as 1=do not need medical help.
Lastly, the Obesity measure provides some insight into respondents' adipose health. This continuous measure is constructed into four categories based on BMI: Underweight, Normal weight, Overweight and Obese. These categories are formulated from the 1998 guidelines established by the National Institutes of Health and the Centers for Disease Control and Prevention. BMI requires information on weight (in kilograms) and height (in inches) and is calculated as: weight (kg)/(height (m)2). An adult is considered Underweight when BMI <18.5, Normal weight from 18.5 to 25, Overweight from 25 to 30 and Obese when BMI >30. For this analysis, the reference or modal category is Overweight. Many well-regarded studies show the negative association between BMI and health utilisation. As a case in point, consider the work by Drury and Louis (Reference Drury and Louis2002). Employing a questionnaire framework, these scholars find stigmas of obesity act as barriers to seeking health care and an increase in body weight is associated with delay in receiving care. Subsequent work by Amy et al. (Reference Amy, Aalborg, Lyons and Keranen2006), Brown et al. (Reference Brown, Thompson, Tod and Jones2006) and Puhl and Heuer (Reference Puhl and Heuer2009) shows overweight and obese individuals receive bias not only from general practitioners and physicians, but also nurses, medical students, dietician and even fitness professionals. Given past and current research, this is an important control variable.
Analytic strategy
Discrete data: Negative Binomial, Poisson and Quantile Regression
The paper contributes to the existing body of literature by adding important health behaviour/belief measures lacking in previous studies and modelling health utilisation employing Quantile Regression (QR). With this approach, the researcher can compare how Blacks/Whites differ across the entire distribution and this is demonstrated in Table 2 with Negative Binomial (NB) estimates presented along with QR estimates at the 25th, 50th, 75th and 90th percentiles (see Hao and Naiman Reference Hao and Naiman2007; Koenker Reference Koenker2004, Reference Koenker2005; Winkelmann Reference Winkelmann2008). Although a large body of literature exists on health utilisation, few researchers have undertaken such an analysis for older adults. Some of this can be attributed to issues involving small sample size and limitations of statistical packages. Previously, much of health utilisation research employed count models, such as Poisson or NB, to examine medical visits. The Poisson model takes the following form:
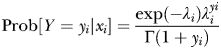 $${\rm Prob[}Y = y_i |x_i {\rm ]} = \displaystyle{{\exp ( - \lambda _i )\lambda _i^{yi}} \over {\Gamma (1 + y_i )}}$$
where λ i=exp(α+x i′β), y i=0, 1, …, i=1,…,N.
Quantile Regression and Negative Binomial (NB) comparison

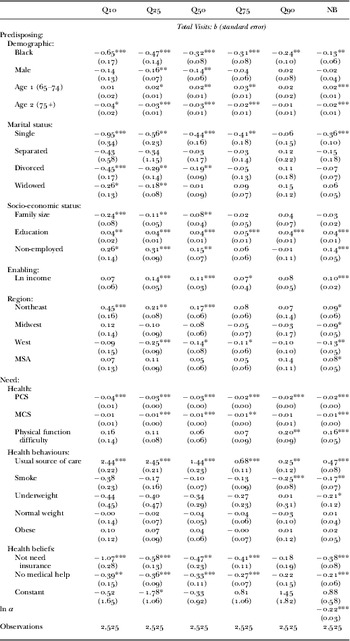
Notes: Modal categories: white, female, married, south, overweight. Age 1 is spline with 65–74 years and Age 2 is spline with 75+. Q: quantile. MSA: Metropolitan Statistical Area. PCS: Physical Component Summary. MCS: Mental Component Summary.
Significance levels: * p<0.10, ** p<0.05, *** p<0.01.
With the Poisson, the log-linear conditional function equals the variance, which is E[y i|x i]=Var[yi|xi]=λ i. Since this fails to account for over-dispersion, researchers opt to use the more flexible NB model, which takes the following form:
 $${\rm Prob[}Y = y_i {\rm |}x_i {\rm ]} = \displaystyle{{{\rm \Gamma (}\theta \lambda _i + y_i {\rm )}q^{\theta \lambda _i} (1 - q)^{yi}} \over {{\rm \Gamma (}1 + y_i {\rm )\Gamma} (\theta \lambda _i )}}$$
where y i=0,1,…, q=1/(1+θ).
With NB, the conditional mean remains E[y i|x i]=λ i; however, the Var[y i|x i]=λ i [1+(1/θ)λ iP−1]. An early paper by Winkelmann (Reference Winkelmann2004) shows the NB and the Probit-Poisson-log-normal are considerably superior to Poisson based on the log-likelihood. The Schwartz Information Criterion, which accounts for a difference in the number of estimated parameters, yields a similar conclusion. In other words, models that take unobserved heterogeneity into account perform much better. Winkelmann's (Reference Winkelmann2004) study is among a small group that examines utilisation across the entire distribution function and his findings suggest varying effects for the lower and upper part. Greene (Reference Greene2008) also examines doctor visits using the German Socio-economic Panel and finds different functional forms of NB outperform Poisson based on the likelihood ratio test.
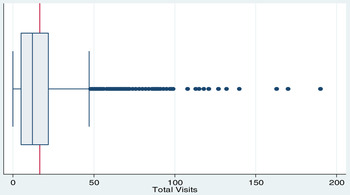
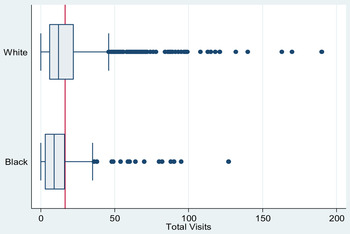
Although NB is a superior modelling framework for health utilisation, it does not uncover how this utilisation varies across the distribution function. Moreover, this approach does not work well if the underlying process for the outcome variable contains many outliers (see Figures 1 and 2). In other words, NB may not be the best approximation for a skewed-location distribution (see Koenker and Geling Reference Koenker and Geling2001). In contrast, QR is robust to outliers and scale effects since the estimation minimises least absolute deviation. This is represented as:
 $$\beta (\tau ) = {\rm argim}1/n\sum\nolimits{\rho_\tau} (Y_i - Xi'b).$$
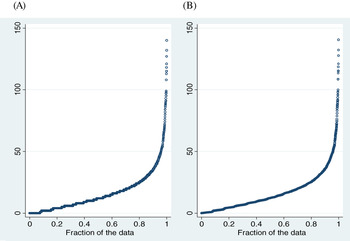
QR transforms the conditional distribution function into segments (or quantiles). This transformation, denoted T(z i, α), and the conditional α-quantile of z, denoted Qz(α|x i), provides estimates for the entire conditional distribution function where 0<α<1 (Koenker and Bassett Reference Koenker and Bassett1978; Miranda Reference Miranda2006). For this to work, a sufficient precondition is the conditional distribution function, f(Y|x), is both continuous and positive. Since this cannot be satisfied with count data, Machado and Santos Silva (Reference Machado and Santos Silva2005: 1227) devised an alternative by ‘constructing a continuous random variable whose quantiles have a one-to-one relation with the quantiles of Y′. Building upon earlier work by Stevens (Reference Stevens1950) and Pearson (Reference Pearson1950), Machado and Santos Silva (Reference Machado and Santos Silva2005) propose adding a uniformly distributed random variable, denoted Z, to the dependent variable, Y, thereby artificially imposing continuity (see Figure 3). This is achieved by jittering with the following transformation, z=y+u where u~U(0,1) and then substituting this equation in the conditional quantile for counts, Qz(α|xi)=α+exp[xi′β(α)]. The end result is the following equation:
 $$Q_Z [\alpha {\rm |}{\bi x}] = Q_Y [\alpha {\bf |}{\bi x}] + \displaystyle{{\alpha - \mathop \sum \nolimits_{y = 0}^{QY(\alpha |{x})} {\rm Prob}(Y = y|{\bf x})} \over {{\rm Prob}(Y = Q_Y (\alpha |{\bf x})|{\bf x})}}$$
Boxplot of total visits. This plot shows a high degree of positive skewness.

Boxplot of total visits by race. This plot shows positive skewness for both Whites and Blacks.

(A) Without transformation (total visits as discrete data). (B) With transformation (total visits after transforming (or jittering) the discrete data to achieve a smooth, continuous function).

This process of ‘jittering’ can be implemented with any continuous distribution with support on [0,1) and can be employed to fully uncover a discrete distribution for empirical research (see Winkelmann's Reference Winkelmann2006 follow-up study). Such an iterative process employs linear programming rather than least squares or maximum likelihood estimation methods. As such, results cannot be interpreted in the same manner as ordinary least squares. Due to this, marginal effects are typically presented along with the direct estimates (see Tables 3 and 4).
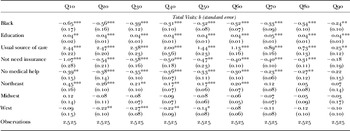
Entire quantile distribution for selected coefficients

Notes: Model includes all variables as in Table 2. However, only selected ones are shown for this nine quantile distribution. Q: quantile.
Significance levels: * p<0.10, ** p<0.05, *** p<0.01.
In non-technical and simplified terms, consider a situation with only two outcomes: no/yes or failure/success or zero/one (i.e. Bernoulli distribution). How does one convert this discrete data into continuous? By transforming the data where continuity is artificially constructed with a uniform random variable (i.e. process of jittering). Now, the distribution can be cut into various segments or, in technical terms, quantiles. Although there is no specific rule, scholars typically use either 10 or 25 per cent cut-offs and this has become the convention (see Trevidi and Munkin Reference Trivedi and Munkin2010). This analysis presents both series of cut-offs (see Tables 2 and 3). In terms of a formal model, this analysis can be depicted as:
 $$\eqalign{ & Total\,Visits = \alpha + \beta ({\rm Black}) + \delta ({\rm Demographic}) + \eta ({\rm Economic}\,{\rm Factors}) \cr & + \rho ({\rm Health}\,{\rm Attributes}) + \tau ({\rm Health}\,{\rm Beliefs}) + v({\rm Geography}) + \varepsilon} $$
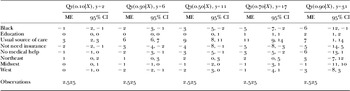
Marginal effects (ME) for selected coefficients with 95 per cent confidence interval (95% CI)

Notes: Model includes all variables as in Table 2, however, only selected ones are shown for this distribution. Q: quantile.
Equation (6) shows Total Visits (health services utilisation) is explained by race, matrix of demographic characteristics, economic factors, health attributes, health beliefs and Census region. Since the main independent variable of interest is a dummy variable for race (i.e. Black/White), the Results section provides interpretations based on marginal effects. This provides a comparison of how total visits (or utilisation rates) vary as race changes from White=0 to Black=1. All of the analysis is conducted using STATA 11 (StataCorp LP, College Station, Texas, USA; see the Appendix for step-wise procedures).
Results
Descriptive statistics
Total visits
Table 1 presents summary statistics by race. Overall, older adults maintain over 16 total visits during 2004–2005. However, there are differences between Whites and Blacks – Whites maintain nearly 17 visits while Blacks approximate only 14 visits.
Predisposing
In terms of gender, a larger percentage of Blacks are female (63% versus 58% for Whites). A greater percentage of Blacks also remain in a single state (8% versus 3% for Whites) and a significantly higher percentage is widowed (35% versus 27% for Whites). While only 34 per cent of Blacks are married, nearly 57 per cent maintain this status for Whites. As for education, the average level of education for Whites is high school while the average is less than high school for Blacks.
Enabling
As for economic characteristics, income approximates US $16,482 for the total sample. For Whites, this figure is $17,327 and merely $11,732 for Blacks. While a greater percentage of Whites maintain residency in the West (22% versus 8% for Blacks), a very large percentage of Blacks reside in the South (58% versus 37% for Whites). A higher percentage of Blacks also reside in Census-designated Metropolitan Statistical Areas (84% versus 77% for Whites).
Need
In terms of physical health (PCS), the overall sample approximates 43.85 with a standard deviation of 9.60. Whites are slightly above this with an average of 44.15, while Blacks fall significantly below the mean with an average of 41.74. In terms of mental health (MCS), the overall sample is fairly healthy with a mean of 52.48 and a standard deviation of 8.94. Once again, Whites are slightly above this with an average of 52.69, while Blacks fall below the mean with an average of 50.99. A poorer health profile for Blacks is also evident with a higher percentage being smokers (13% versus 9% for Whites). In addition, a significantly higher percentage of Blacks are obese (34% versus 23% for Whites). Finally, a lower percentage of Blacks maintain a USC.
Regression analysis
Outcome for Blacks
Results from the NB regression clearly reveal attenuated estimates (see Table 2). For example, the NB coefficient for Black equals −0.13 while the median QR estimates −0.32. This is a large and significant difference. The marginal effect from the NB estimate suggests Blacks are associated with just one fewer visit, ceteris paribus, while the median QR suggests Blacks maintain at least three fewer visits when compared against Whites (95% confidence interval (CI)=2, 5). This difference is much more dramatic when one examines the entire distribution, particularly the more extreme quantiles – this is the region with the greatest economic and health disparity (see DeNavas-Walt et al. Reference DeNavas-Walt, Proctor and Smith2011; Hao and Naiman Reference Hao and Naiman2007; Pleis et al. Reference Pleis, Ward and Lucas2010; Sharma Reference Sharma2009a, Reference Sharma2009b; US Census Bureau 2010). At the tenth quantile, the coefficient for Black equals −0.65 at α=0.01. The estimate remains robust to outliers and approximates −0.47 at α=0.01 at the 25th quantile. At the 75th quantile, the estimate attenuates to −0.31 at α=0.01 but is still much larger than the NB estimate. Overall, the marginal effects from the QR estimate suggest Blacks maintain at least two fewer visits and as many as 12 per year when compared to Whites, the reference group, even after controlling for age, education, employment, geographic region, income, marital status, obesity, smoking, USC and health behaviours/beliefs.
Predisposing
As expected and consistent with previous research, individuals with greater education utilise health services at higher levels. What is more surprising is its steady effect (see Table 3). Across the entire distribution, the estimate is 0.04 at α=0.01. In other words, education has a positive association and is robust to outliers across all nine quantiles. The estimated size also coincides with that from NB (see Table 2). In contrast to education, the marital states of single and divorced are associated with a negative impact on visits, as compared to the married reference group. This is also consistent with previous research and, to some degree, confirms the protective effect for those who remain married, all else equal.
In terms of gender, males are associated with fewer visits. However, this is only statistically significant at the 25th and 50th quantile for the QR and is not statistically significant in the NB.
Enabling
In this sample of older adults, income is associated with increased utilisation but the effect is not statistically significant at all quantiles. It is only noteworthy at the 25th, 50th and 75th quantiles. In contrast, income is highly significant in the NB.
Need
USC is the most prominent variable. This estimate is robust to outliers and approximates over 2.00 at α=0.01 for the lower quantiles. In terms of a marginal effect, individuals with a USC maintain nearly nine additional visits (95% CI=8, 11). This re-affirms the importance of having a regular provider. That is, a medical practitioner who is familiar with the patient's history and, as a result, understands what treatments and interventions may be most effective. Although supported by NB and highly significant at α=0.01, the estimate is drastically attenuated with an estimate of only 0.47. NB results do not signify the importance of having a USC for older adults for over 70 per cent of the distribution (see Table 3).
Not Need Insurance and No Medical Help also play an important role in utilisation. The estimate for Not Need Insurance equals −1.07 at the tenth quantile, decreases to −0.54 for the 20th, and remains close to −0.50 for the first half of the distribution (see Table 3). The marginal effect suggests those who believe insurance is unnecessary are associated with four fewer visits (95% CI=1, 8). Although slightly lower, NB estimates suggest a similar outcome. The estimate for No Medical Help equals −0.39 at the tenth quantile and remains below −0.33 for the first half of the distribution. The marginal effect suggests those who believe medical help is unnecessary are associated with three fewer visits (95% CI=1, 5). With an estimate of −0.21, the NB result is attenuated and does not reveal the importance of this measure for the bulk of the distribution function.
Older adults in better health, as measured by PCS, are associated with fewer visits. This is the expected direction for this variable. However, the estimate is small with a value of nearly −0.03. NB yields a similar result. The BMI indicators are surprising since none are statistically significant for any of the quantiles or from the NB model.
Discussion
QR versus NB
The NB framework is an appropriate choice in the absence of skewed data. However, if scale and location effects are of concern, then NB will provide attenuated estimates. In such instances, researchers should opt for the more flexible QR. As seen in Tables 2 and 3, NB underestimates total visits for Blacks. If policy analysts are relying on results from the NB framework to make decisions regarding health planning/funding for minority populations, then resources will be under-allocated to under-served and poor communities (i.e. the lower quantiles). Comparison with QR further shows NB underestimates total visits for Single, Usual Source of Care, Not Need Insurance and No Medical Help. For under-served and poor sub-groups, the importance of USC cannot be overstated. This physician/clinician not only provides important health services, but may also serve as a communication link to social programmes and services. As for Not Needing Insurance or No Medical Help, results from QR suggest individuals who maintain such views have at least five fewer visits even after controlling for demographic, SES and health characteristics.
Policy implications
Results from the NB and QR suggest disparities in health outcomes and utilisation seem to persist even after controlling for predisposing, need and enabling factors. So, can anything be done? If yes, would these be cost-effective strategies given state budget shortfalls and increasing health-care costs? One important consideration relates to not just education but health literacy. Health literacy may promote better health outcomes and health service utilisation. Recent work by Cho et al. (Reference Cho, Arozullah, Crittenden and Lee2008) finds health literacy to have direct effects – an interesting conclusion given these researchers expected to find indirect effects. In this context, health literacy means the capacity of individuals to obtain, process and understand basic health information. Cho et al. (Reference Cho, Arozullah, Crittenden and Lee2008: 1814) suggest ‘improving health literacy may be the most effective and direct approach for improving the health status and reducing hospital and emergency room use among elderly patients’. Health literacy can very easily be augmented into the Medicare Annual Wellness Visit and reinforced with on-line tutorials and interactive sessions.
Another important policy consideration relates to sustained continuity of care (SCOC). In this context, SCOC refers to an established, long-term relationship with the same health provider. Cabana and Jee (Reference Cabana and Jee2004) conducted a thorough review of Medline from 1966 to 2002, Educational Resources Information Center and PSYCH INFO to determine if increases in SCOC have any negative impact on quality care. Their findings suggest SCOC is associated with decreased hospitalisations, improved preventive services and greater patient satisfaction. This is a worthwhile point given nearly 89 per cent of Blacks and 94 per cent of Whites indicate having a USC in this author's analysis of MEPS data files. As Cabana and Jee (Reference Cabana and Jee2004) highlight, SCOC promotes a relationship with the health provider and, through the course of time, the provider may acquire more information about the patient and be better able to manage illness. Saultz and Lochner (Reference Saultz and Lochner2005) conduct a similar investigation. Although they are more rigorous in scrutinising the methodology used to examine continuity of care and health outcomes, they suggest a good likelihood of a positive outcome.
Results from Xu's (Reference Xu2002) analysis can be implemented to further alleviate disparities in health services utilisation for older adults. More specifically, the possibility that a regular site can be as effective as a regular doctor means a consistent place for the delivery of health can increase utilisation. This approach can be complemented by recommendations from Shenson and Adams (Reference Shenson and Adams2008) and Shenson et al. (Reference Shenson, Anderson, Slonim and Benson2012). These scholars suggest ‘special work sites, school sites and even polling places can provide convenient points of care for traditional populations that have yet to be reached’ (Shenson et al. Reference Shenson, Anderson, Slonim and Benson2012: 169). Ogden, Richards and Shenson (Reference Ogden, Richards and Shenson2012) arrive at a similar conclusion and claim reductions in health disparities, as well as decreases in health spending, can be achieved through personal health systems. These scholars emphasise that many preventive services have flexible modes of delivery and collaborative models of care can expand services to areas where adults play, learn and worship.
Limitations
Although MEPS serves as a rich dataset for health-care analysis due to its (a) large sample size, (b) continuous measures for self-rated health, and (c) high concordance between self-reported health-care utilisation and provider reports, there are a few limitations. For one, MEPS does not maintain a robust set of variables related to cultural beliefs. Incidentally, this is also a common short-coming of other datasets. As a case in point, consider the early qualitative study by Bailey (Reference Bailey1987). This study finds socio-cultural factors influence health care-seeking behaviour among Blacks and in order to have successful interventions that promote health, educators need to recognise ‘the attitudes and techniques [i.e., self-care] by which individuals assume responsibility for maintaining health and treating illness’ (Bailey Reference Bailey1987: 391). Hartley (Reference Hartley2004) provides a good overview of health disparities with respect to rural cultural values and how such values may be unique to towns and regions. McLaughlin and Braun (Reference McLaughlin and Braun1998) utilise their expertise as health professionals and researchers to illustrate Asian and Pacific Islander cultural values in health-care decision-making. More specifically, this study defines collective versus individual identity and then explores such concepts as filial piety, silent communication and preservation of harmony. These scholars examine how Chinese, Filipino, Hawaiian, Japanese, Samoan and Vietnamese cultural expectations shape health care-seeking behaviours. A recent article by Al-Bannay et al. (Reference Al-Bannay, Jarus, Jongbloed, Yazigi and Dean2013) addresses the importance of cultural attitudes and preferences in understanding health promotion. These scholars cite social stigmas associated with mental health in East Asian and Middle Eastern cultures as examples of diagnoses that are often unreported to health-care providers. This work and the aforementioned studies argue for variables that provide an index or ordinal categorisation of cultural values, which could aid researchers in better understanding the mechanisms involved in health-care utilisation and promotion.
Future directions/contributions
Ageing scholars can employ the analytical framework from this paper to better understand disparities in health status and health services utilisation based on race/ethnicity, income, religion, rural/urban status or any other measure. For example, a recent article by Mills et al. (Reference Mills, Ataguba, Akazili, Borghi, Garshong, Makawia, Mtei, Harris, Macha, Meheus and McIntyre2012) examined equity in financing and use of health care in Ghana, South Africa and Tanzania. Results suggest the ‘overall distribution of service benefits in all three countries favoured richer people, although the burden of illness was greater for lower-income groups [and] access to needed, appropriate services was the biggest challenge’ (Mills et al. Reference Mills, Ataguba, Akazili, Borghi, Garshong, Makawia, Mtei, Harris, Macha, Meheus and McIntyre2012: 126). To better understand disparities in access and utilisation, scholars can apply a quantile framework to uncover how this varies across the entire income distribution. Recent work by Fan et al. (Reference Fan, Wen, Jin and Wang2013) serves as another good example. These scholars examine disparities in health-care utilisation due to differences in gender and migration status in China. Results suggest female migrants encounter significant barriers to health-care access and often cite lack of money as a reason for not seeking care. As with the study by Mills et al. (Reference Mills, Ataguba, Akazili, Borghi, Garshong, Makawia, Mtei, Harris, Macha, Meheus and McIntyre2012), a future direction may be to apply a quantile framework to uncover how this varies across the entire distribution and where scarce resources should be first allocated.
Conclusion
In this paper, the author constructed an alternative and more flexible model to examine older adult disparities in health services utilisation by race. In addition, this behavioural model was extended by adding two, important covariates: (a) need for medical insurance and (b) usefulness of medical intervention. Results show disparities continue to persist despite significant investments and interventions in public health. Moreover, such differences are more pronounced at and below the median quantile. Policy analysts must be aware of this aspect and this research should further such a dialogue, particularly given Health Exchanges and the Affordable Care Act.
Finally, if we are to improve population health and enhance the quality of life for older adults, then finding ways to increase delivery of health services to minority groups is a logical starting point. For one, efforts to augment health literacy can have pronounced and immediate effects. Equally important, collaborative models of health-care delivery, which are quite flexible, can be implemented in low-income and traditionally under-served communities.
Acknowledgement
I would like to thank Christina Victor/Miles Lambert/editorial team and the reviewers for helpful comments.
Appendix
Using Qcount framework in Stata
Step 1. Introduce jittering with the following transformation, z=y+u where u~U(0,1).
Step 2. Substitute this equation in the conditional quantile for counts, Qz(α|xi)=α+exp[xi′β(α)].
Step 3. Set the seed as to reproduce the same sample.
Step 4. Define the quantile, α, to be estimated (e.g. α=0.10, α=0.20, etc., where 0<α<1).
Step 5. Establish the number of repetitions; this will be the number of jittered samples used to estimate the parameters (e.g. repetitions may be 100, 500, 1,000, etc.).
Step 6. If needed, obtain the marginal effects to make interpretation of the estimates easier.