

INTRODUCTION
The penultimate glacial period (~185–135 ka) corresponds to Marine Oxygen Isotope Stage (MIS) 6 and to the late Saalian glaciation in Europe (Ehlers et al., Reference Ehlers, Grube, Stephan and Wansa2011). The Saalian glaciation was characterized by two major glacial advances, the more extensive Drenthe followed by the Warthe, both greater in extent than that during the last glacial maximum (Ehlers et al., Reference Ehlers, Grube, Stephan and Wansa2011). Global sea-level reconstructions (Thompson and Goldstein, Reference Thompson and Goldstein2006; Elderfield et al., Reference Elderfield, Ferretti, Greaves, Crowhurst, McCave, Hodell and Piotrowski2012) indicate a sea-level drop of more than 100 m toward the end of MIS 6 (after 150,000 yr). Sea surface temperatures were 5°C lower than present as the climate approached a stable maximum glacial state, culminating in one of the largest Quaternary glaciations (Margari et al., Reference Margari, Skinner, Hodell, Martrat, Toucanne, Grimalt, Gibbard, Lunkka and Tzedakis2014).
Long pollen sequences show that a moderately severe climate with fluctuating tree abundances prevailed in the early part of MIS 6 in Europe. This was followed by more extreme conditions marked by a mainly treeless landscape in the latest part of MIS 6 (Roucoux et al., Reference Roucoux, Tzedakis, Lawson and Margari2011). In the late MIS 6, a polar desert existed south of the ice margin, while the rest of Europe was under discontinuous herbaceous plant cover, predominantly Artemisia, chenopods, and grasses (Roucoux et al., Reference Roucoux, Tzedakis, Lawson and Margari2011). In some sheltered areas of southern Mediterranean Europe, scattered temperate tree populations survived in refuges where temperature variations were not extreme and precipitation was sufficient (Bennett et al., Reference Bennett, Tzedakis and Willis1991; Tzedakis, Reference Tzedakis1993; Roucoux et al., Reference Roucoux, Tzedakis, Lawson and Margari2011). A vegetational north–south gradient existed across the Iberian Peninsula, with conifers mainly in the north, whereas deciduous trees were present further south with evergreens in the extreme south and coastal lowlands (Van Andel and Tzedakis, Reference Van Andel and Tzedakis1996).
Only a very few archaeopaleontological sites in southwestern Mediterranean Europe document the terrestrial faunas of the penultimate glacial. MIS 6 is said to have permitted the entrance in the Iberian Peninsula across the Strait of Gibraltar because of a much lower sea level and the appearance of temporary islands and some reptiles such as present populations of the snake Malpolon monspessulanus (Carranza et al., Reference Carranza, Arnold and Pleguezuelos2006), together with the probable first entrance from the north of cold-adapted large mammals such as Coelodonta antiquitatis and Rangifer tarandus (Álvarez-Lao and García-García, Reference Álvarez-Lao and García-García2006, Reference Álvarez-Lao and García-García2010). Small vertebrate studies in southwestern Europe for MIS 6 have been undertaken at Sala de los Huesos in the Cueva de Maltravieso (Extremadura, western Spain; Hanquet, Reference Hanquet2011) and the Grotte du Lazaret (Nice, Alpes-Maritimes) and Baume Moula-Guercy (Soyons, Ardèche), both in southeastern France (Lumley et al., Reference Lumley, de, Echassoux, Bailon, Cauche, Marchi, de, Desclaux and El Guennouni2004; Valensi et al., Reference Valensi, Aouraghe, Bailon, Cauche, Combier, Desclaux and Gagnepain2005, Reference Valensi, Bailon, Michel, Desclaux, Rousseau, Genty, Blamart, Onoratini and Lumley2007; Hanquet et al., Reference Hanquet, Valensi, Bailon, Desclaux, El Guennouni, Roger and de Lumley2010; Manzano, Reference Manzano2015). The aim of the present article is to describe the amphibian and reptile fossil remains recovered in site H-02 of Estanque de Tormentas de Butarque (ETB) (Villaverde, Madrid). This allows a precise analysis of their implications for the past climatic and environmental conditions that prevailed in the central Iberian Peninsula during the penultimate glacial.
GEOLOGIC AND CHRONOLOGICAL SETTING
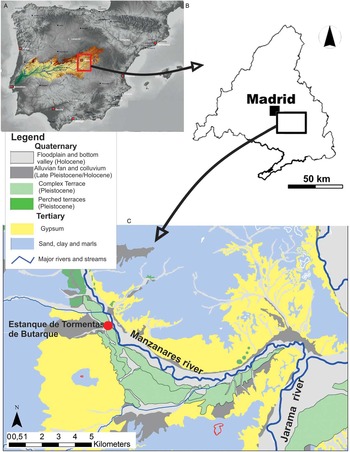
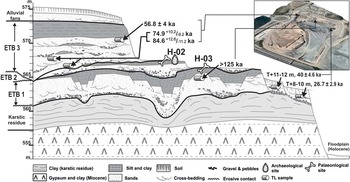
The archaeological sites H-02 and H-03, located in the municipality of Villaverde, south of Madrid, lie within the Complex Terrace of Butarque (CTB; Fig. 1; Goy et al., Reference Goy, Pérez-González and Zazo1989). The CTB is a unique morphostratigraphic unit composed by various terraces at +12–15 and +18–20 m above the present floodplain that have delivered numerous paleontological and archaeological sites in primary position (Pérez-González et al., Reference Pérez-González, Rubio Jara, Panera and Uribelarrea2008). The construction of a huge storm-water management reservoir covering and area of 7 ha (~800 m long and 600 m wide) and a depth of 30 m exposed the CTB complete stratigraphic sections that were hundreds of meters in length. This exposed the underlying Miocene interbedded gypsum and clay layers in the fluvial terraces, which offered a unique opportunity to define the complex stratigraphy of this terrace on the Manzanares River and to locate important new archaeological and paleontological sites (De los Arcos Fernández et al., Reference De los Arcos Fernández, Gallego Lletjós, Gil Ortiz, González García and Sainz de los Terreros2008, Reference De los Arcos Fernández, Gallego, Gil, González and Yravedra2011; Álvarez Catalán et al., Reference Álvarez Catalán, De los Arcos Fernández, Gallego Lletjos, Gil Ortiz, González García, Herráez Igualador, Ruiz Zapata and Yravedra Sanz de los Terreros2009). Although the whole deposit is mainly composed of sand, the occurrence of gravel units over disconformities allows three fluvial sequences to be defined. From the base upward, these include ETB 1, ETB 2, and ETB 3 (Fig. 2). These units are affected by synsedimentary and postsedimentary deformation because of the dissolution and loss of volume of the evaporites in the underlying Miocene formation. Although the gypsum is dissolved, the clay layers stack upon each other, creating a karstic residue of 3–4 m thickness underneath the terrace (Uribelarrea, Reference Uribelarrea2008). The lower units exhibit the greatest deformation, and all of them are progressively tilted toward the west (Silva et al., Reference Silva, López-Recio, Cuartero, Baena, Tapias, Manzano, Martin, Morín de Pablos and Roquero2012, Reference Silva, López-Recio, Tapias, Roquero, Morín de Pablos, Rus, Carrasco-García, Giner-Robles, Rodríguez-Pascua and Pérez-López2013).
(color online) Geographic and geologic location of the middle Pleistocene archaeological site of Estanque de Tormentas de Butarque (Madrid, central Spain).

(color online) Complete cross section of the Complex Terrace of Butarque (Estanque de Tormentas de Butarque [ETB]) and the Miocene substratum underneath. Upper right, 3-D image of the storm water management reservoir and the exact position (X, Y, Z) of thermoluminescence (TL) samples. The 3-D image was composed with the satellite image of 2006 and digital terrain model light detection and ranging (resolution=5 m). Source: Consejería de Medio Ambiente y Ordenación del Territorio, Cartografía de la Comunidad de Madrid, and Centro Nacional de Información Geográfica, Instituto Geográfico Nacional.

The earliest fluvial sequence (ETB 1) is about 4–5 m thick, with 0.5–0.8 m of gravels at the base, 2.5–3 m of sand, and 1–2 m of overbank sediments on top. Karst processes result in dozens of faults along sequence ETB 1. Site H-03 is in the overbank unit located on top of ETB 1. Although ETB 1 is highly faulted, this layer is traceable for more than 100 m. This is important for obtaining a good record of paleontological remains, as H-03 has a low density of fossils. A small number of micromammals and also a greater number of large mammals have been recovered (Laplana et al., Reference Laplana, Herráez, Yravedra Saínz de los Terreros, Bárez, Rubio-Jara, Panera, Rus and Pérez-González2015). These include three rodents (Arvicola sp., Microtus sp., and Apodemus sp. gr. A. sylvaticus–A. flavicollis), one lagomorph (Oryctolagus cuniculus), two artiodactyls (Cervus elaphus and Bos primigenius), and three perissodactyls (Stephanorhinus sp., Equus ferus, and Equus hydruntinus). The sands below H-03 have been dated using thermoluminescence (TL) methods and yield an age of >125 ka (Domínguez Alonso et al., Reference Domínguez Alonso, De los Arcos Fernández, Ruiz-Zapata and Gil-García2009).
The middle fluvial sequence, ETB 2, is <1.5 m thick and is composed of a unit of gravels (up to 0.5 m), inset into the lower unit ETB 1, creating a wide disconformity. ETB 2 continues with coarse sand grading into laminated clay of overbank origin. Site H-02 is located in the clays at the top of ETB 2 (Domínguez-Alonso et al., Reference Domínguez Alonso, De los Arcos Fernández, Ruiz-Zapata and Gil-García2009) with the largest bones lying in sandy bars below. The whole unit disappears westward (Fig. 2). This unit has been dated on the basis of lithic industries and vertebrate remains (De los Arcos Fernández et al., Reference De los Arcos Fernández, Gallego Lletjós, Gil Ortiz, González García and Sainz de los Terreros2008; Laplana et al., Reference Laplana, Herráez, Yravedra Saínz de los Terreros, Bárez, Rubio-Jara, Panera, Rus and Pérez-González2015). Large mammal fossils include Canis lupus, Palaeoloxodon antiquus, Stephanorhinus sp., Equus ferus, Equus hydruntinus, Bos primigenius, Bison priscus, Cervus elaphus, and Sus scrofa (De los Arcos Fernández et al., Reference De los Arcos Fernández, Gallego Lletjós, Gil Ortiz, González García and Sainz de los Terreros2008; Álvarez Catalán et al., Reference Álvarez Catalán, De los Arcos Fernández, Gallego Lletjos, Gil Ortiz, González García, Herráez Igualador, Ruiz Zapata and Yravedra Sanz de los Terreros2009). Small mammal fossils include Erinaceus sp., Crocidura cf. C. russula, Allocricetus bursae, Arvicola cf. A. sapidus, Microtus arvalis, Microtus brecciensis, Apodemus sp. gr. A. sylvaticus–A. flavicollis, Eliomys quercinus, Oryctolagus cuniculus, and Lepus sp. (Laplana et al., Reference Laplana, Herráez, Yravedra Saínz de los Terreros, Bárez, Rubio-Jara, Panera, Rus and Pérez-González2015). Laplana et al. (Reference Laplana, Herráez, Yravedra Saínz de los Terreros, Bárez, Rubio-Jara, Panera, Rus and Pérez-González2015) suggest a late middle Pleistocene age (MIS 6) for H-02 (ETB) because of the occurrence of the proboscidean Palaeoloxodon antiquus together with the rodent Microtus brecciensis. P. antiquus is a species present in the middle Pleistocene to early Late Pleistocene terraces of the Manzanares and Jarama Rivers to the southeast of Madrid (Sesé and Soto, Reference Sesé and Soto2002a, Reference Sesé and Soto2002b). The latest record of M. brecciensis in the Iberian Peninsula is probably from Sala de los Huesos in the Cueva de Maltravieso (Cáceres, western Spain), dated to MIS 6 or, with less probability, to the base of MIS 5 (Hanquet, Reference Hanquet2011). Such a chronological interpretation is also supported by the presence of Microtus arvalis in H-02 (ETB), a species that has recently appeared in small-mammal associations from other localities of the Jarama and Manzanares River terraces. The record of M. arvalis from H-02 (ETB) may represent the oldest for this species in the area (Laplana et al., Reference Laplana, Herráez, Yravedra Saínz de los Terreros, Bárez, Rubio-Jara, Panera, Rus and Pérez-González2015). In addition, Laplana et al. (Reference Laplana, Herráez, Yravedra Saínz de los Terreros, Bárez, Rubio-Jara, Panera, Rus and Pérez-González2015) stress that the occurrence in H-02 (ETB) of both M. arvalis and Bison priscus suggests cold climatic conditions, later than MIS 8, documented in other localities in the area such as Valdocarros (Panera et al., Reference Panera, Torres, Pérez-González, Ortiz, Rubio-Jara and Uribelarrea del Val2011; Sesé et al., Reference Sesé, Panera, Rubio-Jara and Pérez-González2011). Thus, this would constitute an additional argument that H-02 (ETB) formed during MIS 6.
The uppermost fluvial sequence, ETB 3, is a complex unit, composed of a thick succession of fluvial bars, with some gravel channel lenses. Erosion has partially removed the top of ETB 2, so the sandy terms of ETB 2 and ETB 3 merge with each other, making it difficult to establish their limits. The fluvial sequence finishes with a 2-m-thick layer of silts and clays. TL samples taken from the base of ETB 3 and from deposits at 2 m and 7 m yield ages of 84.6+12.6/−11.2, 74.9+10.2/−9.2, and 56.8±4 ka, respectively (Domínguez Alonso et al., Reference Domínguez Alonso, De los Arcos Fernández, Ruiz-Zapata and Gil-García2009). This corresponds to the end of MIS 5a or the beginning of MIS 4. The upper part of ETB 3 is covered by alluvial fans, fed during the Late Pleistocene by small tributaries from the southwest.
Finally, three fluvial incisions partially eroded ETB (Fig. 2), leaving terraces at +11–12 m (40±4.6 ka), +8–10 m (26.7±2.9 ka), and the Holocene and contemporary floodplain (Domínguez Alonso et al., Reference Domínguez Alonso, De los Arcos Fernández, Ruiz-Zapata and Gil-García2009).
MATERIAL AND METHODS
Systematic paleontology
The paleontological and archaeological material from the site of ETB is stored under registration number 2006/24 in the collections at the Museo Arqueológico Regional de la Comunidad de Madrid (MAR) in Alcalá de Henares (Madrid, Spain). The amphibian and squamate fossil remains consist mostly of disarticulated elements collected by water screening the sediments obtained during the archaeological excavations at the site of H-02 (ETB) in 2006. Considerable distances separated the samples, and because of this, a minimum number of individuals (MNI) value has been established for each of them. The general taxonomical criteria mainly follow Szyndlar (Reference Szyndlar1984), Bailon (Reference Bailon1991, Reference Bailon1999), Gleed-Owen (Reference Gleed-Owen2000), and Blain (Reference Blain2005, Reference Blain2009). Comparisons were drawn using the dry skeleton collections from the Museo Nacional de Ciencias Naturales (MNCN, Madrid, Spain) and Blain’s personal collections stored at Institut Català de Paleoecologia Humana i Evolució Social (Tarragona, Spain).
Climatic and environmental reconstructions
Paleoclimatic interpretations are based on the presence of herpetofaunal species from site H-02 (ETB). The quantitative climate reconstruction method mutual climatic range (MCR; Blain et al., Reference Blain, Bailon, Cuenca-Bescós, Arsuaga, Bermúdez de Castro and Carbonell2009) used to help quantify paleotemperatures and paleoprecipitation has recently been proposed under the denomination Universal Transverse Mercator (UTM)–MCR method (Lyman, Reference Lyman2016) and then renamed mutual ecogeographic range (MER; Blain et al., Reference Blain, Lozano-Fernández, Agustí, Bailon, Menéndez, Espígares Ortiz and Ros-Montoya2016). This does not correspond to MCR methods but more closely resembles the modern analogue technique. The MER method involves simply the identification of a geographic region (divided into 10×10 km UTM squares) in which all of the species present in a given archaeological level currently live. Analysis of the MER of each archaeological level is based on distribution atlases available for Iberian herpetofauna (Godinho et al., Reference Godinho, Teixeira, Rebelo, Segurado, Loureiro, Álvares, Gomes, Cardoso, Camilo-Alves and Brito1999; Pleguezuelos et al., Reference Pleguezuelos, Márquez and Lizana2004) and various climatic maps of the Iberian Peninsula (Ninyerola et al., Reference Ninyerola, Pons and Roure2005). A total of 26 climatic parameters have been calculated for this study. The record from weather station 3182E of Arganda ‘Comunidad’ (Ninyerola et al., Reference Ninyerola, Pons and Roure2005), located close to the archaeological locality, has been used for comparison with current data.
The habitat weighting method (Blain et al., Reference Blain, Bailon and Cuenca-Bescós2008) has been used to reconstruct paleoenvironments. This method involves the distribution of each amphibian and reptile taxon into five types of habitat (dry and wet meadows, woodland-edge areas, areas surrounding water, and rocky areas) in accordance to where they are presently found in the Iberian Peninsula (Table 1). Modern data for distribution come from Salvador (Reference Salvador1997, Reference Salvador2014), Carrascal and Salvador (Reference Carrascal and Salvador2002–2016), García-París et al. (Reference García-París, Montori and Herrero2004), Pleguezuelos et al. (Reference Pleguezuelos, Márquez and Lizana2004), and Masó and Pijoan (Reference Masó and Pijoan2011).
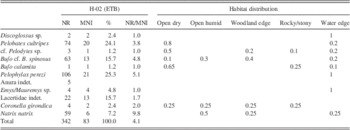
Amphibians and squamates from the middle Pleistocene of Estanque de Tormentas de Butarque (ETB; H-02) in number of remains (NR), minimum number of individuals (MNI), percentage (%), and distribution of each taxon in the habitats where they can be found today in the Iberian Peninsula.

AMPHIBIANS FROM ETB (H-02)
Alytidae: Discoglossus sp.
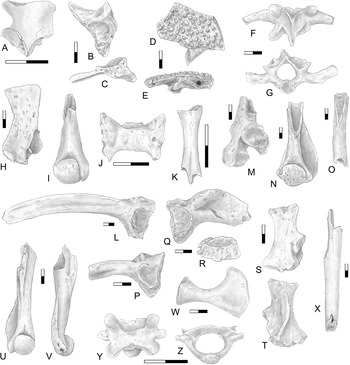
A painted frog is represented in H-02 by two elements: a right scapula and a right ilium. The scapula is rather short and robust (Fig. 3A). Unfortunately, the acromial apophysis is broken, but the overall shortness of this element is closer to what is observed in the genus Discoglossus than in the genera Pelodytes and Alytes (Bailon, Reference Bailon1999). The right ilium (Fig. 3B and C) presents a relatively long and slender pars ascendens and an interiliac tubercle typical of the genus Discoglossus, which is more protruding, as in D. jeanneae, whereas in D. galganoi this tubercle is generally more discrete (López-García et al., Reference López-García, Blain, Cuenca-Bescós, Alonso, Alonso and Vaquero2011). However, these fossils are cautiously ascribed at the genus level only.
Amphibians from the late middle Pleistocene of Estanque de Tormentas de Butarque H-02 (central Spain). (A–C) Discoglossus sp.: right scapula in dorsal view (A); right ilium in lateral and posterior views (B, C). (D–I) Pelobates cultripes: frontoparietal in dorsal and posterior views (D, E); fourth vertebra in dorsal and anterior views (F, G); left scapula in dorsal view (H); right humerus of female in ventral view (I). (J, K) cf. Pelodytes sp.: sacrum of a juvenile in dorsal view (J); radioulna in lateral view (K). (L–O) Bufo cf. spinosus: left ilium in lateral view (L); left scapula in dorsal view (M); left humerus of male in ventral view (N); femur in ventral view (O). (P) Bufo calamita, left ilium in lateral view. (Q–Z) Pelophylax perezi: right ilium in lateral and posterior views (Q, R); left scapula in dorsal and ventral views (S, T); left humerus of male in ventral and posterior views (U, V); coracoid in dorsal view (W); tibiofibula in lateral view (X); posterior vertebra of a juvenile in dorsal and posterior views (Y, Z). All scales=2 mm.

Pelobatidae: Pelobates cultripes
With some 76 bone elements, the western spadefoot toad is one of the best-represented anurans in H-02 (ETB; Table 1). The bone assemblage is representative of almost the entire skeleton, although some usually common elements are lacking, such as the ilium. The fossils from H-02 (ETB) comprise two maxillae, eight frontoparietals, one sphenethmoid, two squamosals, one vomer, one exoccipital, one parasphenoid, 19 indeterminate cranial fragments with dermal bone ornamentation, one atlas, nine vertebrae, one sacrum, three scapulae, one coracoid, five humeri, one radioulna, three ischio-pubes, 13 tibiofibulae, one tarsal, and one phalanx. Although most of the fossils are markedly incomplete, all of them are very characteristic of this species, in particular some of the cranial elements that present a dense dermal bone ornamentation (i.e., frontoparietals and maxillae). Some of the frontoparietal fragments document a relatively long and pointed processus paraoccipitalis with a distinct ridge running down its dorsal surface and a large squamosal process. The foramen arteriae occipitalis is not visible in dorsal view and is situated more medially with regard to the processus paraoccipitalis, as in P. cultripes (Fig. 3D and E). The vertebrae show a centrum that is procoelous, with a deep and circular anterior cotyle and a robust and round posterior condyle. Typical of the genus, the neural arch is anteroposteriorly long and dorsoventrally flattened, especially in the posterior vertebrae. Additionally, the neural spine is prolonged in a posterior interzygapophyseal tip that in some vertebrae surpasses the posterior edge of the postzygapophyses. The processi transversi are long and oriented slightly backward in the only fourth vertebra (V4; Fig. 3F and G). The fossil scapulae are rather robust, are higher than wide, and display a processus glenoidalis that is very distinct from the main corpus of the bone, even though, in dorsal view, it is partially hidden by the pars acromialis (Fig. 3H). The surface of articulation with the humerus extends onto the processus glenoidalis and the posterior margin of the pars acromialis. The fossil humeri are all incomplete and mainly document the distal part of the element. The diaphysis of the humeri is robust, is slightly curved, and bears a main crista ventralis and, medially, a smaller crista paraventralis. The condyle is spherical, well ossified, and slightly displaced laterally in relation to the axis of the diaphysis. The fossa cubitalis ventralis is relatively large, deep, and opened radially (Fig. 3I). Other elements fit well with the morphology of the genus and, because of their poor state of preservation, have mainly been attributed to P. cultripes by association with other, more diagnostic elements present in the same sample.
Pelodytidae: cf. Pelodytes sp.
A probable parsley frog is represented in H-02 (ETB) by very few elements: a sacrum, a radioulna, and a tibiofibula. The only sacrum is small, with an anterior and a posterior cotyle (Fig. 3J). The sacral apophyses are broken but seem to have been strongly dorsoventrally flattened and extended backward, as in the genera Pelobates and Pelodytes (Bailon, Reference Bailon1999). The small size of this element fits better with an attribution to Pelodytes, even if the absence of posterior condyles seems to be a “pathological” characteristic. A small-sized radioulna (Fig. 3K) and a fragment of tibiofibula from H-02 (ETB) are very cautiously referred to the genus Pelodytes. None of the fossils’ features permit an assignation to one of the two species of Pelodytes currently living in the Iberian Peninsula, P. punctatus and P. ibericus.
Bufonidae: Bufo cf. B. spinosus
One exoccipital, one atlas, 14 vertebrae, one sacrum, one urostyle, seven ilia, two ischio-pubes, three scapulae, one coracoid, five humeri, four radioulnae, five femurs, seven tibiofibulae, one tarsal, and 10 phalanxes have been referred to the common toad Bufo spinosus. The ilia are robust without any dorsal crest, and the tuber superior is low, unilobulated, and with a rounded dorsal margin (Fig. 3L). The scapulae (Fig. 3M) are higher than wide and with a robust glenoid process, detached and clearly visible in dorsal view, and without the small supraglenoid fossa usually present in Bufo calamita. The humeri (Fig. 3N) possess a straight diaphysis with a generally weakly ossified and radially displaced humeral condyle. The femurs bear a well-developed femoral crest that bifurcates and creates a triangular surface (Fig. 3O). The other elements display the general morphology of the genus Bufo. Cautious attribution to B. spinosus is possible on the basis of the size and robustness of the remains: B. spinosus generally reaches a larger size than B. bufo and is especially larger than B. calamita. Here we are referring to the size reached by only some of the fossil elements. Among the fossil material from H-02 (ETB), smaller bufonid bones may correspond to younger individuals of B. spinosus.
Bufonidae: Bufo calamita
A left ilium (Fig. 3P) in H-02 (ETB) is attributed to the natterjack toad. Contrary to the previous description of the ilia of B. spinosus, this fossil ilium shows a relatively high and pointed tuber superior characteristic of B. calamita, whereas in B. spinosus and B. bufo the tuber superior is generally low and rounded (Bailon, Reference Bailon1999).
Ranidae: Pelophylax perezi
The Iberian green frog is represented in H-02 (ETB) by 107 bones: one premaxilla, eleven maxillae, one articular sensu lato, one exoccipital, one atlas, 10 vertebrae, one sacrum, four urostyles, three scapulae, three coracoids, one clavicule, one parasternum, 10 humeri, eight radioulnae, eight ilia, three ischio-pubes, one femur, 10 tibiofibulae, and 28 phalanxes. The ilia possess a high and vertical dorsal crest on the anterior branch and a smooth posteromedial face without an interiliac groove (Fig. 3Q and R). The dorsal crest shows a globular and well-differentiated superior tubercle, typical of the genus Pelophylax. The angle between the anterior edge of the superior tubercle and the dorsal edge of the pars ascendens is slightly >90°. The articular surface with the ischium and pubis is relatively thick (ratio of diameter to thickness [d/t] sensu Gleed-Owen [Reference Gleed-Owen2000] ranging between 2.18 and 2.33 in the H-02 fossils), thus agreeing with the values for Pelophylax (2.12<d/t<2.88; Gleed-Owen, Reference Gleed-Owen2000). The scapulae are distinctly higher than wide and are characterized by a glenoid process that is partially hidden by the acromial process in dorsal view. In ventral view, an internal crest is present on the glenoid process and continues along the bony lamina (Fig. 3S and T). This internal crest is relatively short, as is the case among representatives of Pelophylax, whereas in the genus Rana it is longer (Bailon, Reference Bailon1999). Unlike what is observed in the previously cited genera (Discoglossus, Pelodytes, and Bufo), the humeri possess a straight and robust diaphysis with a generally well-ossified humeral condyle that follows the main axis of the diaphysis (Fig. 3U and V). In male humeri, the mesial crest is generally rather short and oriented transversely to the bone throughout its whole length, whereas in the genus Rana this mesial crest is much longer and more dorsally incurved (Bailon, Reference Bailon1999). The morphology of the other elements matches well with the genus Pelophylax, for example, the tooth-bearing premaxilla and maxillae, the fragment of sacrum with an anterior and two posterior condyles, a nicely preserved coracoid (Fig. 3W), a gracile sigmoid femur without a femoral crest, elongated tibiofibulae with scarcely enlarged extremities (Fig. 3X), and phalanxes that are more elongated and slender than those attributed to bufonids. Some elements, such as the vertebra illustrated in Figure 3Y and Z, are cautiously attributed to a juvenile specimen of Pelophylax. This vertebra is procoelous, with a short neural arch, and the transverse apophyses are not located under the prezygapophyses and are directed transversely. The centrum is rather small, and the lateral walls are thin, as in the genera Rana, Pelophylax, and Hyla. Although the neural arch does not seem to show a well-developed neural crest (as in the genus Hyla; Bailon, Reference Bailon1999), this may be a juvenile character of frogs (Rana and Pelophylax), with the neural crest becoming more apparent later in the ontogeny. Most of the other bones are very incomplete, and their attribution mainly relies on the presence of other diagnostic elements in the sample. All of these bones permit a secure attribution to the genus Pelophylax. Because P. perezi is the only green frog in the recent fauna of the region, we refer the fossil material from H-02 (ETB) to this species.
CHELONIANS FROM ETB (H-02)
Emydidae/Geoemydidae: Emys/Mauremys sp.
Two peripheral plates and various fragments from two indeterminate plates have been recovered from the excavations at H-02 (ETB). They are not as thick as those generally observed in the genus Testudo, and the sulci are not very deep. These remains are referred to an indeterminate aquatic turtle because of their incompleteness, very probably Emys orbicularis or Mauremys leprosa, the only turtles currently living in the Iberian Peninsula (Masó and Pijoan, Reference Masó and Pijoan2011; Salvador, Reference Salvador2014).
SQUAMATE REPTILES FROM ETB (H-02)
Lacertidae: Lacertidae indet.
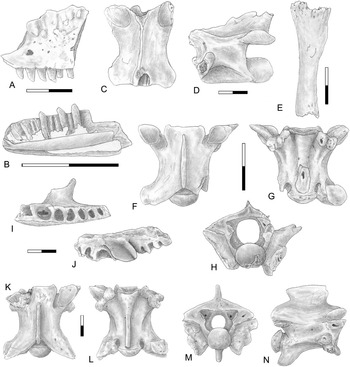
A few poorly diagnostic elements have been attributed to lacertid lizards. Two different size categories are represented in the fossils from H-02 (ETB): a medium-size lacertid (three vertebrae, one femur, and one tibia) and a small-size lacertid (two maxillae, six dentaries, one fragment of indeterminate tooth-bearing bone, three vertebrae, one femur, two tibiae, and two hemipelves). Although rather incomplete, all these elements, in particular the maxillae and dentaries, are characteristic of the family Lacertidae. The maxillae and dentaries bear pleurodont, tubular, mainly bicuspid teeth (Fig. 4A and B). In the dentaries, the Meckelian canal is wide open (Fig. 4B). The morphology of the other elements matches well with the family. More precise attribution is hampered by the lack of diagnostic elements. However, the size of the largest vertebra (centrum length=5.9 mm; Fig. 4C and D) falls within the size range of the juveniles or subadults of the largest Iberian species Timon lepidus (currently living in the vicinity of H-02), whereas other smaller elements are more characteristic of the well-distributed Iberian genera Psammodromus and Podarcis.
Squamate reptiles from the late middle Pleistocene of Estanque de Tormentas de Butarque H-02 (central Spain). (A–E) Lacertidae indet.: left maxilla in lateral view (A); right dentary in medial view (B); trunk vertebra in dorsal and left lateral views (C, D); tibia in anterior view (E). (F–H) Coronella cf. girondica, trunk vertebra in dorsal, ventral, and posterior views. (I–N) Natrix natrix: left maxilla in ventral and medial views (I, J); trunk vertebra in dorsal, ventral, posterior, and right lateral views (K–N). All scales=2 mm.

Colubridae: Natrix natrix
The grass snake N. natrix is represented by a total of 59 elements in H-02 (ETB): two fragments of maxillae, one cervical vertebra, 39 trunk vertebrae, 13 caudal vertebrae, and three fragments of undetermined vertebrae. The fragments of maxillae have no preserved teeth and represent the posterior part of the element, with a well-preserved ectopterygoid process (Fig. 4I and J). This process is robust in the medial view, wider than long, and somewhat concave, as in N. natrix (Szyndlar, Reference Szyndlar1984) and to a lesser extent Natrix maura, whereas in other Iberian colubrid genera consulted (Zamenis, Rhinechis, Malpolon, Coronella, and Hemorrhois) it has a different morphology (not so wide) and is rather flat. The trunk vertebrae (centrum length up to 6.8 mm; Fig. 4K–N) possess a sigmoid-shaped, short, and strong hypapophysis, and the zygapophyseal articular surfaces are more or less horizontal. The neural arch is vaulted posteriorly, the condyle and cotyle are small and circular, and the parapophysis is provided with a parapophyseal process. In lateral view, the parapophyseal processes are strongly built like in N. natrix (Szyndlar, Reference Szyndlar1984). The centrum of the trunk vertebrae of N. natrix is generally flat, and its lateral margins are well marked, whereas in N. maura the centrum is slightly convex, with lateral margins that are more or less indistinct (Bailon, Reference Bailon1991).
Colubridae: Coronella girondica
In H-02 (ETB), one cervical and three small-sized (centrum length <3 mm) fossil trunk vertebrae, with a typically dorsoventrally flattened neural arch, have been referred to the southern smooth snake C. girondica (Fig. 4F–H). Most of them are broken and show evidence of a high degree of digestion. By contrast with Natrix vertebrae, the trunk vertebrae of Coronella do not bear any hypapophyses on the centrum. For a given size, the trunk vertebrae of C. girondica generally differ from juveniles of Hemorrhois hippocrepis, Rhinechis scalaris, and, to a lesser degree, Malpolon monspessulanus in their more pronounced precondylar constriction (Blain, Reference Blain2005). Attribution to C. girondica rests on the morphology of the proximal portion of the prezygapophysis (more slender in C. girondica than in C. austriaca) and the relative size of the parapophysis in relation to the diapophysis, in accordance with Szyndlar (Reference Szyndlar1984).
SOME CONSIDERATIONS ON THE H-02 (ETB) HERPETOFAUNAL ASSEMBLAGE
According to Pleguezuelos et al. (Reference Pleguezuelos, Márquez and Lizana2004) and Masó and Pijoan (Reference Masó and Pijoan2011), in the southeastern area of Madrid where H-02 (ETB) is located, there are currently represented one newt (Pleurodeles waltl), seven anurans (Discoglossus galganoi, Pelobates cultripes, Pelodytes punctatus, Bufo spinosus, Bufo calamita, Hyla molleri, and Pelophylax perezi), two endemic chelonians (Emys orbicularis and Mauremys leprosa), eight lizards (Blanus cinereus, Tarentola mauritanica, Chalcides striatus, Acanthodactylus erythrurus, Timon lepidus, Podarcis virescens, Psammodromus algirus, and Psammodromus hispanicus), and four snakes (Natrix maura, Coronella girondica, Rhinechis scalaris, and Malpolon monspessulanus).
In its totality, the herpetofaunal assemblage of H-02 (ETB) documents at least 10 amphibians and reptiles (i.e., 47.6% of the current diversity observed in the southeastern area of Madrid), with six anurans (85.7% of the current diversity), one chelonian (half of the current diversity if only considering autochthonous turtles), one (perhaps two) lizard (14.3% of the current diversity), and two snakes (25.0% of the current diversity). Natrix natrix is the only species represented in H-02 (ETB) that is currently absent from the area, but it has been mentioned in the middle Pleistocene (MIS 11) of Áridos-1 (Sanchiz and Sanz, Reference Sanchíz and Sanz1980; Blain et al., Reference Blain, Santonja, Pérez-González, Panera and Rubio-Jara2014). In comparison with other already published archaeological sites, Arídos-1, Valdocarros II, Preresa, and HAT, in the southeast of Madrid (and mainly corresponding to interglacial periods), H-02 (ETB) is characterized principally by the absence of typical Mediterranean thermophilous taxa such as Psammodromus algirus, Psammodromus hispanicus, Chalcides striatus, Timon lepidus, Rhinechis scalaris, and Vipera latastei (Blain et al., Reference Blain, Panera, Uribelarrea, Rubio-Jara and Pérez-González2012, Reference Blain, Sesé, Rubio-Jara, Panera, Uribelarrea and Pérez-González2013, Reference Blain, Santonja, Pérez-González, Panera and Rubio-Jara2014). Nonetheless, taking into account the number of represented species, the H-02 (ETB) herpetofaunal assemblage shows an overall diversity that is similar to other “interglacial” sites (with a total of between 10 and 12 taxa), albeit with a somewhat lower number of reptiles (other sites having six to seven reptilian taxa). As a whole, the herpetofaunal assemblage of H-02 (ETB) shows the following: (1) a quite similar diversity of anurans to the present-day assemblage, (2) a regional impoverishment of the squamate Mediterranean fauna, and (3) an absence of any typically cold Euro-Siberian or higher-altitude taxa (the most typical of them currently represented in the Iberian herpetofauna would have been Rana temporaria, Anguis fragilis, Coronella austriaca, or Vipera aspis).
PALEOENVIRONMENTAL AND PALEOCLIMATIC RECONSTRUCTIONS
Climate interpreted from fossil amphibians and reptiles
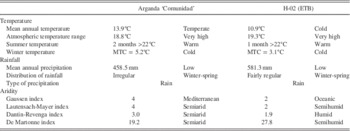
The Madrid region features a continental Mediterranean climate with cold winters because of altitude (700 m above sea level), including sporadic snowfalls and minimum temperatures often below freezing. Summer tends to be hot with temperatures that consistently exceed 30°C in July and August and occasionally rise above 40°C. Diurnal ranges are often significant during the summer because of Madrid’s altitude and dry climate. Precipitation, though concentrated in the autumn and spring, can be observed throughout the year. The climatic data from weather station 3182E (named Arganda ‘Comunidad’) provide us with a reliable record of the current climate in the area close to the archaeological site (Table 2, Fig. 5). The mean annual temperature (MAT) is 13.9°C, and the mean annual precipitation (MAP) is 458.5 mm (Ninyerola et al., Reference Ninyerola, Pons and Roure2005). The average difference between the warmest and coldest month is 18.8°C. The arid period in summer and the beginning of autumn (from June to September) lasts 4 months.
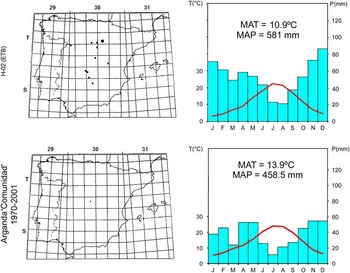
(color online) Paleoclimatic reconstruction of Estanque de Tormentas de Butarque (ETB) H-02 according to the mutual ecogeographic range method and comparison with modern data from the weather station 3182E of Arganda ‘Comunidad’ (Ninyerola et al., Reference Ninyerola, Pons and Roure2005). To the left: overlap of the current distribution of all the taxa represented as fossils in the site H-02 (ETB) and 10×10 km Universal Transverse Mercator (UTM) square corresponding to Arganda ‘Comunidad’. Principal grid comprises 100×100 km UTM squares within global UTM zones (from 29T to 31S). To the right: climatograms for H-02 (ETB) and Arganda ‘Comunidad’. MAP, mean annual precipitation; MAT, mean annual temperature; P, precipitation; T, temperature.

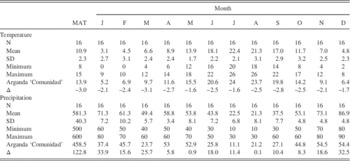
Climatic parameters calculated (in °C for temperature and mm for precipitation) by the mutual ecogeographic range method for Estanque de Tormentas de Butarque (H-02) and comparison with the climatic values (1970–2001) from the weather station 3182E of Arganda ‘Comunidad’ (Ninyerola et al., Reference Ninyerola, Pons and Roure2005). Δ, comparison with present; MAP, mean annual precipitation; MAT, mean annual temperature; N, number of 10×10 km Universal Transverse Mercator squares of the overlap; SD, standard deviation.
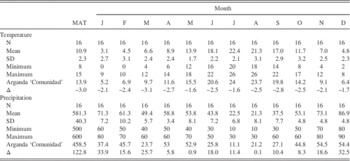
Past climatic parameters were obtained by applying the MER method to the fossil herpetological assemblage (Table 2). The overlap obtained from the herpetofaunal assemblage of H-02 (ETB) gives 16 UTM squares. These squares occur in north-central and eastern Spain (Fig. 5). The mean value of the estimated MATs is 10.9±2.3°C (minimum=8°C; maximum=15°C), and for the MAPs, it is 581.3±40.3 mm (minimum=500 mm; maximum=600 mm). Climatograms are used in order to better visualize the monthly evolution of temperature (T) and precipitation (P), applying the scale P=2×T in order to evaluate directly the Gaussen index (Fig. 5). Finally, the climatic interpretation is synthesized in Table 3.
Climatic interpretation of the climatograms. ETB, Estanque de Tormentas de Butarque. MTC: Mean temperature of the coldest month
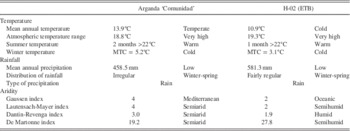
The climate at the time of H-02 (ETB) can be defined as cold with a very high atmospheric temperature range. The summer is reasonably warm, and the winter is cold. Rainfall is low, even if higher than today, but its distribution is fairly regular with higher amounts during winter and spring. The aridity indexes suggest a semihumid (or humid according to the Dantin-Revenga index), continental Mediterranean (transitional to Oceanic) climate with only two dry months in summer (Fig. 5, Table 3).
As stated previously, such results are in accordance with the absence at the site of the typical Mediterranean thermophilous taxa documented in other “warmer” sites (MIS 5, 7, and 11) in the area. However, some Mediterranean taxa, such as Discoglossus sp. and P. cultripes, still survive the cold climate conditions described here, probably by lengthening their period of dormancy.
In comparison with the current climatic data from Arganda ‘Comunidad’ weather station 3182E, the MER-estimated MAT for H-02 (ETB) is much colder (ΔMAT=−3.0°C). The decrease in temperature is in evidence for all the seasons of the year (MTW, mean temperature of the warmest month [May and July]=−1.6°C; MTC, mean temperature of the coldest month [March]=−3.1°C). Although the total amount of rainfall is only slightly higher (ΔMAP=+122.8 mm) than the current level in Madrid, the rainfall is more regularly distributed throughout the year, reducing the duration of summer aridity. This is clearly suggested by the values of the aridity indexes, which all indicate a semihumid or humid climate for H-02 (ETB), whereas current values are characteristic of a semiarid climate, implying moister conditions in the area during MIS 6 than today. Such a climate pattern is consistent with a glacial period, as has been demonstrated for central Spain (Blain et al., Reference Blain, Panera, Uribelarrea, Rubio-Jara and Pérez-González2012), where during “cold” periods the climate becomes more continental (although preserving some dryness during the summer) by contrast with “warm” periods, where the climate is more temperate (with mild winters and a long period of dryness in summer and early autumn). In accordance with the biochronological interpretation by Laplana et al. (Reference Laplana, Herráez, Yravedra Saínz de los Terreros, Bárez, Rubio-Jara, Panera, Rus and Pérez-González2015) of the morphostratigraphic unit of the CTB that contains the site, H-02 (ETB) can be correlated with a cold and humid phase of MIS 6.
Local environment interpreted on the basis of the fossil amphibians and reptiles
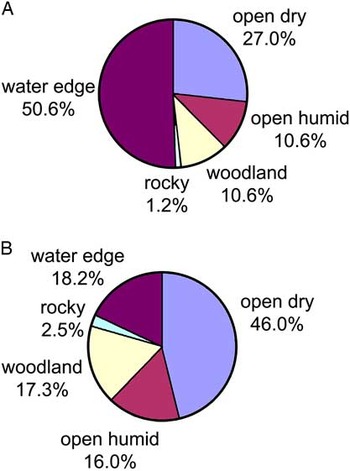
Considering the whole set of amphibians and reptiles (Table 1) represented in H-02 (ETB), some taxa such as C. girondica preferentially live in sunny and rather open biotopes with loose soils and stones. P. cultripes and to a lesser degree Pelodytes sp. and B. calamita are inhabitants of drier open environments, with poor and short plant cover and with loose or stony soils. The considerable representation of B. cf. spinosus (15.7% of the whole assemblage) and N. natrix (7.2%) may indicate the existence of some moister/cooler forest and woodland-edge environments under reasonably stable climatic conditions. Above all, and because the site is close to the main river, water-edge environments are fairly well represented, with the presence of typical inhabitants of aquatic biotopes such as Discoglossus sp., P. perezi, Emys/Mauremys, and to a lesser extent N. natrix (altogether representing 50.6% of the whole association).
From a taphonomical point of view, almost all the fossil elements from H-02 (ETB) are fragmentary and seem to have undergone some very short transport (abrasion on bone surfaces). Among the elements, only a few snake vertebrae (C. girondica) present evidence of strong digestion, probably produced by a small carnivore or a diurnal bird of prey. C. girondica is known to be preyed on today by Milvus migrans, Circaetus gallicus, and Buteo buteo (Galán, Reference Galán2014). When the number of remains (NR)/MNI ratio is taken into account, some species show a higher ratio, such as P. perezi, P. cultripes, B. spinosus, and also N. natrix (Table 1). Because of the proximity of the river, aquatic taxa such as P. perezi are likely to be overrepresented, although others such as Discoglossus and chelonians are not. The relatively high representation of P. cultripes and B. spinosus may be because of the robustness of their bones and perhaps also to the fact that their remains must have come from an “in situ” mortality when buried in loose sediments. Within the fossil material, juveniles of Pelobates and Pelophylax are particularly well represented. For N. natrix, the high NR/MNI ratio is presumably because of the difficulty of ascertaining the MNI from vertebrae.
When (possibly overrepresented) water taxa are excluded from our reconstruction (Fig. 6B), the environmental reconstructions based on the H-02 (ETB) herpetofaunal assemblage suggest that during MIS 6 there was a patchy landscape with a large representation of dry meadows (46.0% of the whole environment) on the plateau, followed by what can be interpreted as more local river environments with humid meadows (16.0%), woodlands (17.3%), and aquatic habitats (18.2%). Rocky biotopes are very occasional, representing only 1.2% of the whole environment, probably because of the impossibility of determining the lacertid remains to genus level.
(color online) Paleoenvironmental reconstruction of Estanque de Tormentas de Butarque H-02 according to the habitat weighting method, with (A) and without (B) water-edge taxa (Discoglossus, Pelophylax perezi, and Emys/Mauremys).

DISCUSSION AND COMPARISONS
Comparison with other H-02 (ETB) proxies
The paleoclimatic and paleoenvironmental reconstructions of the MIS 6 herpetofaunal assemblage of H-02 (ETB) thus characterize a semihumid, cold, continental climate with low but fairly regular precipitation. As a consequence of such climatic conditions (as well as the topography around the site), the overall landscape was rather open with small riverine patches of humid meadows and woodlands. Such reconstructions are in accordance with the list of mammalian species recovered in the site, where the joint occurrence of Microtus arvalis and Bison priscus suggests cold climatic conditions (Laplana et al., Reference Laplana, Herráez, Yravedra Saínz de los Terreros, Bárez, Rubio-Jara, Panera, Rus and Pérez-González2015). Open environments are well documented by the presence of horses (Equus ferus and Equus hydruntinus), rhinoceros (Stephanorhinus sp.), bison (Bison priscus), and proboscideans (Palaeoloxodon antiquus), as well as by small mammals such as Crocidura cf. russula, Microtus brecciensis, Oryctolagus cuniculus, Lepus sp., and particularly by the presence of the hamster Allocricetus bursae, a typical dry steppe inhabitant. The existence of humid woodland environments is suggested by the occurrence in the site of Cervus elaphus, Bos primigenius, Sus scrofa, and the small mammals Erinaceus sp., Eliomys quercinus, Apodemus sp. gr. A. sylvaticus–A. flavicollis, and to a lesser extent by Crocidura cf. russula. Finally, the presence of Arvicola cf. sapidus suggests that there was also water in the vicinity of the site (Laplana et al., Reference Laplana, Herráez, Yravedra Saínz de los Terreros, Bárez, Rubio-Jara, Panera, Rus and Pérez-González2015).
Comparison with other MIS 6 records
In comparison with the last glacial maximum (MIS 2), paleoclimatic reconstructions of the penultimate glacial are rather scarce. In fact, they are limited to a few Antarctic ice cores and marine cores, such as those from the Iberian margin and the Mediterranean Sea (e.g., Petit et al., Reference Petit, Jouzel, Raynaud, Barkov, Barnola, Basile and Bender1999; de Abreu et al., Reference de Abreu, Shackleton, Schönfeld, Hall and Chapman2003; Martrat et al., Reference Martrat, Grimalt, Lopez-Martinez, Cacho, Sierro, Flores, Zahn, Canals, Curtis and Hodell2004, Reference Martrat, Grimalt, Shackleton, de Abreu, Hutterli and Stocker2007; Jouzel et al., Reference Jouzel, Masson-Delmotte, Cattani, Dreyfus, Falourd, Hoffmann and Minster2007; Margari et al., Reference Margari, Tzedakis, Shackleton and Vautravers2007, Reference Margari, Skinner, Tzedakis, Ganopolski, Vautravers and Shackleton2010).
The geographically closest of these records to H-02 (ETB) is located on the Portuguese margin (core MD01-2444), where changes in the land-ocean system form a coherent framework with evidence of ice-volume variations during MIS 6. On the basis of the amplitude of millennial-scale variability, the penultimate glacial has been divided by Margari et al. (Reference Margari, Skinner, Hodell, Martrat, Toucanne, Grimalt, Gibbard, Lunkka and Tzedakis2014) into three parts: an early part (185–160 ka) with prominent oscillations in foraminiferal isotope and tree pollen values (Margari et al., Reference Margari, Skinner, Tzedakis, Ganopolski, Vautravers and Shackleton2010), a transitional period (160–150 ka), and a late part (150–135 ka) with subdued benthic δ18O and δ13C and also Antarctic temperature variations, as well as minimum tree pollen values.
The Ioannina Basin (northwestern Greece) is probably the best terrestrial pollen record for this interval produced to date. Climate reconstructions suggest globally cool and wet conditions (Roucoux et al., Reference Roucoux, Tzedakis, Lawson and Margari2011; Wilson et al., Reference Wilson, Frogley, Roucoux, Jones, Leng, Lawson and Hughes2013). At the transition from MIS 7 to MIS 6 (~185,000 yr), temperate tree populations abruptly decline, though with the persistence of taxa such as Corylus, Abies, Carpinus, and Fagus suggesting that mixed deciduous woodland was still present locally. Then, between 177 and 158 ka, temperate tree pollen oscillates between 8% and 45%. However, the total arboreal pollen percentages (77%) during interstadials suggest that the landscape remained relatively open with sparser, less extensive woodlands than during interglacials. Finally, in the later part of MIS 6 (after 155 ka), a greater abundance of steppe taxa and other herbaceous elements, combined with lower tree pollen percentages (mainly between 20% and 40%), indicates that the landscape was predominantly open, in contrast to the earlier part of MIS 6. For the same period, the temperate pollen percentages in MD01-2444 on the Portuguese margin are lower than 10% (Margari et al., Reference Margari, Skinner, Tzedakis, Ganopolski, Vautravers and Shackleton2010, Reference Margari, Skinner, Hodell, Martrat, Toucanne, Grimalt, Gibbard, Lunkka and Tzedakis2014), as at Tenaghi Philippon (Greece; Tzedakis et al., Reference Tzedakis, McManus, Hooghiemstra, Oppo and Wijmstra2003).
Such data are also globally corroborated by other types of information, such as speleothem records. Over continental mid-to-low latitude areas, five speleothem records of early MIS 6 variability can be quoted: the Chinese Hulu/Sanbao cave record, which yields an impressive resolution back to 224 ka (Cheng et al., Reference Cheng, Edwards, Wang, Kong, Ming, Kelly, Wang, Gallup and Liu2006; Wang et al., Reference Wang, Cheng, Edwards, Kong, Shao, Chen, Wu, Jiang, Wang and An2008); the eastern Mediterranean record based on the Soreq-Peqi’in record (Ayalon et al., Reference Ayalon, Bar-Matthews and Kaufman2002; Bar-Matthews et al., Reference Bar-Matthews, Ayalon, Gilmour, Matthews and Hawkesworth2003); the Italian Argentarola cave record (Bard et al., Reference Bard, Delaygue, Rostek, Antonioli, Silenzi and Schrag2002); the Gitana cave speleothem record of southeastern Spain (Hodge et al., Reference Hodge, Richards, Smart, Andreo, Hoffmann, Mattey and González-Ramón2008); and the Villars cave flowstone deposit of southwestern France (Wainer et al., Reference Wainer, Genty, Blamart, Bar-Matthews, Quinif and Plagnes2013). All of these depict a high-frequency variability involving globally large changes in effective precipitation, with lower rainfall during glacial periods and increased moisture availability during interglacial periods. When compared with MIS 3 and 4, MIS 6 was a cooler and more humid climate, even during the coldest events, with more humid summers detected both in southwestern France and in the Iberian Peninsula.
With regard to temperature and precipitation quantifications, several different reconstructions have concluded that the climate of at least some intervals in early MIS 6 must have been characterized by temperature depressions (summer and annual) of 8–9°C below modern values and annual precipitation of >2000 mm (and possibly >3000 mm) in the highest mountains in order to form the glaciers (Hughes et al., Reference Hughes, Woodward and Gibbard2007; Hughes and Braithwaite, Reference Hughes and Braithwaite2008). Long pollen sequences from France have also yielded estimates of MATs and MAPs (Guiot et al., Reference Guiot, Pons, de Beaulieu and Reille1989, Reference Guiot, de Beaulieu, Cheddadi, David, Ponel and Reille1993). At La Grande Pile (Vosges), the annual temperature was 4 to 8°C lower and precipitation 200 to 800 mm lower than at present in the area. In south-central France, reconstructions for the Les Echets area suggest an MAT 8 to 12°C lower and precipitation 400 to 600 mm less than today. Such results have also been corroborated by the coleopteran assemblage studies in La Grande Pile, with a cold and very continental reconstructed climate for the later part of MIS 6 (Ponel, Reference Ponel1995).
In southwestern Europe, only a few archaeological sites have been reported relating to MIS 6. This is the case with Sala de los Huesos in the Cueva de Maltravieso (Cáceres, western Spain), dated to within MIS 6 or the base of MIS 5. The mammalian faunal list and overall environmental reconstructions made by Hanquet (Reference Hanquet2011) for this site are roughly similar to those for H-02 (ETB), suggesting a locally humid and wooded environment within a larger open and dry landscape. The climate is described as having been colder and drier (but still humid) than presently in the area. However, the thermophilous bats (Rhinolophus euryale, Rhinolophus mehelyi, Rhinolophus ferrumequinum, and Miniopterus schreibersi) and reptiles (Malpolon monspessulanus, Timon lepidus, and Rhinechis sp.; S. Bailon in Hanquet, Reference Hanquet2011) in Sala de los Huesos indicate much warmer conditions than in H-02 (ETB), where such taxa (especially reptiles) have not been documented. The persistence of Mediterranean thermophilous species is probably a characteristic of the Maltravieso area during cold stages, as documented by Bañuls Cardona et al. (Reference Bañuls Cardona, López-García, Blain and Canals Salomó2012, Reference Bañuls Cardona, López-García, Blain, Lozano-Fernández and Cuenca-Bescós2014) during the last glacial maximum (MIS 2) in the archaeological site of Sala de las Chimeneas in the Cueva de Maltravieso (Cáceres, western Spain).
Finally, two other sites in southeastern France have documented parts of the MIS 6. The Grotte du Lazaret (Nice, Alpes-Maritimes, southeastern France), which presents a long and detailed late MIS 6 stratigraphy (Lumley et al., Reference Lumley, de, Echassoux, Bailon, Cauche, Marchi, de, Desclaux and El Guennouni2004; Valensi et al., Reference Valensi, Aouraghe, Bailon, Cauche, Combier, Desclaux and Gagnepain2005, Reference Valensi, Bailon, Michel, Desclaux, Rousseau, Genty, Blamart, Onoratini and Lumley2007; Hanquet et al., Reference Hanquet, Valensi, Bailon, Desclaux, El Guennouni, Roger and de Lumley2010; Manzano, Reference Manzano2015), and Baume Moula-Guercy (Soyons, Ardèche, southeastern France), where MIS 6 is documented by a few layers at the base of the stratigraphic sequence (Desclaux and Defleur, Reference Desclaux and Defleur1997; Manzano, Reference Manzano2015; Foury et al., Reference Foury, Desclaux, Daujeard, Defleur, Moncel and Raynal2016). Both yielded globally cold and humid climate reconstructions with the same environmental pattern (predominance of open-dry biotopes) as previously described for H-02 (ETB) and Sala de los Huesos. In the Grotte du Lazaret sequence, the δ18O study of marine gastropods, together with the presence of Nordic littorinids (of anthropogenic origin) Littorina fabalis and Littorina saxatilis in the stratigraphic ensembles CII superior (dated between 150 and 170 ka) and especially CIII (dated between 125 and 150 ka), suggests that cooling initiated at MIS 6.4 and intensified at MIS 6.2, with a mild warming up at the time of the MIS 6.3 (Valensi et al., Reference Valensi, Bailon, Michel, Desclaux, Rousseau, Genty, Blamart, Onoratini and Lumley2007). The stratigraphic ensemble CII superior (MIS 6.3) documents a better representation of thermophilous Mediterranean taxa, like the lacertids (Timon lepidus and Podarcis sp.), the snakes (Coronella cf. girondica, Hierophis viridiflavus, Malpolon monspessulanus, and Rhinechis scalaris), and the small mammals (Microtus [Iberomys] brecciensis, Rhinolophus ferrumequinum, and Crocidura russula/leucodon) (Hanquet et al., Reference Hanquet, Valensi, Bailon, Desclaux, El Guennouni, Roger and de Lumley2010; Manzano, Reference Manzano2015). Climate reconstruction based on amphibians and reptiles by Manzano (Reference Manzano2015) suggests oceanic cold and humid conditions for ensemble CIII (MIS 6.2), in opposition with a more Mediterranean, still cold but slightly dryer, climate for ensemble CII superior (MIS 6.3). Locally, landscape is said to be more forested (30% of the assemblage) in ensemble CIII than in ensemble CII superior.
In conclusion, MIS 6 climatic reconstructions based on the herpetofaunal assemblage from H-02 (ETB) suggest that, apart from the much drier conditions observed in northern continental Europe (from temperature and precipitation estimates for La Grande Pile and Les Echets pollen sequences), temperature variations were not extreme, and precipitation was sufficient in some areas of southern Mediterranean Europe to permit the persistence of temperate tree populations and some Mediterranean anurans. Apart from these general considerations, the lack of chronological precision for H-02 (ETB) hampers more detailed comparison with the climate variability observed during MIS 6. However, comparison with the Grotte du Lazaret small-vertebrate assemblages does suggest a greater similarity with stage 6.2 (as defined by Imbrie et al., Reference Imbrie, Hays, Martinson, McIntyre, Mix, Morley, Pisias, Prell and Shackleton1984) or lettered stage 6a (see Railsback et al., Reference Railsback, Gibbard, Head, Voarintsoa and Toucanne2015), by the absence of typical Mediterranean thermophilous reptiles at H-02 (ETB), the oceanic cold and slightly humid reconstructed climate, and its associated open-dry landscape.
CONCLUSIONS
The fossil amphibians and reptiles from the middle Pleistocene archaeological site of ETB (H-02), stored in the collections at the MAR, have been described and quantified for the first time. This has enabled us to produce a precise interpretation for the climatic and environmental conditions that prevailed in the central Iberian Peninsula during MIS 6, one of the coldest glacial periods of the Pleistocene, some 150,000 yr ago. We conclude the following points.
The herpetofaunal assemblage from H-02 (ETB) is composed of at least 10 amphibians and reptiles (i.e., 37.5% of the current diversity observed in the southeastern area of Madrid): six anurans (Discoglossus sp., Pelobates cultripes, cf. Pelodytes sp., Bufo cf. B. spinosus, Bufo calamita, and Pelophylax perezi), one turtle (Emys or Mauremys), one or two indeterminate lizards (Lacertidae indet.), and two snakes (Natrix natrix and Coronella girondica). Natrix natrix is the only species represented in H-02 (ETB) that is currently absent from the area.
In comparison with the other archaeological sites from the southeast of Madrid (and mainly corresponding to interglacials), the herpetofaunal association from H-02 (ETB) is characterized by a regional impoverishment of the squamate thermophilous fauna, whereas the anuran diversity remains similar to that at present. Another interesting observation is the absence of any typical cold Euro-Siberian or higher-altitude species in H-02 (ETB). Finally, some currently restricted Mediterranean species (Discoglossus and P. cultripes) demonstrate here their ability to adapt locally to colder conditions.
The climate during MIS 6 was colder and slightly wetter than today in central Spain, with an MAT 3.0°C lower and an MAP 122.8 mm higher than at present in the area. The temperature decrease is higher for winter/spring (ΔMTC=−3.1°C; with an MTC occurring in March instead of January) than for summer (ΔMTW=−1.6°C), which remains reasonably temperate. The slightly higher reconstructed rainfall is well distributed throughout the whole year, with the highest amount during winter, the period of dryness during summer thus lasting much less than today.
In comparison with other localities, from central Spain, such a cold and continental climate (with a reduced period of aridity during the summer) is consistent with a glacial. In accordance with the biochronological interpretation by Laplana et al. (Reference Laplana, Herráez, Yravedra Saínz de los Terreros, Bárez, Rubio-Jara, Panera, Rus and Pérez-González2015) and the numeric TL age (>125 ka) obtained for the underlying sedimentary sequence, H-02 (ETB) can be correlated with a cold and semihumid period of MIS 6, maybe the MIS 6a.
The climate reconstructions from H-02 (ETB) also suggest that MIS 6 may have preserved some moisture in southernmost Europe, favorable to the persistence of small woodland areas by contrast with the severe quantitative climate reconstructions obtained in northern no-Mediterranean pollen sequences (such as Les Echets and La Grande Pile).
Finally, the environmental reconstructions based on the herpetofaunal assemblage suggest that during MIS 6 there was a large representation of dry environments on the overlying plateau, together with a probable corridor of humid meadows and woodlands along the river, where the site is located.
ACKNOWLEDGMENTS
We thank Enrique Baquedano and Antonio F. Dávila (MAR, Alcalá de Henares) for the loan of the fossil amphibians and reptiles from ETB (H-02) and Dr. Marta Calvo Revuelta (MNCN, Madrid) for allowing us to consult the comparative herpetofaunal specimens under her care. Editor Lewis Owen, associate editor Curtis W. Marean, and two anonymous reviewers are thanked for their careful reading and constructive comments that greatly improved the final version of this manuscript. This paper is part of the projects CGL2016-80000-P (Spanish Ministry of Economy and Competitiveness) and SGR2014-901 (Generalitat de Catalunya).