INTRODUCTION
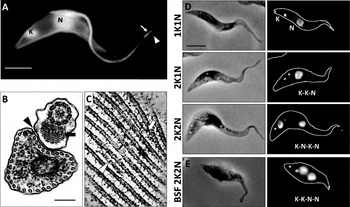
Trypanosoma brucei, an early branching protozoan eukaryote of the order Kinetoplastida, is the etiological agent of devastating parasitic disease in humans and livestock in sub-saharan Africa. The life cycle of the parasite includes colonisation of an insect vector (the tsetse fly, Glossina spp.) and a mammalian host and is characterized by extreme changes in cellular morphology (Vickerman, Reference Vickerman1985). The pathogenicity and growth of the parasite are intimately linked to its shape and form which are in turn derived from a highly ordered microtubule cytoskeleton that forms a tightly arrayed cage directly beneath the pellicular membrane (Gull, Reference Gull1999) (Fig. 1). The microtubules within the array are cross-linked to one another and to the pellicular membrane and are all aligned with the same polarity such that the more dynamic plus ends of the microtubules face the posterior end of the cell (Robinson et al. Reference Robinson, Sherwin, Ploubidou, Byard and Gull1995) (Fig. 1). This microtubule array persists throughout the cell and life cycle and must accommodate extreme changes in cellular morphology and the requirement for faithful inheritance by daughter cells during cytokinesis. In this review we will discuss the role that proteomics techniques have had in advancing our understanding of the molecular composition of the cytoskeleton and its functions and consider future opportunities for the application of these techniques in terms of addressing some of the unanswered questions of trypanosome cytoskeletal cell biology.
The cytoskeleton. A. Immunofluorescence image of procyclic form T. brucei showing the microtubule array and axoneme (arrowhead) labelled with KMX-1 (tubulin) and the PFR (arrow) labelled with L8C4 (PFR2). The nucleus (N) and kinetoplast (K) are labelled with DAPI. Bar=5 mm. B. TEM of a transverse section through the anterior end of procyclic form showing the microtubule array and the flagellum. Arrow=paraflagellar rod, arrowhead=FAZ, bar=200 nm. C. Nominal 10 nm thick pseudosection from a tomographic reconstruction of a procyclic form cell. The regular spacing of the microtubules and the intermicrotubule cross bridges can be clearly seen. Arrow, a microtubule ends in the array and the neighbouring microtubules come together to preserve the intermicrotubule spacing. Arrowhead, a short microtubule intercalated into the array. Extension of microtubules like these allows the increase in cell volume observed during the cell cycle. D. Progression of the cell cycle in the procyclic form stage showing the relative positions of the nuclei (N) and kinetoplasts (K). Following mitosis the nuclei and kinetoplasts adopt a K-N-K-N configuration prior to cell division. E. 2K2N bloodstream form cell. In contrast to the 2K2N procyclic form cell, both kinetoplasts are positioned posterior to the most posterior nucleus. DNA labelled with DAPI, bar=5 mm.

BACKGROUND
During its passage from the tsetse fly digestive tract, through the salivary glands and into the mammalian host T. brucei adopts both trypomastigote and epimastigote forms. As general categories, these forms are defined by the relative positions and morphology of the single flagellum, the nucleus and the kinetoplast (McGhee and Cosgrove, Reference McGhee and Cosgrove1980), the densely packed, concatenated DNA of the single mitochondrion that is the defining feature of the Kinetoplastida (Fig. 1). The flagellum follows the canonical eukaryotic 9+2 microtubule axonemal arrangement with an additional extra-axonemal complex known as the paraflagellar rod (PFR). The flagellar basal body is connected to the kinetoplast via a tripartite attachment complex (Ogbadoyi et al. Reference Ogbadoyi, Robinson and Gull2003) and hence the position of the kinetoplast and the origin of the flagellum and its path are intimately associated. T. brucei cells are generally tubular in shape, tapering to the anterior, with a long principal axis defining the anterior and posterior poles of the cell. In trypomastigote forms the kinetoplast is situated posterior to the nucleus, which occupies a central position in the cell, and the single long flagellum extends just beyond the anterior tip of the cell body (Fig. 1). The flagellum is attached to the cell body for most of its length via a specialised region known as the flagellum attachment zone (FAZ) (Vickerman, Reference Vickerman1969; Woods et al. Reference Woods, Sherwin, Sasse, MacRae, Baines and Gull1989) which follows a left-handed helical path around the cell body within the microtubule array. Epimastigote forms are characterized by an anterior position of the kinetoplast and flagellum in relation to the nucleus, which itself occupies a position closer to the posterior end of the cell than seen in trypomastigotes. Although the flagellum is still attached to the cell body at its proximal end, a greater proportion of its length extends beyond the anterior tip of the cell body. However, even within these general categories numerous morphologically distinct sub forms exist, ranging from extremely long, slender cells to relatively short, broad cells. Such drastic changes in morphology are accomplished through asymmetric division events or through differentiation of growth arrested cells (Matthews and Gull, Reference Matthews and Gull1994; Sharma et al. Reference Sharma, Peacock, Gluenz, Gull, Gibson and Carrington2008). These extreme changes in cellular morphology, which must at the same time preserve the structural integrity of the cytoskeleton, speak to a system that must maintain a knife-edge balance between stability and dynamism. Many of the structures and organelles in trypanosomes are present as single copies with precisely defined locations within the cell and highly interdependent processes for duplication, segregation and inheritance, and in many cases the cytoskeleton plays a crucial role in these processes. When taken together these point towards a tightly controlled, molecularly complex system.
Until relatively recently our knowledge of the components of the cytoskeleton has predominantly come from the identification of antigens from the extensive set of monoclonal antibody markers available and to date no comprehensive proteomic analysis of the cytoskeleton as a whole has been reported. However, a number of recent studies have employed direct and comparative proteomics techniques to begin to define the composition of substructures of the cytoskeleton.
PROTEOMIC ANALYSIS OF CYTOSKELETAL STRUCTURES
The flagellum is a major component of the T. brucei cytoskeleton in terms of both function and molecular complexity with a cohort of at least 300 proteins and more likely greater than 500 constituent proteins. Over the last decade the increasing availability and sensitivity of mass spectrometers saw a flurry of activity directed at the eukaryotic flagellum. This resulted in a number of groups publishing flagellar proteomes from organisms as diverse as mammals, protozoans and green algae and included our analysis of the T. brucei flagellar complex cytoskeleton (Ostrowski et al. Reference Ostrowski, Blackburn, Radde, Moyer, Schlatzer, Moseley and Boucher2002; Pazour et al. Reference Pazour, Agrin, Leszyk and Witman2005; Smith et al. Reference Smith, Northey, Garg, Pearlman and Siu2005; Broadhead et al. Reference Broadhead, Dawe, Farr, Griffiths, Hart, Portman, Shaw, Ginger, Gaskell, McKean and Gull2006; Liu et al. Reference Liu, Tan, Levenkova, Li, Pugh, Rux, Speicher and Pierce2007; Oberholzer et al. Reference Oberholzer, Langousis, Nguyen, Saada, Shimogawa, Jonsson, Nguyen, Wohlschlegel and Hill2011). One particularly surprising outcome of these studies was the level of specificity of molecular composition in different lineages given the apparent conservation of the flagellum at the ultrastructural level. In T. brucei, for example, only around 25% of the identified flagellar complex components had detectable homologues outside the kinetoplastid lineage (Broadhead et al. Reference Broadhead, Dawe, Farr, Griffiths, Hart, Portman, Shaw, Ginger, Gaskell, McKean and Gull2006). This compositional diversity may, in part, reflect the diverse roles in which flagella are employed in eukaryotes. Flagella (and cilia) perform functions in motility and signalling as well as more specific roles such as attachment to the insect vector salivary gland epithelium in T. brucei (Tetley and Vickerman, Reference Tetley and Vickerman1985) and the generation of nodal flow in mammalian embryo development (Hirokawa et al. Reference Hirokawa, Tanaka, Okada and Takeda2006). This diversity of function is reflected in many organisms by the possession of a variety of extra-axonemal accessory structures. In kinetoplastids this consists of a paracrystaline structure known as the paraflagellar rod (PFR) (Bastin et al. Reference Bastin, Matthews and Gull1996; Portman and Gull, Reference Portman and Gull2010) which ranges from an extensive network present along most of the flagellum as seen in trypanosomes and Leishmania, for example (Fig. 1), to a reduced structure present only towards the proximal end of the flagellum as exemplified by Crithidia deanei (Gadelha et al. Reference Gadelha, Wickstead, de Souza, Gull and Cunha-e-Silva2005). In an early example of protozoan comparative proteomics, a comparison between SDS-PAGE profiles of flagella purified from the green algae Chlamydomonas reinhardtii and Euglena gracillis, which is related to the kinetoplastids and possesses a PFR, identified two highly abundant protein bands only present in the latter (Hyams, Reference Hyams1982). We now know that these correspond to the defining components of the PFR, the related proteins PFR1 and PFR2 (Russell et al. Reference Russell, Newsam, Palmer and Gull1983). A PFR2 null mutant in L. mexicana (Santrich et al. Reference Santrich, Moore, Sherwin, Bastin, Brokaw, Gull and LeBowitz1997) and RNAi ablation of PFR2 in T. brucei (Bastin et al. Reference Bastin, Sherwin and Gull1998) demonstrated that the PFR is required for full flagellar motility in both of these species. Importantly, the loss of PFR2 resulted in the failure of PFR assembly and unassembled PFR components no longer co-purified with the flagellum. This presented the opportunity to identify PFR components using 2D gel-based comparative proteomics in combination with inducible RNAi. Flagellar samples prepared from the induced snl2 mutant, in which PFR formation was prevented by the RNAi-mediated ablation of PFR2, were compared to flagella samples purified from non-induced cells in which the PFR formed normally (Pullen et al. Reference Pullen, Ginger, Gaskell and Gull2004). When the resulting gels were compared several spots were identified which showed reduced abundance in the snl2-induced sample. These spots were excised and two of the proteins were identified as PFR-specific adenylate kinases, providing the first insights into the PFR as a platform for metabolic functions. We recently followed up the success of this earlier study using the modern comparative proteomic techniques DIGE and iTRAQ, which involve the direct comparison of two or more protein samples which are mixed prior to the determination of relative abundance to reduce the variability between separate identification steps. This analysis yielded 30 identifications of PFR candidate proteins of which 20 were novel (Portman et al. Reference Portman, Lacomble, Thomas, McKean and Gull2009). A number of proteins previously identified as PFR components were not identified in these analyses suggesting that further novel components also await discovery. These may include proteins of relatively lower abundance or those with biochemical characteristics refractory to identification by mass spectrometry and/or resolution on 2D gels. Additionally, after ablation of PFR2 some portions of the PFR are still assembled, such as the connections to the axoneme (Bastin et al. Reference Bastin, Sherwin and Gull1998), and the technique used to purify flagella for these analyses is also likely to solubilise some less strongly bound components.
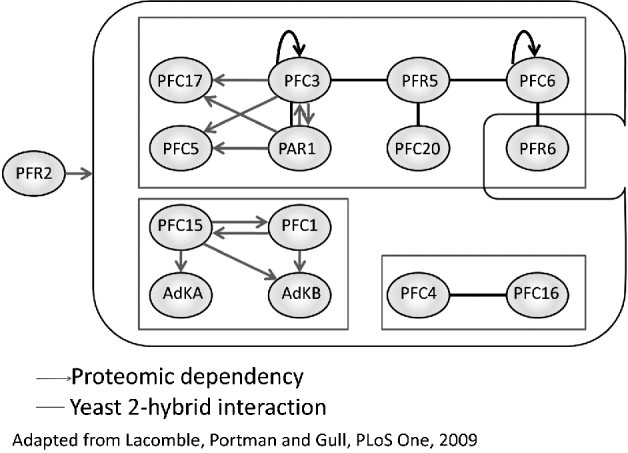
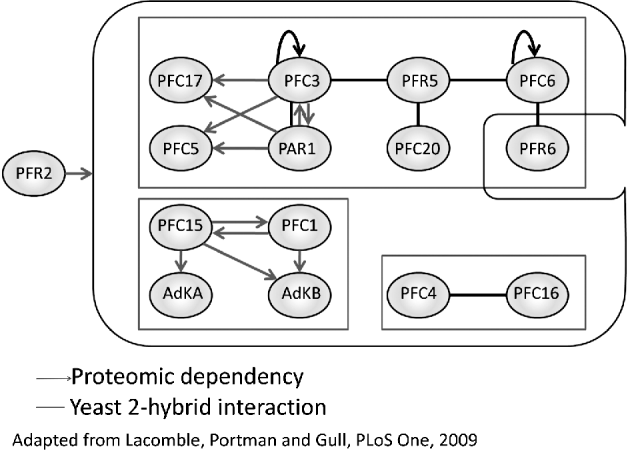
We were able to iterate the RNAi/comparative proteomic strategy with a set of these novel PFR candidates to define smaller co-dependent sub-groups of proteins within the PFR cohort (Fig. 2). One of these sub-groups supported a set of interactions observed in our coincident yeast 2-hybrid analysis of the PFR cohort (Lacomble et al. Reference Lacomble, Portman and Gull2009a). The other sub-group suggested a tantalising link between proteins predicted to contain domains involved with calcium sensing and the PFR specific adenylate kinases mentioned above. By combining RNAi and comparative proteomics in this way, we were able to begin to consider not only the composition of the PFR at the proteomic level but also the organisation of these components into complexes within the structure. This in turn provided some context to interactions detected by yeast 2-hybrid analysis in terms of directionality and hierarchy. Whether these relationships reflect the formation of complexes within the final PFR structure or perhaps transport or retention mechanisms during PFR formation has yet to be determined.
Complexes within the PFR. Schematic representation of interactions and dependencies detected in the PFR cohort. With the exception of PFR6 all of the components shown are dependent upon PFR2 for incorporation into the PFR. Within this overall dependency network, smaller subgroups of co-dependent and interacting components can be identified. Grey arrow=directional dependency relationship detected by comparative proteomics, black line=yeast 2-hybrid interaction.
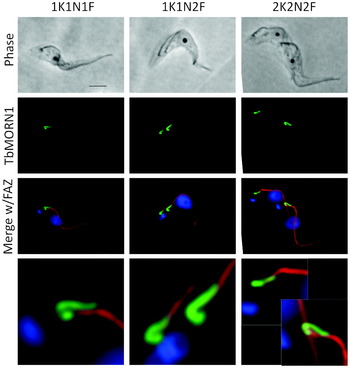
A powerful attribute of this comparative approach is the ability to investigate the proteomic composition of structures and sub-structures that are likely to be difficult to directly purify. The case of the PFR proteome and identification of smaller dependent sub-cohorts of proteins via the use of RNAi is a good example of this and recently efforts to identify components of a second hard-to-reach cytoskeletal structure have benefitted from the application of comparative proteomics techniques. The Bi-lobe structure of T. brucei was first defined as a localisation of TbCentrin2 adjacent to the Golgi in the vicinity of the flagellar exit point (He et al. Reference He, Pypaert and Warren2005). It was shown that the Golgi is associated with one lobe of the Bi-lobe structure and that the new Golgi assembles at the other lobe. During segregation of organelles and structures prior to cytokinesis the Bi-lobe structure itself duplicates and one Golgi remains associated with each Bi-lobe structure. RNAi mediated ablation of TbCentrin2 showed that this protein, and by extension the Bi-lobe structure, are required for Gogli duplication. The Bi-lobe structure occupies a fascinating and important area of the cell. In addition to its association with the Golgi it is also adjacent to the flagellar exit point and flagellar pocket collar and the initiation point of the FAZ (Lacomble et al. Reference Lacomble, Vaughan, Gadelha, Morphew, Shaw, McIntosh and Gull2009b) (Fig. 3). In kinetoplastids the flagellum emerges into a specialised vase-shaped invagination of the pellicular membrane known as the flagellar pocket. The flagellar pocket is the sole site for endo- and exo-cytosis (Landfear and Ignatushchenko, Reference Landfear and Ignatushchenko2001) and forms a constricted neck region at the point of flagellar emergence onto the exterior surface of the cell. The base of this constricted neck region is encircled by an electron-dense structure known as the flagellar pocket collar (Henley et al. Reference Henley, Lee and Takeuchi1978; Sherwin and Gull, Reference Sherwin and Gull1989) and it is in this region that the FAZ begins the connection of the flagellum to the cell body in T. brucei (Lacomble et al. Reference Lacomble, Vaughan, Gadelha, Morphew, Shaw, McIntosh and Gull2009b). The first component of the flagellar pocket collar, BILBO1, was recently identified and was shown to be required for either flagellar pocket biogenesis or possibly maintenance of this specialised membrane domain (Bonhivers et al. Reference Bonhivers, Nowacki, Landrein and Robinson2008). In order to identify components of trypanosome-specific structures such as the Bi-lobe structure, the Warren group recently compared the identifications made in our T. brucei flagellar complex proteome to the published flagellar proteomes of C. reinhardtii and Tetrahymena thermophila (Morriswood et al. Reference Morriswood, He, Sealey-Cardona, Yelinek, Pypaert and Warren2009), shortlisting T. brucei proteins that did not have homologues in either of these datasets. This led to the identification of TbMORN1 as a novel component of the Bi-lobe/flagellar pocket collar/FAZ nexus. This protein consists almost entirely of MORN (Membrane Occupation and Recognition Nexus) domains, which have previously been implicated in membrane/cytoskeleton interactions in a range of eukaryotes. TbMORN1 forms a lariat-shaped structure in the neck region that consists of a hook around the flagellum adjacent to the flagellar pocket collar and a finger-like extension adjacent to the proximal portion of the FAZ that partially colocalises with TbCentrin2 labelling at the Bi-lobe structure (Fig. 3). A second protein that localises to this region has now also been identified using a comparative proteomics approach. He and co-workers developed a protocol that allowed the purification of flagella from T. brucei without the associated ‘cell-body’ structures such as the FAZ, Bi-lobe structure and flagellar pocket collar (Zhou et al. Reference Zhou, Gheiratmand, Chen, Lim, Zhang, Li, Xia, Liu, Lin and He2010). Using iTRAQ to compare the composition of samples prepared in this way to samples prepared so as to preserve the associations with the FAZ etc., these investigators identified a number of proteins with higher relative abundance in samples containing the full flagellar complex. Amongst these were TbMORN1 and BILBO1 as well as previously hypothetical proteins localising to the FAZ, flagellar pocket and basal bodies. One of the identified proteins, a leucine-rich repeat containing protein designated as TbLRRP1, was shown to co-localise with TbMORN1 and on ablation by RNAi in the procyclic form resulted in cells in which Bi-lobe and Golgi duplication was inhibited. However, in these cells basal body and kinetoplast segregation and cytokinesis were also defective and were accompanied by the appearance of detached new flagella and a concomitant reduction in new FAZ structures. During cytokinesis the FAZ is thought to play a critical role in the positioning of cleavage furrow ingression which begins adjacent to the tip of the new FAZ (Robinson et al. Reference Robinson, Sherwin, Ploubidou, Byard and Gull1995). This role for the FAZ is most strikingly observed in the asymmetric division event that leads to the production of the long and short epimastigote forms in the tsetse proventriculus (Sharma et al. Reference Sharma, Peacock, Gluenz, Gull, Gibson and Carrington2008). The new flagellum and FAZ that form during this process are significantly shorter than the old flagellum, thus positioning the cleavage furrow such that a very long daughter cell and a very short daughter cell are formed. Flagellar attachment via the FAZ is also hypothesised to play an important role in the segregation of basal bodies and their associated kinetoplasts in the procyclic form in conjunction with the action of the flagella connector (discussed below) (Briggs et al. Reference Briggs, McKean, Baines, Moreira-Leite, Davidge, Vaughan and Gull2004). RNAi ablation of intraflagellar transport components (the conserved mechanism by which most eukaryotes assemble flagella (Kozminski et al. Reference Kozminski, Johnson, Forscher and Rosenbaum1993)) has demonstrated that the length of the FAZ is dependent upon the length of the flagellum (Davidge et al. Reference Davidge, Chambers, Dickinson, Towers, Ginger, McKean and Gull2006; Absalon et al. Reference Absalon, Blisnick, Kohl, Toutirais, Dore, Julkowska, Tavenet and Bastin2008) whereas ablation of FAZ components has shown that the reverse is not the case (LaCount et al. Reference LaCount, Barrett and Donelson2002; Vaughan et al. Reference Vaughan, Kohl, Ngai, Wheeler and Gull2008). Thus it is possible that TbLRRP1, situated as it is at the crucial position at which attachment of the growing new flagellum begins, plays an important role in mediating this initial attachment and therefore the ability of the cell, via the extension of the new flagellum, to generate a new FAZ. Whether this is a function of the Bi-lobe structure in its currently conceived form or whether the Bi-lobe itself is part of a larger conglomerate of structures encompassing the flagellar pocket collar and FAZ and incorporating proteins such as TbMORN1 and TbLRRP1 has yet to be determined. What is clear is that, given the predominance of single-copy structures and organelles in the trypanosome cell, strategies to intimately link the duplication and segregation of these together and to the mechanisms of cell division are likely to be of incredible benefit in ensuring faithful inheritance to both daughter cells.
TbMORN1 and the Bi-lobe. TbMORN1 (N terminal Ty epitope tag, green) localises to a nexus of critical cytoskeletal structures including the Bi-lobe, the flagellar pocket exit point and the FAZ (red). XKYNZF=X kinetoplasts, Y nuclei, Z flagella. Blue=DNA (DAPI), bar=5 mm.

COMPARATIVE PROTEOMICS AND THE CYTOSKELETON: OPPORTUNITIES IN THE LIFE CYCLE
The strategies described above involve the use of artificially generated mutants and different cell fractionation protocols in combination with proteomics techniques to investigate the composition of various cytoskeletal structures. However, another opportunity for the application of comparative proteomics techniques to the study of the cytoskeleton is presented by the morphological variations adopted by the parasite through its life cycle. Numerous studies have investigated differences between the transcriptomes of various life cycle stages, but the relative lack of annotated cytoskeletal components in terms of the molecular complexity of the structures involved renders the interpretation of these in purely cytoskeletal terms difficult (Brems et al. Reference Brems, Guilbride, Gundlesdodjir-Planck, Busold, Luu, Schanne, Hoheisel and Clayton2005; Koumandou et al. Reference Koumandou, Natesan, Sergeenko and Field2008; Jensen et al. Reference Jensen, Sivam, Kifer, Myler and Parsons2009; Kabani et al. Reference Kabani, Fenn, Ross, Ivens, Smith, Ghazal and Matthews2009; Siegel et al. Reference Siegel, Hekstra, Wang, Dewell and Cross2010). To date, no comprehensive comparison of life cycle stages at the level of protein expression has been presented but below we consider some of the known differences between life cycle stages that suggest that this type of analysis may be very informative, both in terms of the identification of components of hard-to-reach cytoskeletal structures and in the developmental cell biology of the parasite.
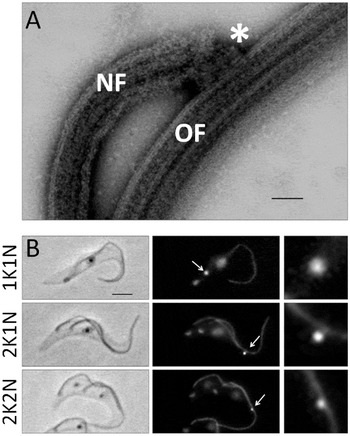
Trypomastigote forms constitute two of three of the proliferative stages within the life cycle (Fenn and Matthews, Reference Fenn and Matthews2007) (the third being the colonisation of the tsetse salivary glands by a proliferative epimastigote form (Sharma et al. Reference Sharma, Gluenz, Peacock, Gibson, Gull and Carrington2009)), the long slender form in the mammalian bloodstream and the procyclic form in the tsetse midgut. Although both forms are characterized as trypomastigotes, there are important differences between the two types in terms of the relative positions of structures and organelles and the organisation of these during the cell division cycles. At the ultrastructural level, the appearance of cytoskeletal structures such as the subpellicular microtubule array, the flagellum and the FAZ are essentially indistinguishable. However, in long slender bloodstream form cells the kinetoplast is located at the extreme posterior end of the cell whilst in procyclic forms it is positioned midway between the posterior tip and the nucleus. During cell division in procyclic forms the new flagellum and its associated kinetoplast migrate into the posterior of the cell in a process that has been hypothesised to involve the procyclic form-specific structure known as the flagella connector (Robinson and Gull, Reference Robinson and Gull1991; Briggs et al. Reference Briggs, McKean, Baines, Moreira-Leite, Davidge, Vaughan and Gull2004) (Fig. 4). The flagella connector is a mobile transmembrane junction that connects the tip of the new flagellum to the lateral aspect of the old flagellum, transmitting positional information from the existing cytoskeleton to the new one (Moreira-Leite et al. Reference Moreira-Leite, Sherwin, Kohl and Gull2001). The flagella connector tracks along the microtubule doublets of the old flagellum with the growing tip of the new flagellum (Fig. 4). It has been proposed that cessation of flagella connector migration, coupled with the continuing extension of the new flagellum and its attachment to the cell body via the FAZ, provides the necessary force to drive basal body and kinetoplast segregation (Briggs et al. Reference Briggs, McKean, Baines, Moreira-Leite, Davidge, Vaughan and Gull2004). A recent examination of the phenotype associated with RNAi-mediated ablation of the basal body protein TBBC, in which formation of both the flagella connector and FAZ are compromised, showed that basal body segregation is reduced providing some initial evidence in support of this model (Absalon et al. Reference Absalon, Kohl, Branche, Blisnick, Toutirais, Rusconi, Cosson, Bonhivers, Robinson and Bastin2007). However, the specific roles of the FAZ and flagella connector in this phenotype (as the FAZ was also shown to play an important role in basal body segregation) have yet to be elucidated and a fuller understanding of the particular role of the flagella connector in this process must await the identification of specific flagella connector components. Mitosis begins once separation of the kinetoplasts is well advanced with one of the daughter nuclei retaining a central position in the cell whilst the other migrates towards the posterior and assumes a position between the segregated kinetoplasts (Robinson et al. Reference Robinson, Sherwin, Ploubidou, Byard and Gull1995). In long slender bloodstream forms, however, there is relatively little separation of the kinetoplasts and both post-mitotic nuclei retain an anterior position relative to both kinetoplasts. Despite extensive investigation by our group and others, no canonical flagella connector structure has been described in long slender bloodstream forms, a finding that correlates with the reduced level of kinetoplast separation observed during division of these cells, given a role for the flagella connector in procyclic form kinetoplast separation. The reason for this difference in organelle positioning is not well understood. It is possible that the absence of the membrane-spanning flagella connector in long slender bloodstream forms reflects the immune evasion strategy of the parasite which functions by limiting the exposure of invariant surface antigens to the host humoral immune system (Barry and McCulloch, Reference Barry and McCulloch2001; Taylor and Rudenko, Reference Taylor and Rudenko2006; Horn and McCulloch, Reference Horn and McCulloch2010). Different challenges face the procyclic form and perhaps the elaboration of internal structures such as the mitochondrion, flagellar pocket and lysosome necessitate greater segregation of structures prior to cytokinesis to ensure faithful inheritance. The FC is a fascinating structure but is only known at the molecular level by a single monoclonal antibody (AB1) for which the antigen has not been determined (Fig. 3). We propose that the absence of a canonical flagella connector in long slender bloodstream forms presents an opportunity to investigate the molecular composition of this unique structure using comparative proteomic techniques.
The flagella connector. A. Negatively stained wholemount procyclic form cytoskeleton. The tip of the new flagellum (NF) is connected to the lateral aspect of the old flagellum (OF) by the flagella connector (*). Bar=200 nm. B. The flagella connector (arrow) tracks the tip of the new (posterior) flagellum through the cell cycle. Flagella labelled with L8C4 (PFR), flagella connector labelled with AB1. Bar=5 mm.

In addition to life cycle stage-specific structures such as the flagella connector, a growing body of evidence points towards important life cycle-related variations in the composition of other cytoskeletal structures. One of the first examples of this was the calpain-related protein CAP5.5 that is only expressed in procyclic form trypanosomes (Hertz-Fowler et al. Reference Hertz-Fowler, Ersfeld and Gull2001). Calpain homologues have been identified in almost all eukaryotes investigated and play roles in processes such as signalling and cytoskeletal organisation amongst many others (for a recent review see Ono and Sorimachi, Reference Ono and Sorimachi2012). Canonical or conventional calpains are restricted to animals and are a family of Ca2+-regulated cysteine proteases. In many calpain-related proteins, including CAP5.5, the calcium-sensitive domain is absent and the catalytic element degenerates. CAP5.5 localises to the whole cell body with the exception of the flagellum in a pattern consistent with an association with the microtubule cytoskeleton. The protein was shown to be both myristoylated and palmitoylated in vivo which, coupled with its strong association with the subpellicular microtubules, is suggestive of a role in mediating the close interaction between the subpellicular microtubule corset and the pellicular membrane. More recently, sequencing of the T. brucei genome (Berriman et al. Reference Berriman, Ghedin, Hertz-Fowler, Blandin, Renauld, Bartholomeu, Lennard, Caler, Hamlin, Haas, Bohme, Hannick, Aslett, Shallom, Marcello, Hou, Wickstead, Alsmark, Arrowsmith, Atkin, Barron, Bringaud, Brooks, Carrington, Cherevach, Chillingworth, Churcher, Clark, Corton, Cronin, Davies, Doggett, Djikeng, Feldblyum, Field, Fraser, Goodhead, Hance, Harper, Harris, Hauser, Hostetler, Ivens, Jagels, Johnson, Johnson, Jones, Kerhornou, Koo, Larke, Landfear, Larkin, Leech, Line, Lord, Macleod, Mooney, Moule, Martin, Morgan, Mungall, Norbertczak, Ormond, Pai, Peacock, Peterson, Quail, Rabbinowitsch, Rajandream, Reitter, Salzberg, Sanders, Schobel, Sharp, Simmonds, Simpson, Tallon, Turner, Tait, Tivey, Van Aken, Walker, Wanless, Wang, White, White, Whitehead, Woodward, Wortman, Adams, Embley, Gull, Ullu, Barry, Fairlamb, Opperdoes, Barrell, Donelson, Hall and Fraser2005) allowed the identification of an in-paralogue of CAP5.5 which was named CAP5.5 V (Olego-Fernandez et al. Reference Olego-Fernandez, Vaughan, Shaw, Gull and Ginger2009). The coding sequence for CAP5.5 V is located on a sub-telomeric portion of chromosome 8 that derives from a relatively recent duplication of a 0·5Mb section of chromosome 4 which includes the locus for CAP5.5. The protein sequences of CAP5.5 and CAP5.5 V differ significantly only in the C terminus and both N terminal acylation sites are preserved in CAP5.5 V. CAP5.5 V mRNA is detectable in monomorphic bloodstream forms but not in procyclic forms, in direct contrast to the expression profile of CAP5.5. Inducible RNAi directed against the C terminal coding sequence of each gene allowed the specific knockdown of each protein individually. In both life cycle stages, knockdown of the corresponding protein resulted in a slowdown of population growth rate and the accumulation of cells with abnormal numbers of nuclei and/or kinetoplasts, particularly the 1K0N cytoplasts known as zoids, a phenotype consistent with organelle or cleavage furrow mispositioning during cytokinesis. In procyclic forms, the posterior end of cells became denuded of CAP5.5 within a single cell cycle. Cells in both lifecycle stages showed abnormalities in the organisation of microtubules in the subpellicular corset following RNAi directed against the endogenous protein. Bundles of cytoplasmic microtubules were observed, particularly in the posterior end of the cell in the vicinity of the flagellar pocket and the normally invariable inter-microtubule spacing was disrupted. Given the proteolytic activity of calpains, it is tempting to speculate on a model whereby CAP5.5 and CAP5.5 V play a role in creating or breaking inter-microtubule connections. However, proteolytic activity of either CAP5.5 or CAP5.5 V has not yet been demonstrated and is perhaps unlikely due to the degeneracy in the catalytic active site. It is therefore more likely that these proteins play a structural role in the cytoskeleton, perhaps forming an integral part of the inter-microtubule connections themselves. Importantly, this study highlights that CAP5.5 and CAP5.5 V appear to play analogous roles in the two life-cycle stages studied.
The paralogous proteins CAP15 and CAP17 are small (15 kDa and 17 kDa, respectively) proteins that have been shown to stabilise microtubules when expressed in mammalian cells and share around 50% sequence identity distributed across the length of the proteins (Vedrenne et al. Reference Vedrenne, Giroud, Robinson, Besteiro, Bosc, Bringaud and Baltz2002). CAP17 contains an additional 20 residue hydrophobic domain in the C terminus. These proteins were identified by comparison of bloodstream and procyclic form lysates following separation by SDS-PAGE. Further analysis by Western blot using specific antisera raised against each protein determined that CAP17 is not expressed in the bloodstream form whereas CAP15 is expressed in both life cycle stages examined but is tenfold more abundant in bloodstream form extracts. Immunolocalisation of both proteins showed a pattern consistent with an association with the subpellicular microtubule corset but interestingly only in the anterior part of the cell. Overexpression of either protein relocated the signal to an even distribution across the microtubule array, similar to that observed for CAP5.5. Overexpression of either protein in procyclic forms resulted in an organelle positioning/cytokinesis defect phenotype qualitatively similar to that discussed above. The authors postulate that these CAPs play a role in the stabilisation of microtubules in the less dynamic anterior portion of the cell and that the redistribution of protein as a result of overexpression over-stabilises the dynamic posterior end of the cell leading to organelle positioning and segregation defects. As with CAP5.5, both proteins have analogous localisations and appear to have similar functions.
The transmembrane domain-containing glycoprotein protein fla1 is an essential component of the FAZ, occupying a position on the external surface of the cell between the pellicular and flagellar membranes. The initial characterization of fla1 used an antibody raised against the N terminal portion of the protein to demonstrate expression in both bloodstream and procyclic forms (Nozaki et al. Reference Nozaki, Haynes and Cross1996). However, the recent completion of the T. brucei genome sequencing project (Berriman et al. Reference Berriman, Ghedin, Hertz-Fowler, Blandin, Renauld, Bartholomeu, Lennard, Caler, Hamlin, Haas, Bohme, Hannick, Aslett, Shallom, Marcello, Hou, Wickstead, Alsmark, Arrowsmith, Atkin, Barron, Bringaud, Brooks, Carrington, Cherevach, Chillingworth, Churcher, Clark, Corton, Cronin, Davies, Doggett, Djikeng, Feldblyum, Field, Fraser, Goodhead, Hance, Harper, Harris, Hauser, Hostetler, Ivens, Jagels, Johnson, Johnson, Jones, Kerhornou, Koo, Larke, Landfear, Larkin, Leech, Line, Lord, Macleod, Mooney, Moule, Martin, Morgan, Mungall, Norbertczak, Ormond, Pai, Peacock, Peterson, Quail, Rabbinowitsch, Rajandream, Reitter, Salzberg, Sanders, Schobel, Sharp, Simmonds, Simpson, Tallon, Turner, Tait, Tivey, Van Aken, Walker, Wanless, Wang, White, White, Whitehead, Woodward, Wortman, Adams, Embley, Gull, Ullu, Barry, Fairlamb, Opperdoes, Barrell, Donelson, Hall and Fraser2005) has revealed a paralogous fla1 family protein, represented as two nearly identical open reading frames, in a repeated region of chromosome 8. This protein, now named as fla2 (LaCount et al. Reference LaCount, Barrett and Donelson2002), shares extensive homology with fla1 in the N terminus and the two would likely be indistinguishable by antibodies raised against epitopes in this area. A recent microarray analysis of transcripts from bloodstream and procyclic forms identified fla1 as being significantly up-regulated in the procyclic form (Koumandou et al. Reference Koumandou, Natesan, Sergeenko and Field2008). Interestingly, in the same study fla2 was found to be significantly up-regulated in the bloodstream form. fla1 shares 65% identity with fla2 at the level of protein sequence and the latter contains a 44 residue proline-rich insert at approximately the midpoint of the protein that is not present in fla1. Although the differences between fla1 and fla2 have yet to be fully investigated, it is interesting to note that these proteins are likely to be exposed on the cell surface and variants may therefore be required as part of the different surface coat environments in the two life cycle stages. The possession of a proline-rich insert in fla2 suggests a high level of secondary structure in this region which may serve to generate vertical or horizontal space in the dense VSG coat, facilitating interactions with other external FAZ components.
Recent work from Bastin and co-workers (Rotureau et al. Reference Rotureau, Subota and Bastin2011) has also provided evidence for a remodelling of the FAZ during the life cycle transition from mesocyclic to epimastigote forms in the tsetse proventriculus. In this work, two components of the FAZ, FAZ1 (Vaughan et al. Reference Vaughan, Kohl, Ngai, Wheeler and Gull2008) and the as yet unidentified DOT1 antigen, were shown to drop below detectable levels during the morphological remodelling preceding the asymmetric division that forms the long and short epimastigotes. Both proteins were subsequently detectable in the short daughter cell but remained absent in the long daughter cell. These authors hypothesised that this remodelling of the FAZ may be linked to the migration of the nucleus (which remains attached to the FAZ after detergent extraction) towards the posterior of the cell in the mesocyclic form.
Gene expression in kinetoplastids is unusual amongst eukaryotes. Genes are transcribed in large polycistronic units and most expression control occurs post-transcriptionally. Additionally, kinetoplastids have very few introns so all protein complexity is encoded as individual open reading frames. It is almost certainly this unusual genome organisation that results in the development of stage-specific paralogous sets of proteins, but the driving mechanisms that necessitate different isoforms in different life cycle stages are so far unclear. Our own unpublished analysis suggests that there are more such life cycle regulated sets of cytoskeletal protein families and the extent to which the composition of the cytoskeleton is regulated in this way is likely to provide important insights into the particular adaptations imposed upon the parasite by the demands and challenges encountered during its life cycle.
CONCLUSION
Over recent years high-throughput and whole-cell analysis techniques have advanced rapidly, aided in no small part by equally rapid advancements in the speed and processing power of modern microprocessors. These advancements enable the kind of transcriptomic, proteomic and electron-tomographic studies that are now shaping our understanding of the trypanosome cytoskeleton. As a model organism T. brucei is almost uniquely suited to these types of approaches. The high level of temporal and spatial organisation of the cell lends itself incredibly well to interrogation at the ultrastructural level using electron tomography and the availability of a completed and well annotated genome, in conjunction with the inherent lack of introns in the genome, are a boon to both genomic and proteomic analyses. The well-established and widely available molecular biological toolkit enables the rapid translation of candidate screens into analyses of protein localisations, functions and interactions. Numerous high-throughput screens have provided cellular level analyses of proteomic composition, mRNA level and protein function, incredibly valuable data that are actively curated and included in readily accessible databases such as GeneDB and TriTrypDB.