I. INTRODUCTION
Integrated chip design over the past 5 decades has focused on physical size reduction for a number of reasons.1,Reference Moore2 Transistors become faster and consume less power as they become smaller.Reference Moore2 Manufacturing costs per chip also reduce as the number of chips on a production wafer increases. Building a higher performance chip at lower cost is a strong market driver for chip size reduction, but smaller than a certain minimum device size the challenges of design, integration, and yield rapidly increase costs. This interplay between manufacturing efficiency and production complexity means that for a given year there will be a minimum cost associated with integration of a certain number of components. Cited as “Moore's Law,” Gordon Moore projected that the number of components associated with this minimum cost will double every 1–2 years,Reference Moore3 and this projection has been the industry driven timeline for multiple decades.Reference Moore3 But transistors aren't the only limiters of integrated circuit performance. Currently, the speed of integrated chips is more limited by signal delays in the wires that connect up transistors (also called the back-end interconnects) than the transistors themselves.Reference Volksen, Miller and Dubois4 These delays are called RC delays because the amount of delay time, τ, is the product of resistance, R, and capacitance between neighboring lines, C (τ = RC). Reducing the delay attributed to backend interconnects is therefore critical in delivering overall improved circuit performance in the next generation of computer chips. While the resistances, R, of the interconnect metal lines and vias are an active area of research and development, there are plenty of opportunities to improve delay by reducing the capacitance, C, of the interlayer dielectric (ILD) materials used to separate the metal lines. The capacitance, C, of a material that exists between two semi-infinite metal plates each having area, A, and separation, d, is given by
 $$C = {{k{\varepsilon _0}A} \over d}\quad ,$$
where k is the relative permittivity or dielectric constant of the ILD material and ε0 is the permittivity of vacuum. While this semi-infinite model doesn't hold well for interconnect architectures due to increased fringing fields and additional complexity,Reference Husain5,Reference Maex, Baklanov, Shamiryan, Brongersma and Yanovitskaya6 the equation above correctly represents that lowering the ILD k-value is the material engineer's only knob for reducing interconnect capacitance; the physical dimensions (A and d from the equation above) are constrained by design rules typically determined by size scaling. Next generation ILD materials will need to be carefully crafted to deliver a reduction in k while also delivering needed mechanical and chemical stability properties. Many established avenues for k reduction have led to degradation of these properties.Reference Volksen, Miller and Dubois4,Reference Lionti, Volksen, Magbitang, Darnon and Dubois7 The k-value is determined by:
 $${{(k - 1)} \over {(k + 2)}} = {{N\alpha } \over {3{\varepsilon _0}}}\quad ,$$
where N is the number of polarizable units per volume, and α is that unit's polarizability described as:
 $$\alpha \, = \,{\alpha _{\rm{e}}} + {\alpha _{\rm{d}}} + {\alpha _{\rm{o}}}\quad ,$$
which is the sum of electronic, distortion, and orientation polarizabilities. These principles as applied to ILDs have been reviewed extensively in the literature already.Reference Volksen, Miller and Dubois4,Reference Maex, Baklanov, Shamiryan, Brongersma and Yanovitskaya6,Reference Baklanov, Ho and Zschech8 The major points are that ILDs are typically composed of low-density materials (i.e., low N) and made from atoms of low atomic number (e.g., Si, C, O, N, H, and/or sometimes F) to reduce αe.
Few manufacturable dense materials exhibit k-values less than 2.4; to target the International Technology Roadmap for Semiconductors (ITRS)1 for backend dielectrics, ILD materials are deliberately made to have low densities.Reference Grill, Patel, Rodbell, Huang, Baklanov, Mogilnikov, Toney and Kim9 When the density becomes low enough, the material becomes porous with pore sizes greater than 1 nm in size.Reference Moore3 The Maxwell Garnett (MG) approximationReference Choy10 gives the functional form of the composite dielectric constant, k, when a dilute volume fraction, δ, of spherical inclusions of one material, k 1, is mixed into a host matrix of material with dielectric constant k 0.
 $$k = {k_0}{{{k_1}\left( {1 + 2\delta } \right) - {k_0}\left( {2\delta - 2} \right)} \over {{k_0}\left( {2 + \delta } \right) + {k_1}\left( {1 - \delta } \right)}}\quad .$$
For a porous material having a dilute amount of spherical voids of vacuum (k 1 = 1) with porosity, P = δ, the MG approximation simplifies to:
 $$k = {k_0}{{\left( {1 + 2P} \right) - {k_0}\left( {2P - 2} \right)} \over {{k_0}\left( {2 + P} \right) + \left( {1 - P} \right)}}\quad .$$
Due to their strength, thermal stability, and relatively low bulk polarizability, carbon-doped oxide “SiCOH” materials are often used as ILDs and have nonporous (k 0) values around 3.0–4.0.Reference King, French, Bielefeld and Lanford11 To target effective dielectric constants below 2.2, these materials need to be fabricated to have porosities greater than 35–50% volume [Eq. (5)]. At these porosities, the pore structure is almost entirely interconnected.Reference Mu, Liu, Huang and Djilali12–Reference Petkov, Weber, Lynn and Rodbell15
The integration of highly porous materials presents a number of challenges due to the reduced mechanical strength of porous networksReference Zhou, Bailey, Sooryakumar, King, Xu, Mays, Ege and Bielefeld16 and the diffusion of materials (metalsReference Kim17 or reactive etch gasesReference Baklanov, de Marneffe, Shamiryan, Urbanowicz, Shi, Rakhimova, Huang and Ho18–Reference Kunnen, Barkema, Maes, Shamiryan, Urbanowicz, Struyf and Baklanov21) into it. As an example, the left side of Fig. 1(a) shows a cross-sectional scanning electron microscope (SEM) image of the pattern fidelity after trench etch outlined by the yellow dotted line. Due to the porosity of the film, the highly reactive plasma etch gases diffused into the film and caused chemical damage (in the form of carbon depletion),Reference Lionti, Volksen, Magbitang, Darnon and Dubois7,Reference Goldman, Graves, Antonelli, Behera and Kelber19,Reference Richard, Iacopi, Bender and Beyer20,Reference Worsley, Bent, Gates, Fuller, Volksen, Steen and Dalton22 such that aqueous HF trench cleans etched away the C-depleted regionsReference Louveau, Bourlot, Marfoure, Kalinovski, Su, Hills and Louis23; the resulting trench shape relative to the yellow line highlights the isotropic diffusion/damage profile of the etch gas species. If the damage is severe enough, profiles can start to delaminate [Fig. 1(a)].Reference Singh, Mertens, Meuris and Heyns24Figure 1(b) shows a tilted cross-sectional SEM image after trench etch, aqueous cleans, and drying on tight-pitch trench patterning. As the trench etch and aqueous cleans typically makes the surfaces of the ILD hydrophilic, the drying step can generate sufficient hydrodynamic (capillary) force to overcome the mechanical strength of the ILD and pull opposing lines of ILD together into a “zipper” structure.Reference Chawla, Singh, Myers, Michalak, Schenker, Jezewski, Krist, Gstrein, Indukuri and Yoo25Figure 1(c) shows a top-down SEM image after trench etch where the compressive stress of the upper hardmask is able to overcome the restoring mechanical force of the ILD and bend patterned lines into wiggling “S-curves.”Reference Baklanov, de Marneffe, Shamiryan, Urbanowicz, Shi, Rakhimova, Huang and Ho18,Reference Darnon, Chevolleau, Joubert, Maitrejean, Barbe and Torres26–Reference Chawla, Chebiam, Akolkar, Allen, Carver, Clarke, Gstrein, Harmes, Indukuri, Jezewski, Krist, Lang, Myers, Schenker, Singh, Turkot and Yoo28 Figure 1(d) is a cross-sectional transmission electron microscope (TEM) image showing penetration of the barrier metal into the porous ILD during deposition,Reference Hamioud, Arnal, Farcy, Jousseaume, Zenasni, Icard, Pradelles, Manakli, Brun and Imbert29,Reference Fayolle, Passemard, Louveau, Fusalba and Cluzel30 which could present a reliability risk due to metal diffusion.Reference Rodriguez, Gill, Plawsky, Tsui and Grunow31 Due to these challenges, some companies are moving toward the integration of lower porosity materials. Successful implementation of highly porous materials will require both novel integration and proper material design. After a brief description of some of the proposed methods for the integration of highly porous ILD materials, the rest of this paper will focus solely on the materials challenge associated with generating a highly porous material with optimal properties.
Examples of integration challenges using porous ILD materials: (a) cross-sectional SEM image of CD blow out during cleans; (b) tilt SEM image of line collapse during cleans; (c) top-down SEM image of line wiggling after trench etch, and (d) cross-section TEM image of metal penetration into the underlying ILD during deposition.

Academic and industrial researchers have proposed clever solutions to the integration of porous low-k materials by making certain regions of the ILD nonporous. Initially, it was proposed to integrate the as-deposited nonporous composite of backbone and porogen species through metallization and to remove the porogen species at a later stage.Reference Fayolle, Jousseaume, Assous, Tabouret, Le Cornec, Haumesser, Leduc, Feldis, Louveau, Passemard and Fusalba32 While the nonporous composite film minimized diffusion of reactive etch gases during etch or metal species during deposition, film shrinkage during final porogen removal led to reliability issues. As proposed by IBM, the post porosity plasma protection (“P4”) scheme involves temporarily infusing a fully cured porous ILD with a second pore-filling material that can be removed without damage to, or shrinkage of, the backbone network.Reference Lionti, Volksen, Magbitang, Darnon and Dubois7,Reference Frot, Volksen, Purushothaman, Bruce and Dubois33,Reference Frot, Volksen, Purushothaman, Bruce, Magbitang, Miller, Deline and Dubois34 Another option for etch protection is to use a sufficiently low temperature etch such that nonreactive etch gases spontaneously diffuse into and reside within the porous network of the bulk material.Reference Zhang, Ljazouli, Lefaucheux, Tillocher, Dussart, Mankelevich, de Marneffe, de Gendt and Baklanov35 The condensed gases then prevent the diffusion of highly reactive species during etch and therefore minimize backbone damage in a method similar to P4. The difference is, however, that when the film warms up to room temperature, the condensed gases cleanly boil off to regenerate the porous network. A different scheme to prevent diffusion during metal deposition is to make the top surface of the ILD nonporous through either the deliberate addition of new material,Reference Kayaba, Tanaka, Suzuki, Kohmura and Ono36,Reference Jiang, Liu, Gerung, Cecchi and Brinker37 called pore sealing, or through surface densification by plasmas.Reference Moon, Iijima, Malhotra, Simon, Shaw, Ryan, Labelle, Fuller, Bolom, Dunn, Flaitz, Mehta, Inoue and McGahay38,Reference Puyrenier, Rouessac, Broussous, Rébiscoul and Ayral39 As opposed to the P4 process, the sealing layers remain in the structure and can increase the total effective capacitance. A more detailed discussion of pore sealing can be found in the review by Maex et al., and the references within.Reference Maex, Baklanov, Shamiryan, Brongersma and Yanovitskaya6
While the processes described above can provide temporary strength to low-k ILDs during integration, porous ILD materials will ultimately need to be strong enough to survive subsequent chemical treatments as well as mechanical stresses such as chemical mechanical polish (CMP)Reference Fayolle, Passemard, Louveau, Fusalba and Cluzel30 and packaging stressesReference Fu, Su, Kuechenmeister and Huang40 at end of line. To this end, designing chemically stable, highly porous, mechanically robust ILD materials is critical to ensuring success of capacitance reduction schemes. This has been a difficult challenge for the industry as it has often been possible to deliver 2 but not all 3 of these critical parameters in one ILD material. In the Components Research Division of Intel Corporation, we have designed a porogen-backbone system we call TITAN that provides improvement on all three of these critical parameters through careful design of the backbone and porogen precursors. In hopes to spur more research and development on low-k films, we share some concepts we found critical to the development of porous low-k films.
II. DEPOSITION AND MOLECULAR DESIGN OF HIGHLY POROUS DIELECTRIC MATERIALS
Industrial dielectric thin film materials are deposited primarily using two methods: plasma-enhanced chemical vapor deposition (PECVD) and spin-on. Much of the early work on porous low-k films was performed by chemical suppliers (e.g., Shipley, JSR, Rohm and Hass, Dow and others) using the spin-on technique. Due to the challenges associated with inserting new materials into integration processes optimized on other materials, early spin-on films suffered from extreme chemical and mechanical damage.Reference Mosig, Jacobs, Brennan, Rasco, Wolf and Augur41 It wasn't long, therefore, before PECVD films showed significant results and industrial interest. Over the past decade and a half, there has been a lot of successful research into the chemical mechanisms underlying the structure–property relations of porous materials, and the result is that both spin-on and PECVD materials are currently showing significantly improved properties. The review articles by Volksen et al.,Reference Volksen, Miller and Dubois4 Maex et al.,Reference Maex, Baklanov, Shamiryan, Brongersma and Yanovitskaya6 and the references therein provide excellent background on material development and integration challenges of these materials. Below, we will briefly summarize the critical processing steps needed to make highly porous films, with a larger focus on the spin-on technique because TITAN is a spin-on film.
Figure 2 shows a typical scheme for the fabrication of highly porous materials involving molecular units that will make up the backbone network of the final film (green dots) and molecular units that are volume placeholders (white dots) often referred to as “porogens.” By adding more porogen into the film, the resulting porosity is expected to be increased.Reference Grill42 For spin-on films, the first step is to create a stable liquid solution consisting of solvent, backbone, and porogen species, the latter of which are typically large molecules or polymeric oligomers.Reference Jousseaume, Rolland, Babonneau and Simon43 The solution is then deposited on a wafer by spin coating and a randomly organized solid mixture [Fig. 2(a)] is expected after solvent removal bake. The next step in the process is to apply a stimulus (e.g., heat, light, etc.) that will cause the backbone (and possibly also the porogen) species to crosslink into a solid network [Figs. 2(b)].Reference Padovani, Rhodes, Allen and Kohl44,Reference Volksen, Magbitang, Miller, Purushothaman, Cohen, Nakagawa, Nobe, Kokubo and Dubois45 For spin-on materials, this process is typically a mild thermal bake at 100–300 °C for a few minutes and is therefore referred to as a “soft bake.” The amount of crosslinking can be inferred by the amount of thickness loss after solvent rinses. Films deposited using a PECVD techniqueReference Grill, Patel, Rodbell, Huang, Baklanov, Mogilnikov, Toney and Kim9,Reference Favennec, Jousseaume, Rouessac, Fusalba, Durand and Passemard46 are formed from highly reactive gas-phase free-radicals that can couple into a cross-linked covalent bond network as deposited [Fig. 2(b)].
A graphical description of (a) the porogen and backbone mixture that is coated on a wafer, (b) the resulting network after the backbone species have crosslinked via covalent bonds, and (c) the resulting network after the porogen molecules have been selectively removed.
The final step in the formation of PECVD or spin-on porous films includes removal of the porogen species [Fig. 2(c)], which can be performed through thermal decomposition,Reference Jousseaume, Rolland, Babonneau and Simon43 selective plasma etch process,Reference Urbanowicz, Vanstreels, Verdonck, Shamiryan, De Gendt and Baklanov47 or solvent extraction.Reference Seino, Wang, Lofgreen, Puzzo, Manabe and Ozin48,Reference Hatton, Landskron, Whitnall, Perovic and Ozin49 The resulting film is a porous network of backbone species, may contain porogen residues,Reference Marsik, Verdonck, De Roest and Baklanov50–Reference Urbanowicz, Vanstreels, Shamiryan, De Gendt and Baklanov52 and may be subsequently cured by treatment with UV, e-beam, or other film hardening processes.Reference Verdonck, De Roest, Kaneko, Caluwaerts, Tsuji, Matsushita, Kemeling, Travaly, Sprey, Schaekers and Beyer53–Reference Owada, Ohara, Watatani, Kouno, Kudo, Ochimizu, Sakoda, Asami, Ohkura, Fukuyama, Tsukune, Nakaishi, Nakamura, Nara and Kase59 Spin-on materials typically undergo porogen removal through a “hard bake” thermal degradation step at temperatures in the range of 350–450 °C for a few minutes followed by a UV or e-beam cure process for hardening. PECVD materials often go directly from deposition to e-beam or UV cure process for simultaneous removal of porogen and backbone hardening, but these steps can be separated.
To work successfully within the spin-on deposition technique, several critical chemical properties had to be designed into the TITAN backbone precursor. The first three key properties are high molecular weight (MW ≳ 500 Da), a high number of thermally activated functional groups for cross-linking, and following network formation, inherent thermal stability at 400–450 °C. The high molecular weight is needed to prevent volatilization during soft bake conditions.Reference Dubois, Volksen, Magbitang, Sherwood, Miller, Gage and Dauskardt60 The thermally activated groups also need careful consideration: they should not be so reactive that they crosslink at a non-negligible rate at room temperature, which can lead to precipitation during shelf storage.Reference Volksen, Magbitang, Miller, Purushothaman, Cohen, Nakagawa, Nobe, Kokubo and Dubois45 But these groups need to be reactive enough such that the controlled crosslinking reactions can occur below or near the glass transition temperature (T g) of the solid mixture of Fig. 2(a). If a crosslinking reaction requires a temperature higher than T g, then the solid mixture of Fig. 2(a) may evolve into a mobile state which can lead to material agglomeration (thickness roughness) and backbone/porogen phase separation.
The porogen species also require careful chemical control. Typically they are hydrocarbon materials that can be selectively removed either completely or incompletely to leave behind porogen residue species by thermal decomposition at 400 °C. For spin-on materials, the porogen species will need to be of similar polarity as, and/or possibly reactive with, the backbone precursor to be soluble in the same solvent and to not phase segregate into large irregularly placed “killer pores” during soft bake.Reference Padovani, Rhodes, Allen and Kohl44,Reference Min, Moon, Kim and Rhee61,Reference Yim, Seon, Jeong, Pu, Baklanov and Gidley62 Such killer pores have radii in the 20–50 nm size range, are clearly observable by cross-section SEM, and represent excursions in an otherwise tightly controlled and much smaller pore size distribution. We have observed both solubility and killer pore size challenges when the backbone and porogen polarity values are not properly tuned. Further information on the chemical optimization of porogen species can be found in the review articles of Volksen et al.,Reference Volksen, Miller and Dubois4 and the reference therein.
The backbone molecular species for TITAN and other related films were created through chemical synthesis in our materials chemistry lab. We have found that the number of highly reactive groups on a backbone oligomer is critical to achieve high porosities. Conceptually, in order for the network of Fig. 2(c) to be able to retain its shape, the backbone molecular units need to be rigid enough to preserve bond angles and must have the ability to bond to multiple neighbors (up to 4 is shown in Fig. 2). It is clear that a backbone molecular unit that can only bond to two neighbors won't be able to form a highly cross-linked network.
We designed four backbone oligomer molecules with different integer numbers, n, of reactive groups. Each oligomer was separately mixed with different amounts of porogen, deposited on wafers, soft baked at 200 °C for 5 min, hard baked at 400 °C for 10 min, measured on a variable angle spectroscopic ellipsometer (VASE), and fit to Cauchy models with good mean square error values. The refractive index (RI) values, which can be used to monitor porosity,Reference Baklanov and Mogilnikov63,Reference Kim, Son and Ko64 at an optical wave length of 637 nm are presented in Fig. 3. Without the addition of porogen (x = 0), all films were non-porous with refractive indices between 1.48 and 1.52. This variation in RI is likely due to slight film compositional changes as a result of adjusting the relative amounts of reactive versus non-reactive functional groups. With increased mass loading of porogen, the different precursors resulted in different final RI, and hence porosity, values after hard bake. For n = n (Fig. 3, red squares), no porosity was observed due to the RI always being greater than 1.48. In this case the number of reactive groups was too small for the cross-linked network to maintain its shape and the network collapsed (i.e., lost thickness) upon porogen burn out. The increase in RI at high porogen loadings is expected to be due to the increased amount of porogen residues at high loading fractions. As the number of reactive groups per backbone molecule is increased (e.g., from n = 2n, to 2.5n, to 5n), the resulting films exhibit increasingly lower film shrinkage and increasingly lower RI values with increased porogen loading. The TITAN film, which contains 5n reactive groups per backbone molecule (Fig. 3, green circles), showed the lowest film RI values, and was the focus of further study.
RI values after hard bake for films made from Intel-synthesized backbone molecules containing various numbers of thermally active reactive groups mixed with various amounts of porogen. Solid lines are guides for the eye and do not represent fits to the data to any functional form. The reason for the differing trends in RI versus porogen loading for various n is currently unknown, but could stem from different yields of porogen residue incorporation versus n and/or different packing geometries of porogen and backbone versus porogen loading and n.
While the data presented here clearly demonstrate the importance of the number of backbone reactive groups in establishing a strong porous network, similar trends in porosity versus collapse have been observed for PECVD films made from the same backbone precursor but with different porogen species.Reference Grill42 The model of Fig. 2 is therefore simplistic in that the chemical distinction between backbone and porogen will start to blur; the film is not well approximated by distinct circles of unique color. Consistently, PECVD films have been shown to exhibit chemical scrambling between porogen and backbone precursors during deposition and cure, and the resulting film network may not correlate with the properties of the individual components.Reference Hurley, Du, McDaniel, Peterson, Weigel, Haas, Vrtis, Sinatore, Bitner, Theodorou, Lin, Ryan, Wu and Yoon65 While the relatively lower chemical energy available during spin-on processes (i.e., no plasma) would suggest relatively smaller chemical interaction during deposition, backbone-porogen interactions could still occur during baking steps. Specifically, porogen molecules may decompose into volatile species and/or partially into fragments that connect backbone unit that might not have otherwise formed. In such cases, the chemical interactions between backbone and porogen species can play a role in the final network structure, strength, and porosity; understanding these interactions is an important part of material design.
The set of TITAN films of various porogen loading was cured at 400 °C or greater under broadband UV illumination using a conventional tool for 1 min.Reference Verdonck, De Roest, Kaneko, Caluwaerts, Tsuji, Matsushita, Kemeling, Travaly, Sprey, Schaekers and Beyer53,Reference Iacopi, Travaly, Eyckens, Waldfried, Abell, Guyer, Gage, Dauskardt, Sajavaara, Houthoofd, Grobet, Jacobs and Maex66,Reference Guo, Jakes, Nichols, Banna, Nishi and Shohet67 This process improved the mechanical strength and made the films more hydrophobic, but only mildly changed RI, porosity, and pore size distribution, which were measured using standard ellipsometric porosimetry (EP).Reference Grill, Patel, Rodbell, Huang, Baklanov, Mogilnikov, Toney and Kim9,Reference Baklanov and Mogilnikov63,Reference Baklanov, Mogilnikov, Polovinkin and Dultsev68,Reference Licitra, Bouyssou, Chevolleau and Bertin69 EP results from toluene and 2-propanol were nominally identical with errors in the 1% volume range and the data are shown in Fig. 4. The dielectric constant, k, values of the TITAN films were measured on a Hg probe with calibrated area of 0.022 ± 0.01 cm2 at a measurement frequency of 100 kHz under accumulation voltage conditions. Also shown in Fig. 4 are other PECVD ILD films (The ILD0, ILD1, ILD2, and ILD3 PECVD films in this work are merely meant to represent the range of properties attainable with this deposition technique and are not meant to represent industry standard or state-of-the-art values. Their results are included because they could be measured on the exact same toolsets under the exact same conditions as the TITAN film; they are therefore meant as a general reference and not as a basis for fundamental chemical or structural comparison.) and two forms of the Maxwell Garnett approximation [Eq. (4)]: the solid black line (MG Fit 1) was obtained by assuming spherical voids of vacuum (k 1 = 1) in a bulk matrix of TITAN ILD (k 0 = 3.4); the broken black line (MG Fit 2) was obtained by assuming spherical inclusions of TITAN ILD (k 1 = 3.4) residing in vacuum (k 0 = 1.0). Taken together, the two MG cases are expected to bound the real structure of the ILD as it transitions from low porosity (better fit by MG Fit 1) to high porosity (better fit by MG Fit 2). Due to the high number of reactive groups on the backbone molecules, n, the TITAN film can achieve porosities as high as 60% and k-values consistent with the Maxwell Garnett approximation as low as 1.60.
Dielectric constant, k, values for the porous TITAN and other PECVD films relative to the Maxwell Garnett models as a function of their pore volume.
III. CHEMICAL STABILITY OF DIELECTRIC THIN FILMS
Films of porosity greater than 30% are generally assumed to have a completely interconnected pore network as predicted by percolation theory.Reference Mu, Liu, Huang and Djilali12–Reference Petkov, Weber, Lynn and Rodbell15 This presents a serious challenge to integration from a diffusion perspective: etch and cleans chemicals can permeate and chemically react with, aka “damage,” the network; downstream atomic layer deposition (ALD), CVD, and/or PECVD deposition can result in the infiltration of metals into dielectrics, which could be bad for electrical leakage, capacitance, and/or reliability reasons. Of particular concern are dry etch processes not only because the etch plasma is specifically designed to react and volatilize the backbone species but also because plasma processes tend to eliminate pendant Si–CH3 groups needed for hydrophobicity.Reference Worsley, Bent, Gates, Fuller, Volksen, Steen and Dalton22,Reference Bonilla, Shaw, Liniger, Cohen, Gates, Grill, Shobha, Penny and Ryan70 The chemically damaged areas of the bulk porous material tend to absorb moisture,Reference Licitra, Bouyssou, Chevolleau and Bertin69,Reference Baklanov, Mogilnikov and Le71 become attacked by wet cleans,Reference Louveau, Bourlot, Marfoure, Kalinovski, Su, Hills and Louis23,Reference Puyrenier, Rouessac, Broussous, Rébiscoul and Ayral72,Reference Rébiscoul, Puyrenier, Broussous, Louis and Passemard73 and result in mechanical, leakage, capacitive, and/or reliability risks.Reference Noguchi74,Reference Bhanap, Ramos, Camarena, Naman, Ray, Smy, Ohta and Tsujimura75
While the implementation of either cryogenic etch,Reference Zhang, Ljazouli, Lefaucheux, Tillocher, Dussart, Mankelevich, de Marneffe, de Gendt and Baklanov35 post porosity plasma protection,Reference Lionti, Volksen, Magbitang, Darnon and Dubois7,Reference Frot, Volksen, Purushothaman, Bruce and Dubois33,Reference Frot, Volksen, Purushothaman, Bruce, Magbitang, Miller, Deline and Dubois34 and/or the pore sealing processReference Kayaba, Tanaka, Suzuki, Kohmura and Ono36–Reference Puyrenier, Rouessac, Broussous, Rébiscoul and Ayral39 can help, there may be other processing steps in the integrated flow where the infiltration of plasma or liquid chemical into porous ILD is unavoidable. It is therefore desired to have the porous backbone be as chemically robust as possible to both plasmas and wet chemical solutions of acids, bases, and/or peroxide solutions. There are generally two approaches toward designing robustness against these types of chemicals. The first method is to prevent the reactive species from getting inside the porous film in the first place; the second method is to make the backbone material inherently stable to the aggressive chemical. For plasma processing steps, minimization of diffusion can be accomplished through either densification of the surface during etch, and/or controlling the tortuosity of the interconnected pore structure. In the first case, densification usually results in a degradation of the dielectric constant and the layer may be subsequently dissolved during cleans.Reference Puyrenier, Rouessac, Broussous, Rébiscoul and Ayral72,Reference Broussous, Puyrenier, Rebiscoul, Rouessac and Ayral76 For the second case, the depth of damage layer induced by the plasma is a complicated trade-off between diffusion, recombination and reaction.Reference Kunnen, Barkema, Maes, Shamiryan, Urbanowicz, Struyf and Baklanov21,Reference Jochen and James77 Not only is tortuosity difficult to control for various porosities,Reference Matyka, Khalili and Koza78 but it will likely also reduce the mechanical strength of the film due to the formation of moments during mechanical loading (vida infra). Designing the backbone to be more inherently stable toward the specific plasma species is therefore important. Modeling has shown that the oxygen plasma stability of Si–R–Si groups, such as those implemented into TITAN precursor, is higher than for Si–CH3 groups.Reference Sugahara, Usami and Matsumura79
Prevention of chemical diffusion of aqueous wet chemicals is more straightforward: hydrophobic termination of the pore walls will prevent aqueous solutions from wicking into the pores due to surface tension reasons.Reference Baklanov, Mogilnikov, Polovinkin and Dultsev68,Reference Rébiscoul, Puyrenier, Broussous, Louis and Passemard73 Hydrophobic pore surface character and plasma stability is achieved by introducing thermally stable carbon-containing groups into the final network by using precursor with similar functionalities, e.g., 3MS, DEMS, TMCTS, DMDMOS, BTE, and others.Reference Volksen, Miller and Dubois4,Reference Dubois, Volksen, Magbitang, Sherwood, Miller, Gage and Dauskardt60,Reference Bonilla, Shaw, Liniger, Cohen, Gates, Grill, Shobha, Penny and Ryan70,Reference Ryan, Gates, Grill, Molis, Flaitz, Arnold, Sankarapandian, Cohen, Ostrovski and Dimitrakopoulos80–Reference Usami, Sugahara, Kobayashi, Sumimura, Hattori and Matsumura83 The carbon-containing groups can either exist at a terminal position [e.g., Si–CH3, Fig. 5(a1)] or internal network position [e.g., Si–R–Si of Fig. 5(b1), where R = CH2, C2H4, C6H4, or etc.]. There are times when the amount of carbon in the film is not sufficient to repel aqueous chemicals; this can either happen because of insufficient carbon as deposited, carbon loss from processing damage has occurred, or because surfactants in the chemicals are used.Reference Bonilla, Shaw, Liniger, Cohen, Gates, Grill, Shobha, Penny and Ryan70,Reference Ryan, Gates, Grill, Molis, Flaitz, Arnold, Sankarapandian, Cohen, Ostrovski and Dimitrakopoulos80,Reference Goethals, Ciofi, Madia, Vanstreels, Baklanov, Detavernier, Van Der Voort and Van Driessche84 In these cases, proper chemical design of the backbone can improve wet etch rates despite a hydrophilic inner pore surface structure. For example, when the cleans chemicals come close to the film network, a nucleophile (e.g., a dissolved species of −OH, F−, HF2−, etc.) might attack a silicon atom near a pore surface [Figs. 5(a1) or 5(b1)] to form a pentavalent transition state (a2 or b2).Reference Brinker and Scherer85 Since the Si–O− species is a weaker base than any of the nucleophiles listed above, a subsurface Si–O–Si bond can be favorably broken (a3). Upon attack of the same silicon atom by two more nucleophiles, the species can be removed (etched) from the surface (a4). Since the conjugate bases of most alkyl groups are stronger than the nucleophiles listed above, breaking a Si–R–Si backbond to form Si–R− will not be favorable.
Chemical structures showing the attack of a nucleophile (Nu−) on the silicon atom of an ILD network (a1 and b1) to form an intermediate species involving a pentavalent coordination state of the Si (a2 and b2). In both cases, the pentavalent species could evolve to release the nucleophile again (a1 and b1). If the Si atom has Si–O–Si backbonds, the pentavalent species could also evolve to break a Si–O–Si backbond to form a terminal Si–O− site (a3); if this happens two more times, then the surficial silicon atom can be removed (etched) from the surface (a4). Since alkyl bases are stronger than most nucleophiles considered here, the Si atoms with Si–R–Si backbonds (here R = CH2) would not be broken, the structure shown in (b3) would not form, and (b2) would return eventually back to (b1).
Periodic mesoporous organosilicate (PMO) materials containing Si–CH2–Si groups have demonstrated enhanced stability to aqueous alkaline base solutions.Reference Goethals, Ciofi, Madia, Vanstreels, Baklanov, Detavernier, Van Der Voort and Van Driessche84 Similarly, the Si–R–Si type of carbon existing within 50% porous TITAN provides enhanced stability over the Si–CH3 termination on the Si–O–Si framework of the 30% porous PECVD ILD 2 film. Both forms of carbon are acceptable in terms of ensuring stability against aqueous HF for the unprocessed films (Fig. 6 solid lines with filled symbols). Both films were then subjected to a CHxFy plasma dry etch for the same length of time and both lost 40 nm of film thickness. While Fourier transform infrared (FTIR) analysis showed less fractional loss in the Si–R–Si mode of the TITAN film relative to that lost by the Si–CH3 mode of ILD 2 (data not shown), both films exhibited surface and pore surface wall damage as exemplified by low water contact angles and water vapor uptake values from EP equal to the film porosity.Reference Baklanov, Mogilnikov and Le71 It was therefore assumed that an aqueous HF solution would rapidly permeate the entire porous networks of both films. Figure 6 shows the significantly higher HF stability (post-etch) imparted by the remaining internal Si–R–Si network of TITAN relative to the Si–O–Si network of ILD 2 (Fig. 6, dashed lines with open symbols).
ILD film thickness change versus time in aqueous 0.5% HF for pristine 50% porous TITAN (solid light olive green), 30% porous PECVD ILD 2 (solid dark green), and those same films after 40 nm etch in a CFxHy plasma (dashed lines and open symbols of similar color). Non-patterned film thickness values were measured by variable angle spectroscopic ellipsometry.
IV. LIMITS ON POROSITY
As researchers strive to continually reduce k-value, materials with increasingly higher porosity are targeted. But are there practical limits to material porosity? TITAN films, like many other in the industry,Reference Jousseaume, Favennec, Zenasni and Gourhant86 cannot be made with arbitrarily high porosity. Figure 7 shows the porosity of TITAN films as a function of the amount of porogen added to the spin-casting solution. At low porogen weight fractions, the resulting film porosity follows an expected linear trend. Above 60 wt% of porogen, the film no longer continues to increase in porosity and reaches a maximum porosity around 62% volume; note that at 75 wt% porogen the porosity becomes relatively unstable. Similar trends have been presented in the literature,Reference Jousseaume, Favennec, Zenasni and Gourhant86,Reference Yim, Baklanov, Gidley, Peng, Jeong and Sun Pu87 but few reports actually show the instability and/or film collapse (porosity decrease) upon thermal cure of very high porogen loadings. Our experience suggests a limiting maximum porosity near 50% volume for PECVD films using conventional tooling, but this has not been rigorously explored.
Film porosity versus percent mass loading of porogen for the TITAN film. Note that the film porosity becomes more unstable and does not go higher than 62% despite the addition of more porogen mass fraction.
Understanding the fundamental limitations on porosity is important. One model to explain the limiting maximum porosity is percolation theory,Reference Sahimi14,Reference Zallen88 which is described graphically in two dimensions in Fig. 8. A fully cross-linked square grid network containing 0.25 site occupancy of randomly placed porogen molecules (which is the same as 25% porosity or a backbone site occupancy of 0.75) is shown in Fig. 8(a1); a key requirement of percolation threshold (PT) is random placement. Upon removal of the porogen by simulated “burn out,” the backbone molecules have not changed in placement due to the assumed rigidity of the backbone bond angles [Fig. 8(a2)]. Figure 8(a3) represents some structural rearrangement that could occur during curing steps, and both networks in Figs. 8(a2) and 8(a3) pass the PT since there is a continuous path of bonds from one edge of the film to the other. The PT for a 2D 4-coordinate square lattice corresponds to a backbone site occupancy of 0.59; below this an interconnected infinitely large network of backbone molecules would not exist. The 75% porogen content (backbone site occupancy of 0.25) of Fig. 8(b) clearly is below PT. Even if all backbone molecules of Fig. 8(b2) could be incorporated into a network, e.g., by allowing them to fall downward and bond with the nearest possible backbone site, the resulting network [Fig. 8(b3)] would contain only 40% porosity. While this represents an extreme case, it suggests how film collapse can lead to lower than expected porosity values.
Graphical representation of networks of backbone and porogen species at 25% porogen loading (a1, a2, a3) and 75% porogen load (b1, b2, b3) after film crosslinking (a1, b1), porogen removal (a2, b2), and film restructuring (a3, b3).
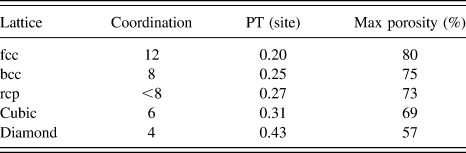
While the structures of Fig. 8 represent 2D lattices, Table I gives site PT values and the corresponding maximum porosity values for three dimensional lattices having different coordination numbers.Reference Zallen88 For example, a 3D network composed of 4-coordinate tetrahedrally bonded units arranged in a diamond lattice could support a maximum porosity of 57%. If the backbone molecular units could bond to more neighbors (i.e., have a higher coordination), then a higher maximum porosity would be possible.
Table of maximum expected porosity versus site coordination number for a three dimensional randomly porous network. Adapted from Zallen.Reference Zallen88
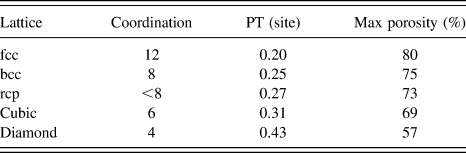
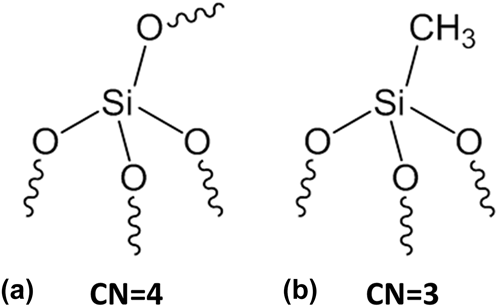
While this model is powerful, there are a number of real world complications that limit its direct applicability. First, few dielectric materials can be well represented by molecular units perfectly organized onto a periodic grid.Reference Zallen88 While a direct comparison of ordered and random networks is not trivial, the jammed random-close packed (rcp, CN ∼ 8) network results in only a slightly lower maximum porosity value relative to the body centered cubic (bcc, CN = 8) network. It is assumed, however, that as the density of the random network is reduced below the jammed matter limit the average coordination number will decrease, the site PT will increase, and the maximum porosity of that network will correspondingly decrease. Many silica-based dielectric films are composed of randomly interconnected corner sharing tetrahedral of silica (SiO4) units.Reference Brinker and Scherer85,Reference Zallen88 Figure 9(a) shows one of these tetrahedra, and for amorphous dense glass each oxygen atom is the corner bridge to another tetrahedron through a Si–O–Si bond. PECVD and spin-on glasses made from these tetrahedral silica units are expected to have a 4 coordinate random lattice,Reference Brinker and Scherer85,Reference Zallen88 which by comparison with rcp/bcc trend may only have a slightly reduced maximum porosity relative to the diamond lattice.
A description of some typical connectivity units within a general CDO ILD: (a) a four-coordinate tetrahedral SiO4 unit and (b) a three-coordinate tetrahedral O3SiCH3 unit.
The second complication is that neighboring backbone species may not always be connected via covalent bonds because condensation reactions for silica sols are known to require process control.Reference Volksen, Magbitang, Miller, Purushothaman, Cohen, Nakagawa, Nobe, Kokubo and Dubois45,Reference Brinker and Scherer85,Reference Ciaramella, Jousseaume, Maitrejean, Verdier, Remiat, Zenasni and Passemard89 The networks of Fig. 8 graphically depict 100% probability of connection between sites with black lines. In sol–gel films, there may be neighboring Si sites that exist in the chemical form of the non-bonded [≡Si–OH + HO–Si≡] structure rather than directly bonded [≡Si–O–Si≡] structure (the symbol “≡” represents the three other bonds that silicon atom makes to the surrounding network). This adds a bond percolation component to what is being described as a site percolation network, and it is assumed that a reduced bond probability between neighboring backbone sites will increase the required backbone site occupancy for PT and decrease the maximum porosity of the network. For PECVD films, increases in deposition temperatureReference Gourhant, Gerbaud, Zenasni, Favennec, Gonon and Jousseaume90 or higher subsequent annealing temperaturesReference Trujillo, Wu and Gleason91 seemingly improved the connectivity of the Si–O–Si bond network prior to porogen removal, which led to less shrinkage, lower k-value, and higher porosities. Similar optimization of the Si–O–Si network crosslinking prior to porogen removal has also been shown to be important for spin-on materials.Reference Volksen, Magbitang, Miller, Purushothaman, Cohen, Nakagawa, Nobe, Kokubo and Dubois45 Bond percolation of networks containing silica tetrahedra will be similarly reduced for films containing Si–CH3 groups. Cured films comprising a mix of SiO4 and O3Si–CH3 tetrahedra are expected to have a coordination number between 3 and 4 and an overall maximum porosity below 57%.
The third complication is that the porogen placement in the network during deposition may not be considered truly random even if not deliberately controlled. Due to the high reactivity of free-radical species generated during PECVD deposition, such networks are expected to be better characterized as randomly mixed networks relative to spin-on films, which could have tethered backbone-porogen species and/or involve phase separation. Finally, aerogels and xerogels are not discussed in this context as they have complex structure forming and solvent removal requirements that are not applicable to percolation theory or to current industry standard ILD processing.Reference Brinker and Scherer85,Reference Soleimani Dorcheh and Abbasi92 Baklanov et al.Reference Baklanov, Kondoh, Lin, Gidley, Lee, Mogilnikov and Sun93 present films with unusually high porosity values (up to 80%), but as little structural information is given some of those films could be aerogels.
In contrast to terminal Si–CH3 groups, internal Si–R–Si linkages can provide similar or better chemical stability without reducing the bond coordination number of the attached Si atom (and therefore without compromising the mechanical strengthReference Tajima, Ohno, Hamada, Yoneda, Kondo, Kobayashi, Shinriki, Inaishi, Miyazawa, Sakota, Hasaka and Inoue94). As described in Sec. III, the TITAN film employs a significant number of Si–R–Si bonds, but that alone cannot explain why the maximum porosity of TITAN (62%) is greater than PT expected for 4-coordinate units. Instead, it is the high number of reactive groups per backbone molecule and its molecular structure that raises the maximum coordination number of a TITAN molecular unit to 6. Since we expect the TITAN film to be better described by a random lattice (rather that a cubic lattice), and since we expect the average backbone coordination to be somewhat less than the maximum possible of 6, the experimentally observed maximum porosity of 62% is reasonable given the maximum porosity of 69% for cubic lattices.
V. MECHANICAL STABILITY OF DIELECTRIC MATERIALS
Mechanical strength is a concern for highly porous materials. While the mechanical strength during several integration steps can be increased by temporarily making films non-porous via the P4 process (discussed above), porous films will ultimately need to be strong enough to survive CMPReference Fayolle, Passemard, Louveau, Fusalba and Cluzel30 and packaging stresses.Reference Fu, Su, Kuechenmeister and Huang40 Mechanical strength has typically been ascribed to the amount of internal network crosslinking within a film.Reference Jousseaume, Favennec, Zenasni and Gourhant86 The high number of reactive groups on a TITAN backbone molecule not only enables a high porosity, as shown above, but could also result in high mechanical strength. On top of this, the addition of certain carbon containing speciesReference Tajima, Ohno, Hamada, Yoneda, Kondo, Kobayashi, Shinriki, Inaishi, Miyazawa, Sakota, Hasaka and Inoue94 such as bridged oxycarbosilanesReference Dubois, Magbitang, Volksen, Simonyi and Miller95 into the backbone network have been shown to exhibit a mechanical benefit relative to more oxide-like SSQ films at matched k-value. Figure 10 shows the Young's modulus values extracted for TITAN films as measured from continuous stiffness nano-indentation method using a Berkovich tipReference Li, Lin, Tsui and Vlassak96–Reference Vanstreels, Wu and Baklanov99 relative to some other PECVD CDO films. The strength of TITAN is clearly apparent at lower porosities (P < 43% volume, k > 2.2) relative to the other CDO ILD films. Here, the mechanical strength is more determined by the backbone bond density rather than the pore structure. As mechanical strength tends to be limited by the weakest springs in a network, each component of the TITAN backbone molecular structure was designed for strength: rigid molecular structures were connected by inflexible linkers that are as short as possible. At higher porosities (k < 2.2), the strength of TITAN is reduced, but even the 50% porous (k = 1.95) version of TITAN still exhibits a 10% improvement in stiffness relative to the PECVD ILD 3 film, the latter of which required a significant effort in the optimization of mechanical strength. While the modulus at k = 1.95 is greater than or equal to manyReference Urbanowicz, Vanstreels, Verdonck, Shamiryan, De Gendt and Baklanov47,Reference Owada, Ohara, Watatani, Kouno, Kudo, Ochimizu, Sakoda, Asami, Ohkura, Fukuyama, Tsukune, Nakaishi, Nakamura, Nara and Kase59,Reference Min, Moon, Kim and Rhee61,Reference Trujillo, Wu and Gleason91,Reference Li, Lin, Tsui and Vlassak96,Reference Vanstreels, Wu, Gonzalez, Schneider, Gidley, Verdonck and Baklanov98,Reference Takada, Hata, Seino, Fujii and Kikkawa100,Reference Urbanowicz, Vanstreels, Verdonck, Van Besien, Christos, Shamiryan, De Gendt and Baklanov101 but not allReference Volksen, Magbitang, Miller, Purushothaman, Cohen, Nakagawa, Nobe, Kokubo and Dubois45,Reference Landskron, Hatton, Perovic and Ozin102 reports in the literature, modulus values for lower k versions of TITAN rapidly decrease below conventionally acceptable levels.Reference Fayolle, Passemard, Louveau, Fusalba and Cluzel30,Reference Fu, Su, Kuechenmeister and Huang40 At these high porosities, the mechanical properties become more and more dependent upon the pore structure,Reference Li, Lin, Tsui and Vlassak96–Reference Vanstreels, Wu and Baklanov99,Reference Fan, Hartshorn, Buchheit, Tallant, Assink, Simpson, Kissel, Lacks, Torquato and Brinker103 and this will be discussed in more detail in the Sec. VI.
Modulus from nano-indentation versus dielectric constant, k, for TITAN and various PECVD ILD films.
Similar to other films in the literature,Reference Li, Lin, Tsui and Vlassak96,Reference Vanstreels, Wu, Verdonck and Baklanov97,Reference Vanstreels, Wu and Baklanov99 the TITAN film exhibited a linear decrease in cohesive energy, as probed by dual cantilever beam measurements, versus porosity with a slightly relaxed slope of −0.87 instead of −1 (data not shown). At matched porosity to ILD 2 (30%), the TITAN film exhibits a 28% increase in cohesive energy density. Historically, the adhesion of spin-on films to adjacent materials has been a challenge.Reference Mosig, Jacobs, Brennan, Rasco, Wolf and Augur41 While we have not measured the adhesion energies of TITAN to relevant materials in a scientific way, the integration of 50% porous TITAN into metalized damascene structures of 160 nm pitch has not resulted in delamination through final CMP.
While TITAN shows a number of improvements over typical PECVD CDO ILD films, further capacitance scaling would require films with higher maximum porosities and higher mechanical strengths at such porosities. In the Sec. VI we will show how deliberately ordered structures can not only break beyond the porosity limitations imposed by PT on randomly ordered porous networks, but can also deliver mechanical improvements.
VI. BENEFITS OF ORDERED POROSITY
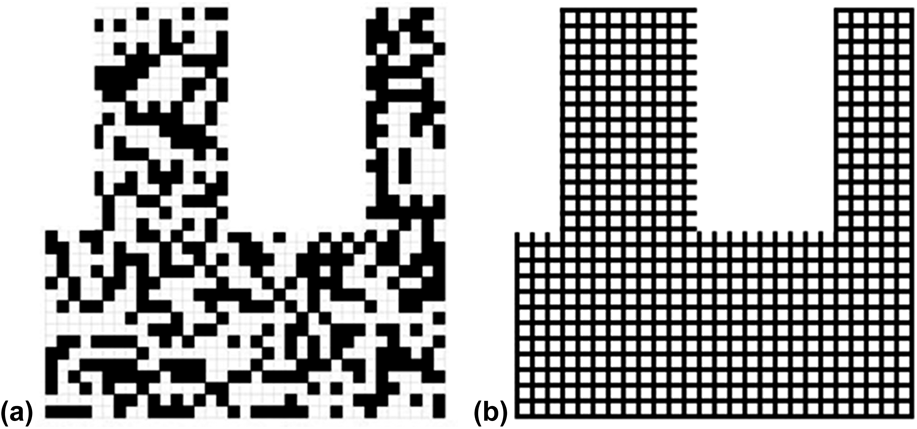
The maximum porosity values defined by percolation theory only apply for periodic networks where sites (or bonds) are removed at random. Figure 11 shows two graphical representations of a 75%-by-volume porogen-containing square grid network. The network on the left was created using a random number generator. The network on the right has the backbone units (green dots) organized into a pattern that is fully interconnected even after the porogen units (white dots) are removed.
Graphical depiction of a material composed of 75% porogen content with random porosity (a) and an ordered structure (b).
An organized pore structure can therefore exceed the limits of PT. Examples of ordered films exhibiting porosity values near or greater than the 4-coordinate limit of 57% are PMOs,Reference Goethals, Ciofi, Madia, Vanstreels, Baklanov, Detavernier, Van Der Voort and Van Driessche84,Reference de Theije, Balkenende, Verheijen, Baklanov, Mogilnikov and Furukawa104,Reference Wang, Grozea, Kohli, Perovic and Ozin105 jammed packed hollow spheres,Reference Wills, Michalak, Ercius, Rosenberg, Perciano, Ushizima, Runser and Helms106 and metal-organic frameworks (MOFs).Reference Bétard and Fischer107–Reference Thomas110
To further investigate the mechanical and porosity benefits that ordered structures can provide, we couple modeling and experimental results on films with ordered pore structures.
A. Finite element modeling technique
Several reports in the literature have simulated overall mechanical properties of porous ceramic materials through various homogenization approaches. Some of these models account for the topology of the pores through size parameters and can match experimental results over a wide range of porosity values reasonably well provided the parameters are calibrated properly. Often times different values of parameters work at different porosity ranges.Reference Roberts and Garboczi111,Reference Boccaccini and Fan112 At high porosities, the interaction of connected pores and backbone load paths strongly influence the overall properties which necessitates an accurate computational modeling approach. In this work, a representative volume element (RVE) approach is adopted which conveniently lends itself to finite element (FE) modeling technique. A RVE is usually defined as the smallest block of a non-homogeneous material that captures the overall behavior of the heterogeneities and represents the mean macroscopic response.Reference Gitman, Askes and Sluys113,Reference Ostoja-Starzewski114 Few other works have applied RVE-based FE modeling to porous films.Reference Chen, Wang, Giuliani and Atkinson115 Here, different RVEs were generated by sampling experimental pore-size distributions and performing tensile tests to determine their overall moduli. Hexahedral elements of uniform size were used such that for a given total thickness, the element size corresponded to the size of a single TITAN or porogen molecule. Hence, removal of a single voxel element from the RVE for pore creation was structurally similar to removal of a porogen molecule. Typically 10 RVEs with 100 nm sides were generated and their moduli were averaged to estimate the modulus value at each porosity data point. Figure 12 shows examples of two generated RVEs with different pore shapes but with the same porosity and pore size distribution.
RVEs with ellipsoidal (a) and spherical (b) pore geometries at ∼53% porosity with pore sizes sampled from the experimental pore size distribution for TITAN (Fig. 14) at that porosity.
Figure 13 shows the experimental Young's modulus data for TITAN and other PECVD films (from Fig. 10) versus the porosity value of these films (from Fig. 4) along with the results from various FE modeling experiments. The FEM-generated modulus values for a given porosity were calculated relative to the non-porous case and were normalized to the experimental value of non-porous TITAN for comparison. Porous FE networks were generated by randomly placed pores of spherical [Fig. 13, red cross symbols; 3D image of 53% porosity shown in Fig. 12(b)] or ellipsoidal [Fig. 13, black cross symbols; 3D image of 53% porosity shown in Fig. 12(a)] pore shapes sampled from the experimental pore size distribution (Fig. 14) for TITAN at that porosity. (Note that, like many films in the industry,Reference Grill, Patel, Rodbell, Huang, Baklanov, Mogilnikov, Toney and Kim9,Reference Jousseaume, Favennec, Zenasni and Gourhant86,Reference Marsik, Urbanowicz, Verdonck, De Roest, Sprey and Baklanov116 the pore size of TITAN increases with porosity; this will be discussed further in Sec. VII.) Similar to other reports in the literature,Reference Vanstreels, Wu, Verdonck and Baklanov97,Reference Vanstreels, Wu and Baklanov99 the experimental TITAN film data (Fig. 13, light green triangles) are best fit by the randomly placed ellipsoidal pores.
Data and FE modeling of porous materials comparing films containing not-deliberately controlled pore structure to those with ordered structures.
Peak height normalized p size distributions obtained from EP adsorption isotherms for the TITAN film as a function of porosity.
Experimental evidence for the existence of ellipsoidal pore shapes is given in Fig. 15 for the 45% porous TITAN film, which was infiltrated with a high atomic element (high Z) material deposited by ALD for TEM contrast. Some pores are circled in yellow broken lines to highlight the ellipsoidal structure. A sampling of multiple pores visible in the TEM sample resulted in a pore radius distribution with average equal to 3.4 nm and a standard deviation of 1.6 nm; this is similar to the pore size distribution given by EP, Fig 15(b).
TEM (a) and peak height normalized pore size distribution (b) obtained from EP of a 45% porous TITAN film infiltrated with proprietary ALD material of high atomic number used for imaging contrast. The pores appear to be ellipsoidal in shape, randomly placed, and oriented randomly relative to the long axis of the ellipsoid (c).
FE models generated from randomly placed spherical pores of radius defined by the same pore size distribution (Fig. 13, red cross symbols) resulted in significantly higher modulus values. The reason for this relative increase in modulus can be understood by the FEM-generated stress contours resulting from a 1% strain in the vertical direction shown in Fig. 16 for 53% porous films. The film with ellipsoidal pores [Fig. 16(a)] results in stress contours that are more serpentine in nature and therefore have higher moments and correspondingly lower mechanical properties. In addition, there are large volumes of the backbone network (blue regions) that are not contributing to the load path. The 1% strain is therefore applied to only a small fraction of the film, which results in a lower average stress and therefore a lower overall modulus. In contrast, the network of randomly placed spherical pores with the same pore-size distribution [Fig. 16(b)] contains load path that are more straight and more uniformly distributed over the cross-section (i.e., fewer blue regions). A further improvement in mechanical strength comes from uniformly sized spherical pores place in an ordered array (Fig. 16(c), Fig. 13, green crosses) because the load is very evenly divided across the backbone network (very little blue regions) with load paths that are the most straight.
FE Model of stress contours for cross-sectional slices of 53% porous materials that have different spheroidal pore structures: (a) randomly placed ellipsoidal pores showing the most convoluted 3D backbone network structure with areas of high stress (red regions); (b) randomly placed spheroidal pores following the same pore radius distribution but having fewer moments in the backbone loading path; (c) controlled placement of uniform 6 nm radius spheroidal pores in a cubic array.
PMOs films are characterized by cylindrical pores of uniform radius that typically pack in a hexagonal close packed (hcp) pattern as described by the schematic at the top of Fig. 17. For this structure, the strongest axis is along the length of the cylindrical pores (Fig. 17, L; Fig. 13, blue dashes) because nominally all backbone material participates equally in the load transfer (uniform stress); the porosity scaling relationship with modulus is therefore linear. In the transverse directions, there is a stronger axis (Fig. 17, T1; Fig. 13, purple dashes) and a weaker axis (Fig. 17, T2; Fig. 13, pink dashes). As shown by the stress contour maps of Fig. 17, the T1 axis is stronger because the loading paths have more rectilinear character, while the T2 axis has loading paths with more moments.
Stress contours using the same color scale of Fig. 16 along different directions of strain for a structure composed of hexagonally packed horizontally aligned cylindrical pores with elliptical cross sections as described in the text: (L) strain applied out of the page such that all backbone material equally divides the load; (T1) strain applied left and right such that fewer material absorbs axial load; (T2) strain is applied up and down such that all load paths involve significant moments.
B. Experimental PMO
PMO films allow for the generation of ordered mesoporous networks via self-assembly of the pore-forming surfactant and the backbone organosilica precursors.Reference Seino, Wang, Lofgreen, Puzzo, Manabe and Ozin48,Reference Hatton, Landskron, Whitnall, Perovic and Ozin49 Both the chemical flexibility of the backbone precursor and the ability to tune the pore size and porosity of the resulting ordered pore network make these materials of interest for low-k ILDs. The PMO of this work used backbone molecules that were similar in chemical composition and structure to the TITAN film and therefore exhibited no thickness change, similar to the TITAN film, in 0.5% aqueous HF for up to 10 min. Figure 18 shows EP isotherms for the TITAN and PMO films at 54% and 53% porosity values, respectively. Due to the surfactant and backbone self-assembly process of the PMO films, a much narrower pore size distribution (Fig. 18, inset) centered at a pore radius of 1.3 nm is observed relative to the wider pore size distribution centered at a radius of 2.5 nm for this TITAN film.
Adsorption isotherm for both TITAN (green triangles) and PMO (red circles) showing 55 ± 1% porosity in the film for both cases. Inset: a much narrower pore size distribution is obtained for PMO relative to TITAN. The soft-bake, hard-bake, and curing of the TITAN film in this experiment was different from the films shown in Figs. 13–15.
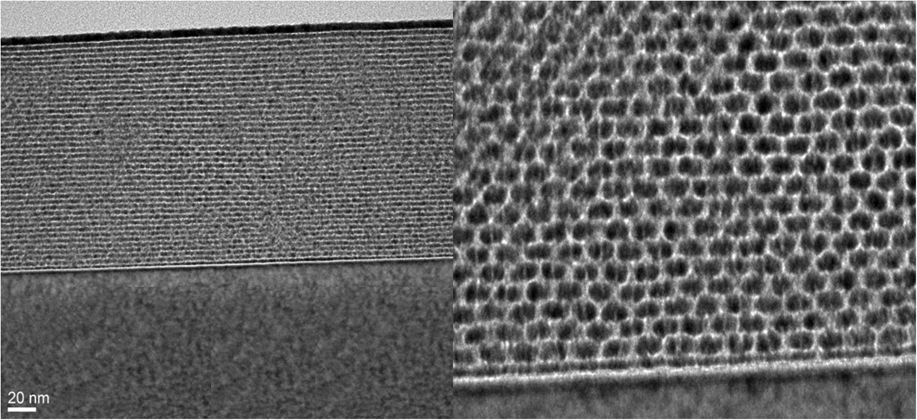
PMO materials were filled with the same high-Z ALD material for TEM image contrast, and Fig. 19 shows the highly ordered cylindrical pore structure: While the pores are clearly organized in a hcp pattern, the cross-sectional shape is better characterized by an ellipse with long axis parallel to the wafer plane. As this shape deformation has a mechanical impact due to an increase in the moment during vertical stress loading, the FE modeling of Fig. 17 and Fig. 20 used the experimental pore structure as inputs, which matches the experimental results for PMO films quite well.
TEMs of PMO film showing ellipsoidal cylinders aligned parallel to the substrate.
Modulus versus porosity for TITAN, PMO T1, and PMO T2.
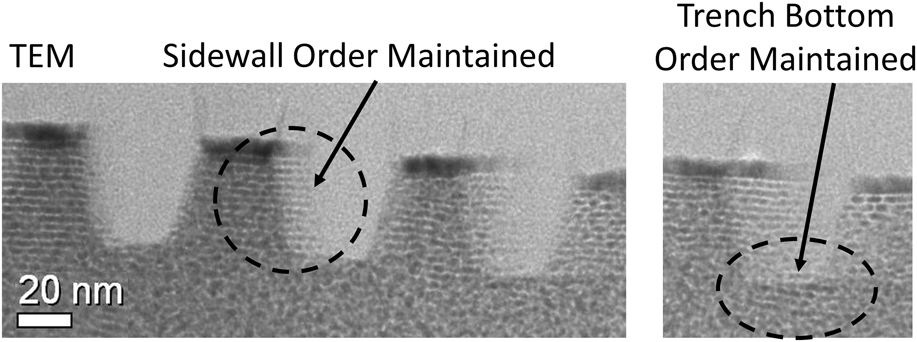
Figure 21 shows that the ordered structure of a PMO can be maintained through trench patterning when using proper integration. Similar to other work,Reference Guan, Wang, Henderson, Dag, Kübel, Chakravadhanula, Rinck, Moudrakovski, Thomson, McDowell, Powell, Zhang and Ozin117 this particular film was thicker and less well-ordered away from the air and substrate interfaces than the film in Fig. 19, but clear examples of ordered regions can be seen along the trench sidewalls and trench bottoms.
TEM showing the ability of the PMO material to maintain their order when properly integrated through a trench etch.

While the orientation of the pore direction for PMO materials deposited on flat surfaces currently cannot be controlled (domains of different direction are seen), deposition of these materials into features appears to have a guiding property. Figure 22 shows the self-arrangement of the PMO material along the axis of a trench within the trench when inside it and random orientation when above it. PMO materials could then work nicely in a sacrificial flow where the pore structure may be ordered by the topography of the patterned structure.
TEM showing the ability of the PMO material to align within the guiding trench structure of the patterned substrate.
C. Metal-organic frameworks (MOFs)
MOFsReference Bétard and Fischer107,Reference Wang, Liu, Grosjean, Wagner, Guo, Gu, Heinke, Gliemann, Bräse and Wöll108 and metal-free covalent organic frameworksReference Thomas110 are highly porous ordered structures and are starting to be considered as ILD materials in the back end.Reference Eslava, Zhang, Esconjauregui, Yang, Vanstreels, Baklanov and Saiz109 We have chosen to make thin films of the ZIF-8 MOF to understand the benefits and challenges of applying this relatively new class of materials to dielectric applications. This particular MOF is made up of zinc atoms connected by organic imidazole molecules into an ordered 3D network. Synthesis of 50–500 nm thick films followed literature procedures.Reference Lu, Farha, Zhang, Huo and Hupp118 Films made in this manner are crystalline, with lateral domain sizes greater than 100 nm and surface RMS roughness values obtained by AFM and SEM of around 9 nm [Fig. 23(a)]. VASE techniques did not produce good fits to Cauchy models as expected on the basis of the surface roughness. X-ray diffraction (XRD) spectra of the as-deposited films show a crystalline structure with results similar to that reported for other ZIF-8 thin films.Reference Eslava, Zhang, Esconjauregui, Yang, Vanstreels, Baklanov and Saiz109 ZIF-8 films are claimed to have thermal stabilityReference Tan, Bennett and Cheetham119 up to 450–500 °C but while the XRD spectrum of a ZIF-8 film after a 400 °C 30 min bake in N2(g) only showed a slight decrease in peak intensities, SEM analysis [Fig. 23(b)] shows significant film cracking and thermal desorption spectroscopy indicates a loss of imidazole ligands among other species. While the bulk film may be thermally stable, surfaces and/or interfaces exhibit thermal instability.
Side and top-down SEMs for (a) a MOF film as-deposited after (b) a 30 min 400 °C thermal cure in nitrogen, or after (c) running a typical toluene EP experiment, or after (d) a 10 min immersion in 23 °C neat toluene. These images show the propensity of the film to crack or recrystallize.
Molecular modeling predicts that ZIF-8 films have high (60% volume) porosityReference Tan, Bennett and Cheetham119 with really low pore sizes (0.3 and 1 nm).Reference Demessence, Boissiere, Grosso, Horcajada, Serre, Ferey, Soler-Illia and Sanchez120,Reference Park, Ni, Côté, Choi, Huang, Uribe-Romo, Chae, O’Keeffe and Yaghi121 This presents a unique and desirable pore structure for ILD applications. MOF films were therefore measured using EP to probe the pore size and porosity values, which should show no absorption due to pore sizes smaller than the test molecules. Unlike other reports,Reference Eslava, Zhang, Esconjauregui, Yang, Vanstreels, Baklanov and Saiz109 however, the toluene and isopropyl alcohol isotherms show irreversible behavior. The top-down and cross-sectional SEM images of Fig. 23(c) show significant film cracking after EP measurements. A ZIF-8 film immersed in toluene for 10 min showed film loss and recrystallization [Fig. 23(d)], consistent with the instability observed for these films during toluene EP measurements. While we are not sure if the particular method we used for the synthesis of ZIF-8 films resulted in the observed lower film thermal and chemical stability, future work on these materials should continue to monitor these concerns. As most of the film instability appears to be driven by grain boundaries, recent work demonstrating templated single-crystal growthReference Wang, Liu, Grosjean, Wagner, Guo, Gu, Heinke, Gliemann, Bräse and Wöll108,Reference Hermes, Schröder, Chelmowski, Wöll and Fischer122,Reference Gliemann and Wöll123 could result in significantly improved film properties.
As the ZIF-8 film is composed of zinc metal atoms bonded with aromatic hydrocarbon linkers, the dielectric constant and the electrical conductivity are concerns. ZIF-8 films of 100 nm thickness were deposited on highly conductive Si substrates (dopant density > 1019 cm−3). Dielectric constant values of 2.35 ± 0.2 were extracted from flat capacitance–voltage curves measured in air on a conventional mercury probe with a calibrated area using a 100 kHz sin wave of amplitude ±0.1 V and a DC bias range of ±1 V; the relatively large error in k-value stemmed from the thickness roughness observed on SEM but is within error of other reports for this film.Reference Eslava, Zhang, Esconjauregui, Yang, Vanstreels, Baklanov and Saiz109 Electrical conductance (also called leakage) measurements between the range of ±100 V were performed on the MOF films using the Hg probe (Fig. 24, red curves) or using a dedicated vacuum-capable probe for MOF samples with evaporated circular Al dots in air (Fig. 24, black curves) or under vacuum (Fig. 24, blue curves). For negative biases, the results measured on the Hg probe are relatively similar to the results measured in air using Al dots, but there is a larger variation between the two techniques for positive directions. The results from MOF samples with Al dots are similar to published results for metal-insulator-metal (MIM) capacitors.Reference Eslava, Zhang, Esconjauregui, Yang, Vanstreels, Baklanov and Saiz109 Because the ZIF-8 films are known for gasReference Demessence, Boissiere, Grosso, Horcajada, Serre, Ferey, Soler-Illia and Sanchez120,Reference Heinke, Tu, Wannapaiboon, Fischer and Wöll124 and solvent absorptionReference Tan, Bennett and Cheetham119 and because adsorbed gases can pose an electrical leakage risk, the electrical leakage was measured in vacuum to segment the inherent backbone leakage from possible gaseous inclusions. Samples were annealed for 12 h at 127 °C under vacuum (at 10−6 Torr) followed by 8 h of cool down to 27 °C and measured under vacuum (Fig. 24, blue curves). The dramatic reduction in leakage current (>1000× reduction at 2 MV/cm) for vacuum versus air measurements suggest that the backbone is not inherently leaky and that physisorbed gas species can play a major role in the leakage of these films under ambient conditions. At the moment we do not know which gaseous components of air or residual solvents could be contributing to the leakage current, but leakage measurements under controlled gaseous environments could segment the contributors. We notice that the leakage currents and breakdown fields exhibit quite a lot of variation; this could be due to incomplete annealing to remove all trapped gases/solvents from the film and/or variation due to breakdown along various grain boundaries. The single crystal growth methods for MOF filmsReference Wang, Liu, Grosjean, Wagner, Guo, Gu, Heinke, Gliemann, Bräse and Wöll108,Reference Hermes, Schröder, Chelmowski, Wöll and Fischer122,Reference Gliemann and Wöll123 measured under more controlled outgassing and vacuum conditions could show continued improvement in segmenting the leakage contributors. Future experiments and final integration of such materials, if possible, will clearly need to be done under conditions where electrically leaky gaseous components are avoided.
Electrical leakage data on the ZIF-8 MOF film: (red and black lines) measurements performed in air, (blue lines) measurements performed in vacuum. The absorption of physisorbed water and/or other airborne species contribute a large amount to electrical leakage under air conditions, but the leakage of the metal-containing backbone is reasonable under vacuum for electric field values less than |2| MV/cm.
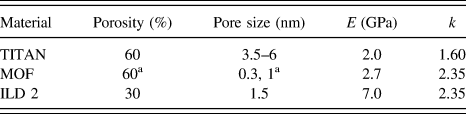
Table II compares some of the properties of the ZIF-8 MOF film relative to TITAN and one of the amorphous SiCOH films discussed above. The porosity and pore size distribution of the MOF could not be independently measured so the predicted values are cited.Reference Zhou, Bailey, Sooryakumar, King, Xu, Mays, Ege and Bielefeld16,Reference Demessence, Boissiere, Grosso, Horcajada, Serre, Ferey, Soler-Illia and Sanchez120,Reference Park, Ni, Côté, Choi, Huang, Uribe-Romo, Chae, O’Keeffe and Yaghi121 The elastic modulus of 2.7 ± 0.2 was measured in the same way as for the TITAN and ILD 2 films and is within error of other reports.Reference Eslava, Zhang, Esconjauregui, Yang, Vanstreels, Baklanov and Saiz109,Reference Tan, Bennett and Cheetham119 When comparing the ZIF-8 film to an amorphous film of matched porosity (e.g., 60% porous TITAN), the MOF film exhibits much small pore sizes, a higher mechanical strength due to the structural order and rigidity of molecules, but a substantially higher k-value (likely due to the higher polarizabilities of the metal and aromatic ligands).
Data for various ILD materials: the ZIF-8 MOF, the randomly porous TITAN, and the PECVD ILD 2 material.
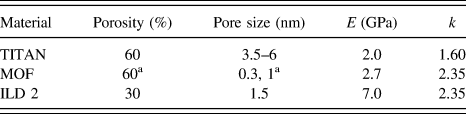
a Porosity and pore sizes come from calculated valuesReference Zhou, Bailey, Sooryakumar, King, Xu, Mays, Ege and Bielefeld16,Reference Demessence, Boissiere, Grosso, Horcajada, Serre, Ferey, Soler-Illia and Sanchez120,Reference Park, Ni, Côté, Choi, Huang, Uribe-Romo, Chae, O’Keeffe and Yaghi121 and were not able to be experimentally verified.
When compared to a porous amorphous SiCOH film of similar k-value (e.g., k = 2.35; ILD 2), the ZIF-8 film has slightly smaller pore sizes, a considerably higher porosity, and therefore a much lower mechanical strength.
While the ZIF-8 film clearly demonstrates that structural order at a given porosity can deliver higher mechanical strength and smaller pore sizes, our results highlight some instability in the crystalline grain boundaries and that electrical measurements for gas adsorbing media need to be measured in controlled environments. It will be exciting to see how single-crystal MOF films of various compositions can address these challenges.
VII. PORE SIZE, POROSITY, AND BACKBONE WIDTH
Even while the PMO and ZIF-8 films clearly show how ordered films can deliver highly porous and uniquely strong networks with small pore sizes, there is a desire to make pore sizes increasingly smaller. A figure of merit is to have the pore size much smaller than the patterned trench size to limit line-edge roughness and other processing risks. As the critical dimensions of backend trench patterning is rapidly approaching the sizes near 10 nm, pore sizes of less than 1 nm are targeted. Figure 25 shows graphical representations of two networks of 56% porosity containing perfectly cut 12 nm wide trenches. Figure 25(a) shows random placement of 56% volume of pores on a molecularly-sized 1 nm square grid; this image therefore places the trench pitch, molecular size, and corresponding pore size on the same scale. One can visually see that the average pore size is larger than the porogen unit size because as the amount of porogen is increased, a given porogen molecule is more likely to have other porogen molecules as next nearest neighbors and therefore the pore size of the total interconnected porogen phase increases. To limit the pore size of the material to the porogen unit size, porogen-porogen contact needs to be prevented by surrounding at least part of each porogen unit with backbone material. Figure 25(b) shows a hypothetically ordered structure comprising 1 nm square pores separated by a 0.3 nm wide backbone grid with an overall porosity of 56%. This structure represents pore sizes 3× smaller than the PMO material, and the width of the backbone unit is clearly on the atomic size scale (similar to the MOF materials).
Schematic models for a 12 nm half pitch integrated structure with super imposed representative porosity: (a) a randomly ordered 56% porous material containing an average unit size of 1 nm for both pore and backbone; (b) an ordered square lattice at 56% porosity with a closed 1 nm pore size and a 0.3 nm backbone wall width.
The two structures of Fig. 25 hint at a trade-off between porosity, backbone width, and pore size, which can be calculated more explicitly using geometry for films exhibiting ordered structures of various types. The inset in Fig. 26 shows the hcp pore structure for PMOs and the 6 subunits making up one pore together with the dimensional variables used for calculation, where R is the pore radius and B is the backbone width. The porosity, P, is the ratio of the pore area (A pore = πR 2) to the hexagonal unit cell area [A hexagon = 2 × (3)0.5 × T2 = 2 × (3)0.5 × (R + B/2)2]. Notice that the porosity can be described only in terms of R and B. There are therefore only 2 independent variables between backbone width, porosity, and pore size. Figure 26 plots the pore radius versus porosity for a set of hypothetical cylindrical hcp PMO structures with defined backbone widths, B. Data for PMO materials are overlaid on the graph. The three PMO A films were synthesized using one type of molecular surfactant with three different organic chain lengths, and they clearly lie on one trend line that is fit by a backbone width of 1.0 nm. While the alkyl chain length of the surfactant determined the pore size, the similar head group resulted in the same number of organosilicate molecules around the micelle. In this case, we see the increase in radius giving an increase in porosity for the same backbone width. The PMO B film was generated using a molecular surfactant with a different head group relative to PMO A; this head group apparently facilitates the growth of a slightly thicker organosilicate shell, and therefore a thicker backbone width.
Pore radius, R, to diameter, 2R, versus porosity and backbone width, B, for a porous material composed of a hexagonal packing of horizontally aligned cylindrical pores.
The experimental PMO data and geometrical models clearly demonstrate the challenge of scaling PMO materials to higher porosities: a 70% porous film with the same 1 nm backbone width would result in a 7 nm pore diameter. Alternatively, a 60% porous structure with pore diameter of 1 nm would require a potentially impractical 0.2 nm backbone width.
The hcp cylindrical pore geometry of Fig. 26 is not necessarily the best structure from either a mechanical (Figs. 13 and 20) or an optimal pore size perspective. A cube frame structure, if achievable to synthesize, would provide straight load paths upon mechanical stress and would better optimize for a larger backbone wall thickness for a given porosity and pore size. Figure 27 shows a representative unit cell for the cube fame structure along with the calculated geometrical constraints for porosity, backbone width, and pore size for a cube frame structure. Notice that a 60% porous cube frame structure with a 1 nm pore size would result in backbone width of roughly 0.7 nm; this is 3.5× thicker and hence more feasible than the hcp cylindrical pore structure. A 70% porous cube frame with 1 nm thick backbone walls would result in a pore size of less than 2 nm.
Pore size versus porosity and backbone width, B, for a porous material composed of an idealized cube frame geometry.
While we have not considered all possible geometric structures, the comparison between these two cases highlights some important considerations regarding the feasibility of scaling both porosity and pore size. Nevertheless, the schemes presented here provide a step toward developing new material design rules needed to enable simultaneous material porosity and pattern density scaling of backend interconnects.
VIII. CONCLUSIONS
ILD materials for extreme capacitance scaling will need to be carefully crafted. We demonstrate the importance of precursor design through the results of the in-house synthesized TITAN film, which was designed for mechanical strength, high porosity, and chemical stability. Carbon atoms added into the backbone of the molecule as Si–R–Si groups are typically more chemically stable than pendant methyl groups and do not reduce the coordination number of the backbone molecular unit. Backbone oligomers synthesized to have a high number of reactive crosslinking groups result in films with high mechanical strength at a given porosity. PT sets a limit on the maximum porosity achievable with randomly ordered porous networks; this maximum porosity can be increased by tuning the network coordination number of the backbone units. Ordered networks of controlled porosity can provide higher maximum porosity values and can deliver higher mechanical strength at a given porosity for certain pore geometries. There are geometrical limitations on the molecular backbone width when trying to scale ordered networks to high porosity and low pore size. While the integration of highly porous low-k materials like TITAN will require novel new schemes, initial patterning and e-test data of this film looks encouragingReference Bielefeld125 and is the focus of further work. While chip manufacturers are ultimately responsible for the successful integration of new materials, a larger pipeline of highly porous and ordered materials will facilitate success. Our hope is that this work spurs more materials development in both academia and industry.
IX. SUPPORTING INFORMATION
A. Additional data
A table containing raw numbers for several films presented in this work is included below.
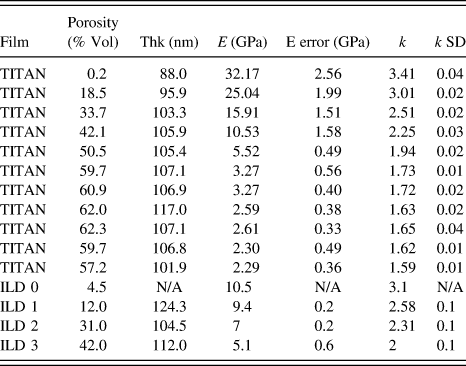
B. Experimental details
Unless otherwise specified, dielectric thin films were directly deposited on p-Si(100) wafers of 5–25 Ω cm resistivity via spin coating. The film thickness values were measured using VASE over a wave length range of 600–1000 nm using 10 nm steps at incidence angles of 60 and 75° off normal. Films were fit to a Cauchy model to extract thickness, A, and B values, where the RI at a given wave length, λ, in units of micrometers is given by RI(λ) = A + B/(λ2). All films of this work had B < 0.01 over this wave length range. Film thicknesses were corroborated by properly performed SEM analysis using a small beam current, low acceleration voltage, and small integration times to minimize film shrinkage.
Pore volumes (porosity values) of the thin films were measured using a commercially available ellipsometric porosimeter using solvents of either toluene, 2-propanol, or water by measuring the thickness and RI values of the films under vacuum and at pressure intervals up to the saturation vapor pressure of the solvent using a pressure step size of 1–2% of the saturation vapor pressure for each solvent. This level of pressure sampling resulted in good resolution of the pore size distributions. The porosity values obtained for toluene or 2-propanol were within 1% volume of each other.
Young's modulus values (assuming a Poisson's ratio of 0.17 for all films) were measured by nano-indentation using the continuous stiffness method using a Berkovich tip as described in the literature.Reference Li, Lin, Tsui and Vlassak96–Reference Vanstreels, Wu and Baklanov99 For the most accurate comparison, all films were within a narrow thickness range and measured on one of two toolsets where films with a wide range of modulus values yielded nominally matched results.
The dielectric constant, k, values of the TITAN films were measured on a Hg probe with a calibrated area of 0.022 ± 0.01 cm2 at a measurement frequency of 100 kHz under accumulation voltage conditions. The average and standard deviation over 3 repeat measurements at each of 3–5 different regions on a wafer were calculated. ILD films coated on 200 or 300 mm Si(100) wafers were mounted on an electrically grounded chuck with a vacuum system to ensure good electrical contact. Film thicknesses were sufficiently thick to minimize errors from series resistances. To minimize the series resistances for smaller 2 × 2 in. coupons, accurate k-value measurement required low resistivity (0.005–0.01 Ω cm) silicon substrates and a custom thin metal plate to focus the chuck vacuum for good electrical contact. Electrical leakage values measured with the Hg probe were conducted by monitoring the current flow under application of 0 to −100 V with a step size of 1 V, a current auto-ranging function activated, and a compliance current of 0.5 mA. Electrical leakage measurements performed under air are very sensitive to amount of physisorbed moisture; small changes in the amount of water uptake (as measured by EP with water solvent) showed relative large changes in both the leakage at a given electrical field and the voltage value for electrical breakdown. Accurate comparison of the electrical properties of highly porous dielectric thin films is therefore very challenging in this respect and the corresponding electrical leakage currents measured in air are not a reliable predictor for the leakage currents observed in hermetically capped integrated patterned structures. Comparison of electrical leakage in air and vacuum required a probe station equipped with turbo and roughing pumps to obtain a base pressure in the 10−7 to 10−8 Torr range. 500 nm thick aluminum dots of 5 different radius values ranging from 0.2 to 1 mm were deposited on the ILD films deposited on low resistivity Si wafers using a shadow mask evaporation technique. Electrical leakage values were trusted when current density values scaled with dot area and not dot circumference or other function. The grounding probe was contacted directly with the Si substrate and confirmed to have less than 2 kΩ contact resistance. Contact of the other probe to the Al dot requires care—typical over-travel of the 25 μm tungsten probes during lowering was about 50 μm; larger over-travel values would more substantially scratch the Al dot and raise concerns about underlying ILD damage. After electrical breakdown of one dot, probes needed to be properly discharged/grounded prior to landing on a new dot. Due to the highly doped Si substrate, leakage currents could be measured for both negative and positive applied voltage under otherwise similar measurement conditions as described for the Hg probe. Electrical leakage currents measured in air for the Al dot structures were very similar to the air measurements made on the Hg probe. Samples measured under vacuum were first annealed for 12 h at 127 °C under vacuum (at 10−6 Torr) followed by 8 h of cool down to 27 °C. Once cooled to 27 °C, good contact to the Si substrate was ensured prior to dot measurement. Porous films with pore sizes of several nanometers in size (e.g., TITAN) result in Al infiltration during metal dot deposition using evaporation and electric field enhancements and early dielectric breakdown due to the resulting rough interface between metal and ILD surface. These challenges prevent a fair comparison of the electrical leakage between ZIF-8 (really small pore size) and TITAN (larger pore size). When properly integrated, however, the electrical leakage measurements of TITAN on patterned structures provide the most reliable (and most encouraging) data.
ACKNOWLEDGMENTS
Kris Vanstreels and IMEC for nano indentation measurements. Han Li at Intel for nano-indentation and aDCB measurements. Mark Lemay and Eungnak Han for PMO patterning support. Brian Krist and Gaiying Yang for TEM support. Rami Hourani, Shane Harlson, Marie Krysak, Steve Putna, and Kent Frasure for chemical synthesis, deposition, and characterization work. Jeff Callipare, Jack Mitchell, Brian Barley, and Bob Hankel for film deposition, capacitance, and EP measurements. Mike Bowen for ALD support. Satyarth Suri for etch development work. Marc French for XRD support. Mike Terzich for SEM support. Jeff Bielefeld, Canay Ege, Sean King, Ebony Mays, David Collins, and Veronica Strong for helpful discussions and other support.