INTRODUCTION
A key question in the design of payments for ecosystem services (PESs) is whether or not to include distributive goals (Pagiola et al. Reference Pagiola, Arcenas and Platais2005; TEEB 2010). Some argue that equity as well as efficiency concerns should be taken into account when designing PES schemes (Corbera & Pascual Reference Corbera and Pascual2012; Pascual et al. Reference Pascual, Phelps, Garmendia, Brown, Corbera and Martin2014). They point out that schemes can only be implemented successfully with the support of local communities, and this will only be obtained if a PES scheme is not in conflict with their perceptions of fairness (Narloch et al. Reference Narloch, Pascual and Drucker2012). Moreover, a PES scheme that is designed to alleviate poverty is likely to receive more political support, making its implementation easier (Turpie et al. Reference Turpie, Marais and Blignaut2008).
Others argue that including distributive goals may lead to a PES scheme being less efficient than if it were focused solely on environmental preservation (TEEB 2010; Kinzig et al. Reference Kinzig, Perrings, Chapin, Polasky, Smith, Tilman and Turner2011). In their opinion, the goals of poverty alleviation and environmental preservation should be targeted by separate policies. For given resources, this will lead to improved outcomes in terms of both environmental preservation and poverty alleviation than if both goals are pursued with the single policy instrument of PESs.
Markova-Nenova and Wätzold (Reference Markova-Nenova and Wätzold2014) argued that an approach using separate policies implies a functioning government, but that in many developing countries the ability to design and implement policies successfully is limited (Engel & Palmer Reference Engel and Palmer2008; Rice & Patrick Reference Rice and Patrick2008). Hence, it is unrealistic to assume that governments in these countries will be able to implement a policy to achieve distributional goals in addition to the implementation of a PES scheme. According to Markova-Nenova and Wätzold (Reference Markova-Nenova and Wätzold2014), there are only two realistic alternatives in the case of a non-functioning government: either to implement a PES scheme that ignores distributive goals and focuses on efficiency; or to implement a PES scheme that includes distributive goals.
In such a situation, the preferences of those who pay for the ecosystem services a PES is supposed to generate (i.e. the ‘buyers’ of the ecosystem services) are important. Possible groups of buyers include citizens in developing and developed countries who finance PES schemes through donations to non-governmental organizations (TEEB 2010) or through taxes. Taxes may be used to finance government schemes directly (Pagiola Reference Pagiola2008; Thu Thuy et al. Reference Thu Thuy, Minh Ha and Campbell2008) or indirectly through payments of national governments to international organizations such as the Global Environment Facility, which, in turn, finances PES schemes (Méral et al. Reference Méral, Froger, Andriamahefazafy, Rabearisoa, Aubertin and Rodary2008). Buyers also include firms, which finance PES schemes either because they profit from the ecosystem services generated by the scheme (Andriamahefazafy Reference Andriamahefazafy2011) or because they use PESs as a part of offsetting programmes (Olsen et al. Reference Olsen, Bishop and Anstee2011; van Teeffelen et al. Reference Van Teeffelen, Opdam, Wätzold, Hartig, Johst and Drechsler2014).
Markova-Nenova and Wätzold (Reference Markova-Nenova and Wätzold2014) investigated by means of a case study whether citizens in a developed country as a single group of buyers have a preference for including distributive goals in PES design. Using the conservation of the endangered spiny forest in southwest Madagascar as an example, they conducted a choice experiment (CE) to assess the willingness of the citizens of the city of Cottbus (Germany) to donate money in order to support types of PES schemes that differed in terms of the level of forest conservation achieved and their distributive consequences. The citizens had a substantial willingness to donate money in support of the forest, preferred a PES scheme in which the poorest households in a community received the largest share of payments over a scheme in which every household received the same share and had preferences for being informed about the distributive impacts of the payments made to the local population. To our knowledge, Markova-Nenova and Wätzold (Reference Markova-Nenova and Wätzold2014) is the only study to investigate the preferences of a group of buyers of ecosystem services for including distributive goals in PES design, which raises the question of the preferences of other buyers.
The purposes of this study are: (1) to estimate the preferences of citizens in a developing country as a group of buyers for including distributive goals in the design of PES schemes; and (2) to compare their preferences with the preferences of citizens in a developed country in order to appraise the similarities (or differences) of observed preferences. To facilitate the comparison, we selected the same case study as Markova-Nenova and Wätzold (Reference Markova-Nenova and Wätzold2014), the conservation of the spiny forest in the Mahafaly Plateau in southwest Madagascar, but selected as respondents citizens of Antananarivo, the capital of Madagascar.
The Mahafaly Plateau is known for its unique and endemic biodiversity, with the spiny forest being of key importance (Harper et al. Reference Harper, Steininger, Tucker, Juhn and Hawkins2007). Some of Madagascar's endemic and endangered species are found in this forest; for example, the radiated tortoise (Astrochelys radiata) (Ganzhorn et al. Reference Ganzhorn, Manjoazy, Paeplow, Randrianavelona, Razafimanahaka and Ronto2015) and Grandidier's mongoose (Galidictis grandidieri) (Schreiber et al. Reference Schreiber, Wirth, Riffel and Van Rompaey1989). The local population, however, is among the poorest in Madagascar and relies mainly on subsistence farming, which includes crop production as well as livestock keeping (SuLaMa 2011; Neudert et al. Reference Neudert, Götter, Andriamparany and Rakotoarisoa2015) (Table S1) (available online). A common way to obtain new land for subsistence farming is through the practice of teteke, a traditional slash-and-burn farming method. As the population has grown over recent decades, teteke has increased substantially, posing a serious threat to the region's forest cover, which has decreased by 48% from 1990 to 2000 (Harper et al. Reference Harper, Steininger, Tucker, Juhn and Hawkins2007; SuLaMa 2011).
One way of preserving the remaining forest would be to set up a conservation fund in order to compensate farmers for refraining from teteke. The financial resources for the fund could come from international donor organizations, donations from citizens in developed countries, Malagasy government funds and donations from Malagasy citizens who have a positive willingness to pay (WTP) in order to preserve the spiny forest (as a funding example, see the PES watershed scheme of Antarambiby, which is co-financed by Malagasy and international organizations) (Andriamahefazafy Reference Andriamahefazafy2011). The government of Madagascar is essentially weak and has practically no influence in the rural areas of the southwest (Freudenberger Reference Freudenberger2010; Bertelsmann Stiftung 2012). This implies that a setting in which the government implements a PES scheme and a separate policy for poverty alleviation is unrealistic. We therefore asked the respondents in our CE not only about their WTP in order to support a conservation fund for spiny forest preservation, but also about their preferences for including distributive goals in the design of payments in order to prevent teteke.
METHODS
CEs as a valuation method
The CE valuation method is based on Lancaster's new consumer theory, which states that the preferences for a good depend not on the good itself, but on the characteristics that it possesses, as well as random utility theory (Hanley & Mourato Reference Hanley and Mourato2001). Random utility theory's framework decomposes the indirect utility of an individual into two components: a deterministic or observable element, which is assumed to be a linear function of the characteristics of the different alternatives, and a random element. The indirect utility of an individual n from choosing an alternative i, Uni , is given by:
 $$\begin{equation}
{U_{ni}} = {\rm{ }}{V_{ni}} + {\varepsilon _{ni}} = \beta \text{'} \times {X_{ni}} + {\varepsilon _{ni}}
\end{equation}$$
Vni is the observable component of the utility and Ɛni represents the error terms (unobservable influences on individual choices), which are assumed to be independently and identically distributed (iid) as extreme values. Xni is the vector of attributes specific of alternative i for an individual n, while β is the vector of utility weights.
The individual n is assumed to choose the alternative that gives them the maximum utility. Thus, the probability that alternative i will be chosen by the individual over the remaining alternatives j available to them is given by:
 $$\begin{equation}
\Pr ([ {{U_{ni}} > {U_{nj}}} ]\forall i \ne j) = \Pr ([{V_{ni}}-{V_{nj}}] > [{\varepsilon _{nj}}-{\varepsilon _{ni}}])
\end{equation}$$
The assumption that the error terms are iid allows eqn (2) to be expressed in terms of a logistic distribution (Hanley & Mourato Reference Hanley and Mourato2001):
 $$\begin{equation}
\Pr ([ {{U_{ni}} > {U_{nj}}} ]\forall i \ne j) = \exp (\mu {V_{ni}})\Big/{\sum _g}\exp (\mu {V_{ng}})
\end{equation}$$
where the term µ defines the scale parameter, which is inversely related to the variance of the error terms (Hanley & Mourato Reference Hanley and Mourato2001), and g defines the remaining available alternatives. In this specification of choice probability known as the conditional logit model (CLM), the scale parameter cannot be identified separately when working with a single data set and is therefore assumed to equal one. Consequently, the choice selection must conform to the independence of irrelevant alternatives (IIA) property, which specifies that the relative probability of any two alternatives being selected will not be affected by the introduction or removal of another alternative (Hanley & Mourato Reference Hanley and Mourato2001).
However, the validity of the IIA property is rarely met in practice, since it imposes strong restrictions on individual behaviour. Thus, the application of the CLM should be followed by a test of the violation of the IIA property (Hensher et al. Reference Hensher, Rose and Greene2005), such as the Hausman test (Hausman & McFadden Reference Hausman and McFadden1984). The Hausman test compares the parameter estimates of a constrained CLM in which one of the alternatives in the choice set is dropped with an unconstrained model. If the IIA assumption holds (null hypothesis), then the parameters of the two models (constrained CLM and unconstrained CLM) should not differ significantly. However, in some cases, a negative χ 2 value might be obtained from the Hausman test. Therefore, a generalized Hausman test should be performed in order to avoid those negative values (Wessie Reference Wessie1999).
In case of IIA violation, alternative models such as the random parameter logit (RPL) model should be used. The main advantage of the RPL model over the CLM is that instead of fixing the coefficient estimates of the observed variables in the utility specification, these coefficients are now allowed to vary randomly in the population. The variance in β (cf. eqn [1]) in this case will induce correlation in the utility over the alternatives. Indeed, for each individual, β is expressed now as the sum of the population mean b and the standard deviation σn , which represents the variation of individual preference relative to the average preference. Thus, eqn (1) becomes (Train Reference Train1998):
 $$\begin{equation}
{U_{ni}} = {\rm{ }}b^{\prime} \times {X_{ni}} + {\sigma _n}^{\prime} \times {X_{ni}} + {\varepsilon _{ni}}
\end{equation}$$
In this expression, because the unobserved component of the utility σn ′ × Xni + Ɛni is correlated over the different alternatives (due to σn ), the RPL model is no more restricted by the IIA property. Therefore, the probability that an individual n will choose alternative i is given by (Train Reference Train1998):
 $$\begin{equation}
{\Pr\nolimits_{ni}} = \int\!\! {L_{ni}}(\beta )f(\beta )d\beta
\end{equation}$$
where Lni (β) = exp(β′Xni )/∑ j exp(β′Xnj ), due to the property of the error terms being iid, and f(β) represents here the density function of taste variation in the population. Estimation procedures of the RPL model usually involve: (1) the choice of the random parameter (how many parameters are allowed to vary?); (2) the choice of mixing distributions for the random parameter; and (3) the interpretation of the random parameter estimates (Hoyos Reference Hoyos2010). In addition, the distribution attribute levels were effect-coded in order to highlight the trade-offs that the respondents might face during the choice process. We used the NLOGIT5 software package in order to estimate our models.
Case study design
The CE method is particularly suitable when environmental goods with different characteristics are being valued. The purpose of the valuation is to find out how individuals value the environmental goods when these characteristics differ. In our case, we were interested in the willingness of citizens from Antananarivo to donate money for the preservation of the spiny forests in the Mahafaly Plateau in the southwest of Madagascar depending on different levels of forest preservation and on the distributive impacts of the donations.
As we wanted to compare the preferences of citizens from a developing country to those of citizens from a developed country, we kept the CE survey design as similar as possible to the CE performed by Markova-Nenova and Wätzold (Reference Markova-Nenova and Wätzold2014) in the city of Cottbus (Germany). As in the CE in Cottbus, the hypothetical scenario relates to the launch of a project that could preserve the endangered spiny forests of the Mahafaly Plateau. The project aims to set up a conservation fund financed on the basis of individual donations, from which the local population could receive monetary compensation for abandoning slash-and-burn farming.
As attributes for our CE survey, we used the extent of conservation (expressed in terms of preserved forest area), the size of the donation and whether and how distributive impacts are considered in the way that the payments are distributed to the households within a community. For the latter attribute, we informed the respondents that the way in which monetary compensation was distributed to the households would depend on the respective prevailing traditions of the local communities, which differ in the Mahafaly region. We explained that we had identified two traditions: one in which the communities give the largest share of common goods to the poorest households (henceforth referred to as pro-poor distribution); and another in which the share is equal for every household (henceforth referred to as equal distribution). However, in some communities, the tradition was unknown and therefore it was not possible to predict the approach to the distribution of compensations.
We selected the same attribute levels as Markova-Nenova and Wätzold (Reference Markova-Nenova and Wätzold2014) for the first two attributes ‘preserved spiny forest area’ (25, 50 and 75 km2) and ‘way of distribution’ (equal, pro-poor and unknown distribution). We adapted the attribute levels for the third attribute ‘amount of donation’ (200, 500, 1000, 1500, 2000, 2500, 5000, 7500 and 10 000 ariary; 1 Euro = 2872 ariary) to the local currency and to the income and wealth of the potential donors, which are substantially lower in Antananarivo than in Cottbus.
A fractional factorial design gave 27 profiles for the CE. After blocking the design, we ended up with nine choice cards distributed into three blocks of questionnaire. Figure S1 presents an example of a choice card.
Data collection
During the preliminary phase, we conducted a pre-test survey with 20 respondents in order to account for difficulties regarding the comprehension of the questionnaire and the processing of the choice cards. After completing the pre-test and discussing the difficulties with the respondents, we decided to run the survey entirely in Malagasy while keeping the questionnaire in French.
To attract respondents, announcements were made at various locations (e.g. public administration buildings, churches and universities). Depending on the availability of respondents, some sessions were conducted individually, while most were organized in a group setting. For each group setting, we informed the respondents that the questionnaires were individual and prevented discussion between them as they completed the questionnaire.
At the beginning of each session, we started the CE with a series of warm-up questions in order to familiarize the respondents with the survey topic. We provided the respondents with information about the forest conservation problem, poverty in the Mahafaly Plateau and the option of setting up a conservation fund. This information was conveyed through a presentation and a short documentary on biodiversity in the Mahafaly region. In addition, we provided some instructions on how to complete the questionnaire, including the choice cards. Because of the hypothetical nature of the experiment, we conveyed ‘cheap-talk’ information during the presentation in order to avoid a hypothetical bias. We explicitly stated that it is very important to consider one's income when one makes a donation, and asked respondents to make their choice as if the situation were real. Cheap-talk scripts have helped to limit hypothetical bias in CE surveys (Carlsson et al. Reference Carlsson, Frykblom and Lagerkvist2005).
After the choice cards were completed, the survey concluded with a series of questions aimed at identifying respondents’ general opinions on conservation in Madagascar and various forms of compensation distribution. These questions also gathered socio-economic information about the respondents and determined whether they were members of environmental and/or charity organizations. Every respondent received 6000 ariary (c.2 Euros) for his/her participation.
The CE survey was conducted by one of the authors and his assistant from May to July 2013 in 23 sessions with 300 respondents. Of the 300 respondents surveyed, two were omitted due to inconsistencies and a protest response. The sample statistics of the population surveyed can be found in Table S2.
RESULTS
Conditional logit model
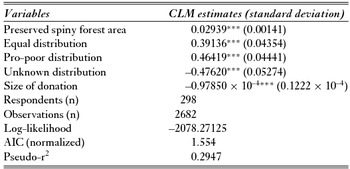
All coefficients from the CLM estimation were significant at the 1% level and were of the expected signs. As expected, respondents face trade-offs between the size of the donation, distributional goals and the performance of the conservation project. The coefficients of ‘preserved forest area’, ‘equal distribution’ and ‘pro-poor distribution’ were both positive and significant, meaning that respondents had preferences for both conservation goals and distributional goals. The significance and negative sign of the coefficient related to the ‘unknown distribution’ indicate that respondents disliked projects in which no information on compensation distribution was available. Table 1 shows the results of the CLM estimation.
Conditional logit model (CLM) parameter estimates. *** Significant at 1%; ** significant at 5%; * significant at 10%. AIC = Akaike Information Criterion.

Although the CLM estimation had model fit (pseudo-r 2 ≈ 0.3), we performed a Hausman test in order to assess the validity of the IIA assumption. The Hausman test did not reject the null hypothesis for the first alternative; however, the IIA restriction was rejected for the second alternative. For the third alternative, the test resulted in a negative χ 2 value, which might be interpreted as a sign of support for the null hypothesis (Hensher et al. Reference Hensher, Rose and Greene2005). However, performing a generalized Hausman test using the STATA software package indicated that the null hypothesis was not rejected for the first alternative. The tests for the second and third alternatives rejected the IIA restriction at the 1% level. The violation of the IIA restriction partly reflects the limitation of the CLM for identifying all sources of correlation between alternatives, such as the existence of different tastes among respondents (Train Reference Train2009).
RPL model
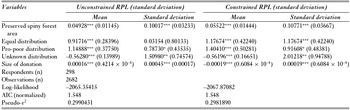
Given that our CLM estimations are limited because of the violation of the IIA restriction, a different model that would be able to overcome the IIA restriction had to be used, such as the RPL model (McFadden & Train Reference McFadden and Train2000). First, we estimated an unconstrained RPL model in order to identify the existence of preference heterogeneity in the population. As in Markova-Nenova and Wätzold (Reference Markova-Nenova and Wätzold2014), we specified a triangular distribution for the area and donation attributes, whereas we specified a normal distribution for the distribution attribute. The overall model fit of the unconstrained RPL model was slightly better than for the CLM (pseudo-χ 2 of 0.299 compared to 0.295 for the CLM). All coefficients had the expected signs and were significant. For an RPL estimation, the significance of the corresponding standard deviation of the random parameter estimates indicates the existence of preference heterogeneity within the population. This is observed for the coefficients of preserved spiny forest area (1% level of significance), pro-poor distribution (10% level of significance), unknown distribution (5% level of significance) and donation (1% level of significance). However, the standard deviation corresponding to the coefficient of equal distribution was not significant, which suggests the absence of preference heterogeneity for this particular attribute level.
In order to provide an accurate conclusion regarding the existence of preference heterogeneity around the mean parameter of the coefficient of equal distribution, we estimated a second RPL model in which the standard deviation parameter estimate of the coefficient of equal distribution was constrained to equal its mean. As suggested by Hensher et al. (Reference Hensher, Rose and Greene2005) and as done in Markova-Nenova and Wätzold (Reference Markova-Nenova and Wätzold2014), we imposed a similar constraint on the triangular distribution of the donation attribute in order to ensure behaviourally plausible WTP values (see below). We did not observe a significant improvement in the performance of the model. However, the significance of the spread of the random parameter related to equal distribution (which is at the 1% level) now suggests the existence of preference heterogeneity for this attribute. The remaining standard deviation of each parameter estimate is also significant at the 1% level for the coefficient of preserved spiny forest area, at the 10% level for the coefficient of pro-poor distribution, at the 5% level for the coefficient of unknown distribution and at the 1% level for the coefficient of donation. Table 2 shows the results of the two RPL estimations.
Random parameter logit (RPL) parameter estimates of preferences. *** Significant at 1%; ** significant at 5%; * significant at 10%. AIC = Akaike Information Criterion.

The interpretation of the coefficient estimates from the RPL model was identical to that of the CLM. In our case, respondents were sensitive to both conservation and distributional goals and all coefficients were significant. For the results regarding the sources of preference heterogeneity, please see Appendix S1 and Tables S3 and S4.
Willingness to pay
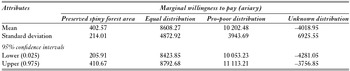
To obtain a better understanding of respondents’ preferences for the different methods of distribution and the extent of conservation, we calculated the implicit prices (marginal WTP) of the different attributes and attribute levels using the common choice-specific conditional parameter estimates of the previously constrained RPL.
We found that respondents were willing to pay 403 ariary for 1 km2 of preserved spiny forest area (Table 3). Concerning the respective values of the different levels of the distribution attribute, respondents were willing to pay more money for pro-poor distribution conservation programmes (10 202 ariary) compared to those featuring equal distribution (8608 ariary). However, respondents disliked conservation programmes with no information regarding the distribution of the monetary compensation; this is expressed by a negative WTP (–4019 ariary) for such a programme.
Implicit prices of each attribute using conditional constrained parameter estimates from random parameter logit (1 Euro = 2872 ariary).

The ‘part-worth’ of the changes in the WTPs, calculated as the difference between the WTPs of the different attribute levels, provides further information regarding respondents’ preferences for the different methods of distribution. In our case, respondents were willing to pay 12 627 ariary for a change in the distribution from ‘unknown distribution’ to ‘equal distribution’. A change from ‘unknown distribution’ to ‘pro-poor distribution’ was valued highly at 14 221 ariary, while a move from ‘equal distribution’ to ‘pro-poor distribution’ was only valued at 1594 ariary.
Preference comparison
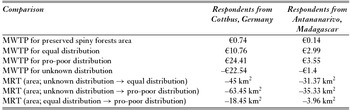
The respondents from Cottbus and Antananarivo had similar preference rankings concerning the distribution attributes (Table 4). Both groups valued a pro-poor distribution over an equal distribution, which, in turn, they valued more highly than alternatives with no information on distribution.
Comparison of marginal willingness to pay (MWTP) of respondents from Cottbus (Markova-Nenova & Wätzold Reference Markova-Nenova and Wätzold2014) and Antananarivo (amounts are in Euros; 1 Euro = 2872 ariary) and marginal rate of transformation (MRT) between conservation and distribution attribute levels.

To obtain a quantitative estimation regarding the differences between the preferences for individual attributes, we calculated the marginal rate of transformation between the conservation and distribution attribute levels (i.e. the amount of preserved forests respondents were willing to give up to receive a more preferred distribution). Respondents from Antananarivo were willing to give up less forest for a change to a higher-valued distribution than respondents in Cottbus (Table 4). In comparison to respondents in Cottbus, they were more concerned with the conservation situation than with distributional issues. While respondents from Cottbus were willing to give up a substantial area of preserved forest (18.45 km2) for a change from an equal distribution to a pro-poor distribution, respondents in Antananarivo were willing to give up only a rather small area for such a change (3.96 km2).
DISCUSSION
We contribute to the debate regarding whether distributional goals should be considered in PES design by investigating the preferences of citizens in a developing country city as potential buyers of forest ecosystem services when considering distributive goals in PES design. The CE with citizens of Antananarivo found that respondents had a positive WTP for forest conservation and preferred a pro-poor distribution to an equal distribution, which, in turn, they preferred to an unknown distribution.
This finding is identical to that of Markova-Nenova and Wätzold (Reference Markova-Nenova and Wätzold2014) for the city of Cottbus in Germany. In both cases, respondents had a strong preference for receiving information about how payments were to be distributed. There were also differences between the studies. Respondents in Cottbus valued a change from an equal distribution to a pro-poor distribution much more highly than respondents in Antananarivo. Respondents in Cottbus were also willing to give up a higher area of conserved forest for a change from an unknown to an equal distribution and for a change from an equal to a pro-poor distribution than respondents in Antananarivo. This means they had stronger preferences for considering distributive goals in PES design.
A possible explanation for these differences is that the income difference between the inhabitants of the Mahafaly Plateau and respondents in Antananarivo is much smaller than the difference to respondents in Cottbus (Table S1 provides a comparison of selected socio-economic characteristics in Antananarivo and the Mahafaly region). This implies that, from the perspective of respondents in Cottbus, poverty on the Mahafaly Plateau seems much more severe than from the perspective of respondents in Antananarivo. Another possible explanation is that respondents in Antananarivo and Cottbus have different norms and values regarding the distribution of income and wealth.
However, direct comparison of the results from the two studies is constrained because respondents with different cultural backgrounds may react differently to CEs, which is one of the weaknesses of stated preference methods such as CEs compared to revealed preference methods (Mangham et al. Reference Mangham, Hanson and McPake2009). A strength of CE, however, is its ability to capture non-use benefits such as existence and bequest values, which may be important reasons as to why respondents valued the endangered spiny forest (e.g. Birol et al. Reference Birol, Karousakis and Koundouri2006).
When looking more broadly at studies that investigate preferences regarding the relationship between poverty issues and ecosystem service provision, we find the results to be ambiguous. Zander and Garnett (Reference Zander and Garnett2011) reveal that Australians have a substantial WTP for ecosystem services provided by Aboriginal peoples, but no substantial WTP for social benefits for Aboriginal peoples on top of that. In contrast, Dietz and Atkinson (Reference Dietz and Atkinson2010) find that equity matters to UK citizens to a similar extent as efficiency regarding the design of air pollution control policies. We conclude that further research is needed in order to investigate the preferences of citizens in different countries regarding distributional goals in the design of PESs in particular, and policies to provide ecosystem services in general.
Our research allows us to draw some general conclusions regarding the inclusion of distributional goals in PES design when governments are weak and citizens are buyers of ecosystem services. First, it is advisable to provide information to citizens about the distribution of the payments they finance. Citizens value this information and it affects their WTP for conservation efforts. Second, citizens support the inclusion of distributional goals in PES design. However, this does not automatically imply that PES design should include distributional goals as perceived by the buyers of ecosystem services.
Ecosystem services suppliers’ acceptance of specific design features needs to be considered, too. For example, local communities’ perceptions of fairness might differ from those of ecosystem service buyers, which is a potential source of conflict (Narloch et al. Reference Narloch, Pascual and Drucker2012; Pascual et al. Reference Pascual, Phelps, Garmendia, Brown, Corbera and Martin2014). It might also be questionable whether a pro-poor scheme can be implemented due to already established political relationships, which may lead to local elite capture and the exclusion of the local poor from decision-making (Vatn Reference Vatn2010; McDermott et al. Reference McDermott, Mahanty and Schreckenberg2013). The payments might also go to a specific clan or family, resulting in social instability and envy within a community (Zander et al. Reference Zander, Dunnett, Brown, Campion and Garnett2013). The decision about whether payments are made at the individual or community level may also affect their distributional impacts and could have other repercussions, such as motivation crowding, which are important to consider (Zander et al. Reference Zander, Dunnett, Brown, Campion and Garnett2013; Kerr et al. Reference Kerr, Vardhan and Jindal2014). Finally, the payment mode is important. While some ecosystem service suppliers prefer cash payments or salaries, others prefer non-monetary benefits, such as schooling (Zander et al. Reference Zander, Dunnett, Brown, Campion and Garnett2013).
In summary, whether distributional goals should be considered in PES design depends on multiple factors and is case specific. However, our research provides an additional argument in favour of including poverty alleviation concerns – alongside ecosystem service conservation – in PES design where governments are weak.
ACKNOWLEDGEMENTS
The paper greatly benefitted from comments by Johanna Götter and Nonka Markova-Nenova.
FINANCIAL SUPPORT
The study was funded by the German Federal Ministry of Education and Research (BMBF) as part of a project on sustainable land management of the Mahafaly Plateau (SuLaMa; grant number 01LL0914G).
Supplementary material
To view supplementary material for this article, please visit https://doi.org/10.1017/S0376892916000540.