
1. Introduction
According to the classical theory, turbulence is ergodic when fully developed. That is, a turbulent flow visits all viable states in the phase space, leading to a unique statistical state irrelevant to the initial condition (Frisch Reference Frisch1995; Tsinober Reference Tsinober2001; Galanti & Tsinober Reference Galanti and Tsinober2004). This ergodic assumption has profound influence on our thinking as well as how we approach a turbulent flow. For example, turbulence scalings, e.g. the logarithmic mean flow scaling in wall-bounded turbulence (Marusic et al. Reference Marusic, Monty, Hultmark and Smits2013; Xu & Yang Reference Xu and Yang2018) and the  $-5/3$ scaling of the energy spectrum, are only valid if turbulence has one unique statistical state.
However, ergodicity of a fully developed turbulence has been challenged by multiple authors in the recent literature. They observed multiple states in von Kármán flow (Ravelet et al. Reference Ravelet, Marié, Chiffaudel and Daviaud2004; Ravelet, Chiffaudel & Daviaud Reference Ravelet, Chiffaudel and Daviaud2008), Rayleigh–Bénard convection (Xi & Xia Reference Xi and Xia2008; Ahlers, Funfschilling & Bodenschatz Reference Ahlers, Funfschilling and Bodenschatz2011; van der Poel, Stevens & Lohse Reference van der Poel, Stevens and Lohse2011; Weiss & Ahlers Reference Weiss and Ahlers2013; Xie, Ding & Xia Reference Xie, Ding and Xia2018; Wang et al. Reference Wang, Verzicco, Lohse and Shishkina2020), rotating Rayleigh–Bénard convection (Stevens et al. Reference Stevens, Zhong, Clercx, Ahlers and Lohse2009; Weiss et al. Reference Weiss, Stevens, Zhong, Clercx, Lohse and Ahlers2010; Wei, Weiss & Ahlers Reference Wei, Weiss and Ahlers2015; Wang et al. Reference Wang, Wan, Yan and Sun2018), Taylor–Couette flow (TCF) (Huisman et al. Reference Huisman, Van Der Veen, Sun and Lohse2014; van der Veen et al. Reference van der Veen, Huisman, Dung, Tang, Sun and Lohse2016; Gul, Elsinga & Westerweel Reference Gul, Elsinga and Westerweel2018), spherical Couette flow (Zimmerman, Triana & Lathrop Reference Zimmerman, Triana and Lathrop2011), spanwise rotating plane Couette flow (RPCF) (Xia et al. Reference Xia, Shi, Cai, Wan and Chen2018; Huang et al. Reference Huang, Xia, Wan, Shi and Chen2019a; Xia et al. Reference Xia, Shi, Wan, Sun, Cai and Chen2019), forced rotating turbulence (Yokoyama & Takaoka Reference Yokoyama and Takaoka2017) and double diffusive convection turbulence (Yang et al. Reference Yang, Chen, Verzicco and Lohse2020b). In some cases, the flow transits between different states (Xi & Xia Reference Xi and Xia2008; Xie et al. Reference Xie, Ding and Xia2018), while in other cases each of the different states is stable, exhibiting hysteresis behaviours when control parameters vary (Huisman et al. Reference Huisman, Van Der Veen, Sun and Lohse2014; Yokoyama & Takaoka Reference Yokoyama and Takaoka2017; Huang et al. Reference Huang, Xia, Wan, Shi and Chen2019a; Yang et al. Reference Yang, Chen, Verzicco and Lohse2020b). Here, we briefly review some of the observations. Huisman et al. (Reference Huisman, Van Der Veen, Sun and Lohse2014) showed that different phase-space trajectories lead to different torques and velocity distributions at the same flow condition in a TCF at Reynolds number  $Re\sim 10^6$. The result suggests two possible states in a laboratory context. The existence of multiple states in TCF was also reported by van der Veen et al. (Reference van der Veen, Huisman, Dung, Tang, Sun and Lohse2016). Those authors observed multiple states in two experimental set-ups with different aspect ratios and for Taylor numbers covering almost two decades. Their results suggest that multiple states in TCF are robust. Huang et al. (Reference Huang, Xia, Wan, Shi and Chen2019a) reported hysteresis behaviours in RPCF. Those authors conducted two groups of direct numerical simulations (DNSs) at
 $Re_w=1300$ (see the definition of
 $Re_w$ below) but with the rotation number
 $Ro$ varied in two opposite directions, mimicking the experiment in Huisman et al. (Reference Huisman, Van Der Veen, Sun and Lohse2014).The authors found that the flow prefers a state with two pairs of roll cells when
 $Ro$ increases from 0.02 to 0.5 and it prefers the state with three pairs of roll cells when
 $Ro$ decreases from 0.5 to 0.02. In addition, they showed that the flow structures and statistics lead to hysteresis loops.
These observations have inspired many interesting discussions; nonetheless, the research is, by and large, phenomenological. Conclusions were drawn from data with very little or no idea as to whether they could be applied to a different flow. Huisman et al. (Reference Huisman, Van Der Veen, Sun and Lohse2014) conjectured that the selectability of large-scale coherent structures plays an important role in the multiple states phenomenology and called for more in-depth research. van der Veen et al. (Reference van der Veen, Huisman, Dung, Tang, Sun and Lohse2016) noted that a theoretical understanding of the rotation rate at which the system starts to transit between different states remains elusive. Xia et al. (Reference Xia, Shi, Wan, Sun, Cai and Chen2019) showed that the large-scale roll cells play an important role in RPCF multiple states, but they did not answer the question about the origin of the multiple states. Many other questions remain open, and we name a few here. First, it is not clear whether multiple states exist at all rotation speeds. Second, it is not known if there could be more than two statistically stable states at a given flow condition. Other unexplained observations include the selection of one state over another by differently sized computational domains and the selection of the states by initial conditions (Xia et al. Reference Xia, Shi, Wan, Sun, Cai and Chen2019). All in all, a theoretical analysis is required to help ininterpreting the experimental and computational observations. The objective of this work is to fill this gap as much as we can.
Before proceeding to our derivation, we briefly review previous theoretical works. From a fundamental standpoint, many of the ideas in the following sections are similar to those expressed in the field of statistical state dynamics (Farrell & Ioannou Reference Farrell and Ioannou2007, Reference Farrell and Ioannou2019) and related fields of research (Farrell, Gayme & Ioannou Reference Farrell, Gayme and Ioannou2017; Taira et al. Reference Taira, Brunton, Dawson, Rowley, Colonius, McKeon, Schmidt, Gordeyev, Theofilis and Ukeiley2017). In particular, statistical state dynamics recognizes that the dynamics of a turbulent statistical state is time dependent, in which case the statistics obtained from many realizations would not in general correspond to a representation of the statistical state at any time. While this implies ‘multiple’ states, statistical state dynamics typically follows Kolmogorov's theory and assumes ergodicity, i.e. the statistical average of a turbulent system asymptotically approaches a fixed point. From an operational standpoint, we apply truncated Galerkin projection of the Navier–Stokes (NS) equation to a predefined subspace. Truncated Galerkin projection sees most use in dynamical systems (Majda & Timofeyev Reference Majda and Timofeyev2000; Rapún & Vega Reference Rapún and Vega2010). A recent application of this methodology in turbulence research can be found in Anderson (Reference Anderson2019), which leads to non-periodic phase-space trajectories of roughness-driven secondary flows in high-Reynolds-number boundary layers. It is worth noting that stability analysis would be a more conventional approach to the problem of multiple states. In fact, Huang et al. (Reference Huang, Xia, Wan, Shi and Chen2019b) applied stability analysis, but it was not fruitful. According to the authors, while stability analysis works for transitional flows, to apply stability analysis to fully turbulent flow is not straightforward; this is particularly true for flows with multiple states, for which the choice for a base flow becomes highly non-trivial.
The rest of the paper is organized as follows. A more in-depth summary of the multiple states phenomenology in RPCF is presented in § 2. We use the described data to anchor our derivation. We present our derivation in § 3. The results are presented in § 4, followed by conclusions in § 5. We try to keep the derivation simple and analytically tractable. To that end, discussion that involves numerical tools and tediously long algebra are moved to the appendices.
2. Multiple states phenomenology in RPCF
In this section, we give a more in-depth summary of the multiple states phenomenology in RPCF. Xia et al. (Reference Xia, Shi, Cai, Wan and Chen2018) reported two statistically stable states in a spanwise rotating channel at  $Re_w=U_wh/\nu =1300$ and
 $Ro=2\varOmega h/U_w=0.2$. In their DNSs, a Fourier–Chebyshev pseudospectral method was adopted to solve the governing equations with periodic boundary conditions in wall-parallel directions. The adequacy of their grid resolution is confirmed in a subsequent work by Huang et al. (Reference Huang, Xia, Wan, Shi and Chen2019b). In Xia et al. (Reference Xia, Shi, Cai, Wan and Chen2018), the coordinate system is such that
 $y$ is the wall-normal direction, which is different from the coordinate system defined here. According to the coordinate system here, the spanwise rotation is in the
 $-y$ direction. The two statistically stable states in Xia et al. (Reference Xia, Shi, Cai, Wan and Chen2018) feature two and three pairs of roll cells in a periodic domain of size
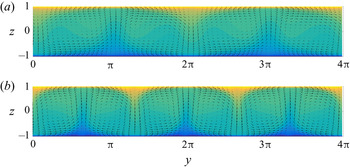
 $L_x\times L_y\times L_z=10{\rm \pi} h \times 4{\rm \pi} h \times 2h$, as shown in figure 1. Here,
 $h$ is the half-channel height,
 $U_w$ is half of the velocity difference between the two plates,
 $\varOmega$ is the angular velocity in the spanwise direction,
 $\nu$ is the kinematic viscosity,
 $x$,
 $y$ and
 $z$ denote the streamwise, spanwise and wall-normal directions and
 $L_x$,
 $L_y$ and
 $L_z$ are the domain sizes in the
 $x$,
 $y$ and
 $z$ directions. Throughout the paper, the two states with two pairs and three pairs of roll cells are referred to as
 $R2$ and
 $R3$, respectively. The data in Xia et al. (Reference Xia, Shi, Cai, Wan and Chen2018) suggested that the roll cells in both
 $R2$ and
 $R3$ are nearly streamwise homogeneous. Moreover, while
 $R2$ and
 $R3$ lead to disparate dispersive stresses, the mean flows in
 $R2$ and
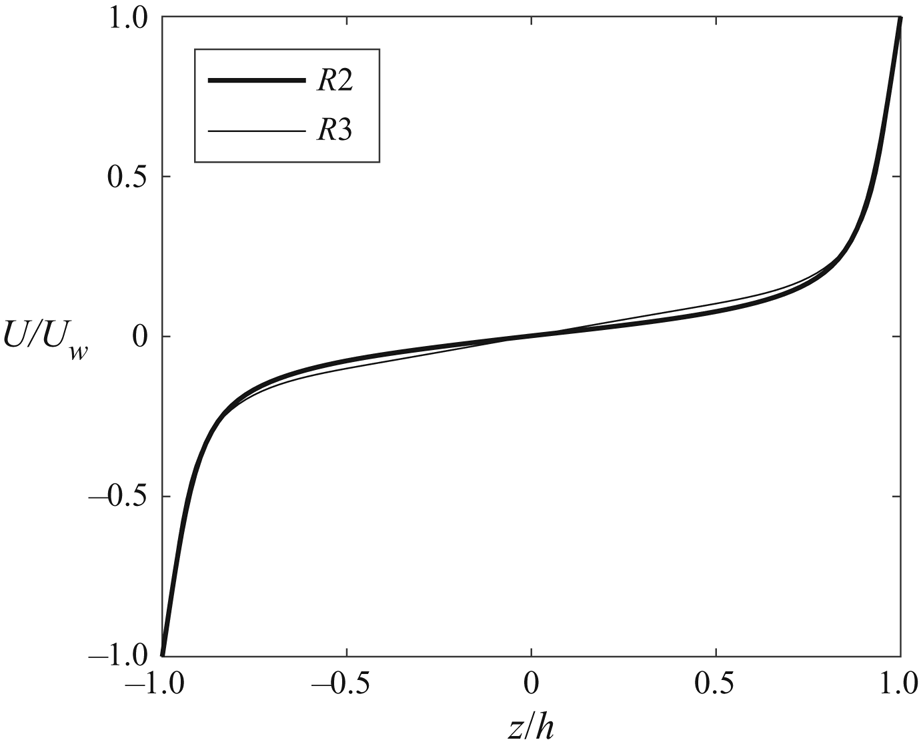
 $R3$ are very similar (see figure 2). In a follow-up work, Huang et al. (Reference Huang, Xia, Wan, Shi and Chen2019a) performed two groups of DNSs at a fixed Reynolds number
 $Re_w=1300$ but with
 $Ro$ varied from
 $0.01$ to
 $0.6$ and from
 $0.6$ to
 $0.01$. They found that the flow is more likely to converge to
 $R2$ when the rotation speed increases from
 $Ro=0.02$ to
 $Ro=0.5$ and more likely to converge to
 $R3$ when the rotation speed decreases from
 $Ro=0.5$ to
 $Ro=0.02$. In addition, the authors found that, at
 $Ro=0.5$, the flow contains roll cells but no multiple states, and at
 $Ro=0.6$, the flow can no longer sustain roll cells. In another follow-up work, Xia et al. (Reference Xia, Shi, Wan, Sun, Cai and Chen2019) synthesized a set of initial conditions by linearly interpolating between
 $R2$ and
 $R3$. There, the authors found that the flow is more likely to converge to
 $R2$ if the interpolation is biased towards
 $R2$ and vice versa.
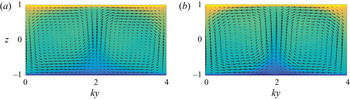
Temporally and streamwise averaged velocity field in RPCF at  $Ro=0.2$ and
 $Re_w=1300$, where the statistically stable state features (a) two pairs of roll cells and (b) three pairs of roll cells. The vectors show the in-plane motions, and the contours show the spatial variation of the streamwise velocity with the mean flow subtracted,
 $\bar {u}-U$. Here, yellow represents high streamwise velocity, blue represents low velocity and green is in between. The exact contour values are not important.

Horizontally and time averaged streamwise velocity in RPCF at  $Ro=0.2$ and
 $Re_w=1300$. Normalization is by
 $U_w$ and
 $h$.

3. Roll cell dynamics
The multiple states in RPCF are concerned with roll cell dynamics. In this section, we extract from the NS equation two equations that govern roll cell dynamics.
3.1. Theoretical derivation
Turbulence has many degrees of freedom, which gives rise to a high-dimensional phase space. Directly studying turbulent dynamics in a high-dimensional phase space is difficult (if not impossible). In order to make progress, we must simplify the NS equation according to the specific flow under consideration.
The NS equation for RPCF reads
 \begin{equation} \frac{\textrm{D} u_i}{\textrm{D} t}={-}\frac{1}{\rho}\frac{\partial p}{\partial x_i}+\frac{1}{Re_w} \frac{\partial^2 u_i}{\partial x_k^2}-\epsilon_{i2k}\,Ro\,u_k, \end{equation}
where  $u_i$ is the fluid velocity in the
 $i$th Cartesian direction,
 $\textrm {D}/\textrm {D}t$ is the total derivative and
 $i=1$, 2, 3 denote the streamwise, spanwise and wall-normal directions. We use
 $x$,
 $y$,
 $z$ interchangeably with
 $x_i$;
 $u$,
 $v$,
 $w$ interchangeably with
 $u_i$; and
 $\partial _i$ interchangeably with
 $\partial /\partial x_i$,
 $i=1$, 2, 3. Normalization is by half of the wall velocity difference
 $U_w$ and the half-channel height
 $h$. The bulk Reynolds number is
 $Re_w=U_wh/\nu$. In the main text, we present derivations for plane Couette flow. Derivations for TCF (which is concerned with surface curvature) are presented in appendix A.
First, we filter the NS equation in the streamwise direction at a scale  $\sim O(h)$ to remove the small scales and focus on the large-scale roll cells. The filtered streamwise velocity equation reads
 \begin{equation} \frac{\textrm{D}\tilde{u}_1}{\textrm{D}t}={-}\frac{1}{\rho}\partial_1 \tilde{p}-\partial_j \tilde{T}_{1j} + \frac{1}{Re_w}\partial_j\partial_j \tilde{u}_1-Ro \tilde{u}_3, \end{equation}
where  $\tilde {\cdot }$ denotes streamwise filtration and
 $\tilde {T}_{1j}$ is the turbulent stress. We define the filtered vorticity
 $\tilde {\omega }_i=\epsilon _{ijk}\partial _j \tilde {u}_k$. The streamwise vorticity equation reads
 \begin{equation} \frac{\textrm{D}\tilde{\omega}_1}{\textrm{D}t}=\tilde{\omega}_j\partial_j \tilde{u}_1-\epsilon_{1qi}\partial_q\partial_j\tilde{T}_{ij}+\frac{1}{Re_w}\partial_j\partial_j\tilde{\omega}_1+Ro\partial_2\tilde{u}_1. \end{equation}
For a spanwise RPCF that features multiple statistically stable states, the flow is approximately streamwise homogeneous, and we neglect the streamwise derivatives. To focus on the dynamics of the large-scale roll cells, we invoke the eddy viscosity model. It follows that the vortex stretching term  $\tilde {\omega }_j\partial _j \tilde {u}_1$ is zero upon substitution of the vorticity,
 $\tilde {\omega }_j=\epsilon _{jpq}\partial _p \tilde {u}_q$. Hence, (3.2) and (3.3) lead to
 \begin{equation} \partial_t\tilde{u}_1+\tilde{u}_j\partial_j\tilde{u}_1=\partial_j\left[\left(\frac{1}{Re_w}+\nu_t\right)\partial_j\tilde{u}_1\right]-Ro \tilde{u}_3 \end{equation}
and
 \begin{equation} \partial_t\tilde{\omega}_1+\tilde{u}_j\partial_j\tilde{\omega}_1=\partial_j\left[\left(\frac{1}{Re_w}+\nu_t\right)\partial_j\tilde{\omega}_1\right]+Ro\partial_2\tilde{u}_1, \end{equation}
where  $j=2,3$,
 $\nu _t$ is the eddy viscosity and
 $\partial _{jj}=\partial _{22}+\partial _{33}$.
Second, we define a streamfunction  $\psi$ such that
 \begin{equation} \left.\begin{gathered} \tilde{u}_2=\partial_3\psi, \\ \tilde{u}_3={-}\partial_2\psi. \end{gathered}\right\}\end{equation}
It follows that  $\tilde {\omega }_1=-\partial _j\partial _j\psi$. Plugging (3.6) into (3.4) and (3.5) leads to
 \begin{equation} \partial_t\tilde{u}_1 +\partial_2\tilde{u}_1\partial_3\psi-\partial_3\tilde{u}_1\partial_2\psi =\partial_j\left[\frac{1}{R}\partial_j\tilde{u}_1\right]+Ro\partial_2\psi \end{equation}
and
 \begin{equation} \partial_t\partial_j\partial_j\psi +\partial_2\partial_j\partial_j\psi\partial_3\psi-\partial_3\partial_j\partial_j\psi\partial_2\psi=\partial_j\left[\frac{1}{R}\partial_j\partial_q\partial_q \psi\right]-Ro\partial_2\tilde{u}_1. \end{equation}
In the above equations, we have invoked the effective Reynolds number  $R=1/(1/Re_w+\nu _t)$ following Anderson (Reference Anderson2019). As the eddy viscosity is generally not a constant, invoking the effective Reynolds number is a crude approximation. Nonetheless, in this context, because the eddy viscosity in the bulk region of a spanwise rotating channel is in fact close to a constant (Yang et al. Reference Yang, Xia, Lee, Lv and Yuan2020a), invoking the effective Reynolds number here has a somewhat sounder physical basis.
Third, we project (3.7) and (3.8) onto a statistically stable state:
 \begin{equation} \left.\begin{gathered} \psi(x_2,x_3,t)=a(t)\alpha(x_2,x_3),\\ \tilde{u}_1(x_2,x_3,t)=b(t)\beta(x_2,x_3)+U(x_3), \end{gathered}\right\}\end{equation}
where  $\alpha$ and
 $\beta$ represent roll cells of a given wavenumber and
 $U(x_3)$ is the mean flow. Here, we assume that the mean flow does not depend on a particular state. This assumption is consistent with the data and simplifies the analysis that follows. Relaxing this assumption leads to more involved mathematics but essentially the same conclusions, as shown in appendix B. Plugging (3.9) into (3.7) and (3.8) leads to
 \begin{equation} \beta \frac{\textrm{d}b}{\textrm{d}t}+ab\partial_2\beta\partial_3\alpha-ab\partial_3\beta \partial_2\alpha-a\partial_3U \partial_2\alpha =\frac{1}{R}b\partial_j\partial_j\beta+\frac{1}{R}\partial_3\partial_3U+Ro\,a\partial_2\alpha \end{equation}
and
 \begin{align} \partial_j\partial_j\alpha \frac{\textrm{d}a}{\textrm{d}t}+a^2(\partial_2\partial_j\partial_j\alpha\partial_3\alpha-\partial_3\partial_j\partial_j\alpha\partial_2\alpha) =\frac{1}{R}a\left[\partial_2^4\alpha+2\partial_2^2\partial_3^2\alpha+\partial_3^4\alpha\right]-Ro\,b\partial_2\beta. \end{align}
Equations (3.10) and (3.11) govern the dynamics of roll cells. In (3.10) and (3.11), we have left  $\alpha$ and
 $\beta$ as generic functions of
 $y$ and
 $z$, and, importantly, we have retained nonlinearity.
Fourth, we need ansatzes for  $\alpha$ and
 $\beta$ in order to advance. The DNS solution is by itself a good ansatz: it is a solution to the Reynolds-averaged NS equation, and it satisfies the no-slip condition. However, the use of DNS data necessarily involves numerical tools in the following derivations, and we will postpone the analysis to appendix C. Here, we use the following analytical ansatz to approximate the multiple states:
 \begin{equation} \left.\begin{gathered} \alpha={-}\sin\left(\frac{\rm \pi}{2}ky\right)\cos\left(\frac{\rm \pi}{2}z\right),\\ \beta={-}\cos\left(\frac{\rm \pi}{2}ky\right)\left[1-\cos\left({\rm \pi} z\right)\right]. \end{gathered}\right\}\end{equation}
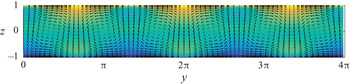
The ansatz in (3.12) does not satisfy the no-slip condition at  $z/h=\pm 1$. This is in fact a common practice analysis (Chandra & Verma Reference Chandra and Verma2013; Wagner & Shishkina Reference Wagner and Shishkina2013; Chong et al. Reference Chong, Wagner, Kaczorowski, Shishkina and Xia2018). For example, Anderson (Reference Anderson2019) applied truncated Galerkin projection to study the dynamics of the secondary flows above spanwise heterogeneous surface roughness, and the ansatz used in his work does not satisfy the no-slip condition. Also, when studying large-scale circulation reversal in Rayleigh–Bénard flows, Chen et al. (Reference Chen, Huang, Xia and Xi2019) applied truncated Galerkin projection and projected the instantaneous flow field onto a few Fourier modes, and these modes do not satisfy the no-slip condition on wall boundaries. In general, when applying truncated Galerkin projection, the idea is to focus on the bulk flow behaviour. Figure 3 shows the ansatz for
 $k=3/{\rm \pi}$, which corresponds to
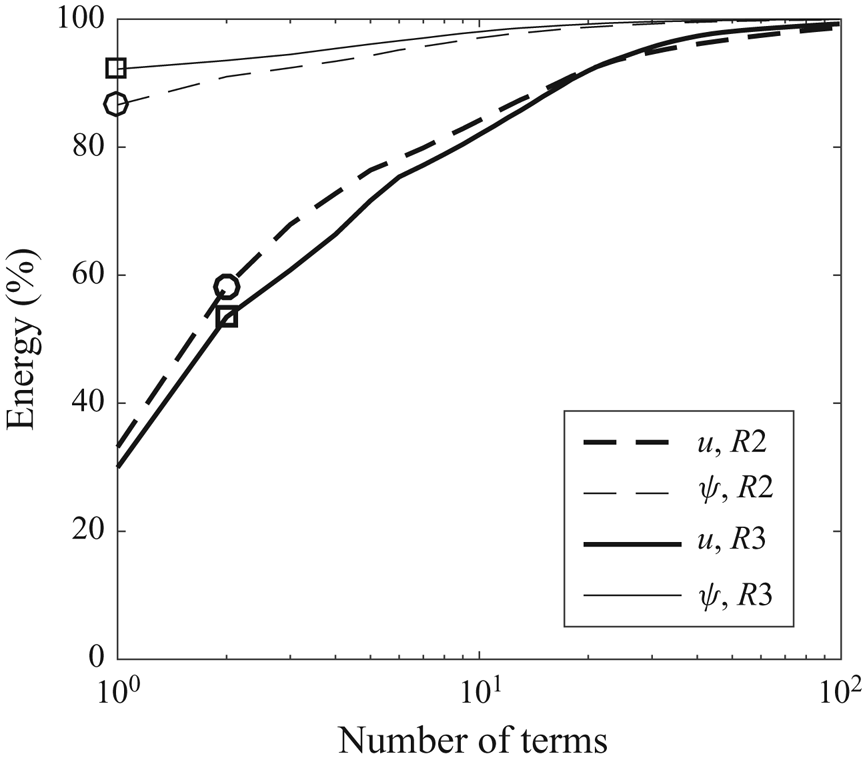
 $R3$. As we can see from figure 3, the ansatz compares well with the data, i.e. figure 1(b). Quantitatively, our analytical ansatz (which contains but only one Fourier mode) contains about 55 % of the energy in
 $\tilde {u}$ and about 90 % of the energy in
 $\tilde {v}$ and
 $\tilde {w}$. The next most energetic Fourier mode contains about 7 % of the energy in
 $\tilde {u}$ and 1 % of the energy in
 $\tilde {v}$ and
 $\tilde {w}$. For
 $R2$, our analytical ansatz contains about 60 % of the energy in
 $\tilde {u}$ and about 85 % of the energy in
 $\tilde {v}$ and
 $\tilde {w}$. The next most energetic Fourier mode contains about 7 % of the energy in
 $\tilde {u}$ and about 4 % of the energy in
 $\tilde {v}$ and
 $\tilde {w}$. One can, of course, obtain more realistic ansatzes by including additional terms in (3.12). Figure 4 shows the energy contained in the ansatzes as we include more Fourier modes. As one would expect, accuracy comes at the price of brevity. In appendix C, we use the DNS solution as our ansatz, and we show that our conclusions are not affected.
Equation (3.12) with  $k=3/{\rm \pi}$. Contours are for
 $u$ and vectors are for
 $v$ and
 $w$. Again, the exact contour values are not important.

The energy contained in the ansatz as a function of  $n$, where
 $n$ is the number of terms in the ansatz. The thick lines are for
 $u$. The thin lines are for
 $\psi$. The dashed lines are for
 $R2$. The solid lines are for
 $R3$.

3.2. Dynamics of the stable states
Before we proceed with our derivation, we take a close look at the flow dynamics near the two stable states in  $R2$ and
 $R3$ so that we have in mind what to expect. Equations (3.10) and (3.11) map the roll cell dynamics to two variables:
 $a$ and
 $b$. We define the projection operator as
 \begin{equation} \int_0^{L_y}\int_{{-}1}^{1} f\cdot \alpha \,\textrm{d}z \,{\textrm{d} y}, \end{equation}
where we project  $f$ onto
 $\alpha$. We project the DNS data on the ansatzes in (3.12) and get
 $a$ and
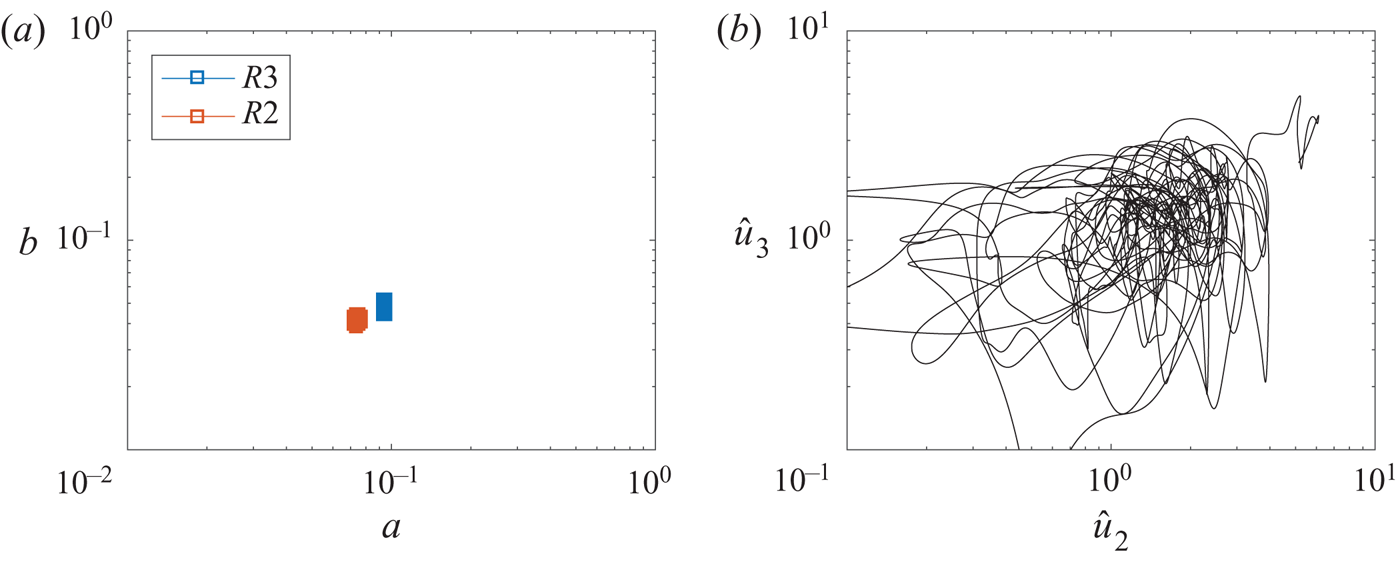
 $b$. The two values can be understood as containing both the real and the imaginary parts of the corresponding Fourier mode. In figure 5(a), we plot the trajectories of
 $R2$ and
 $R3$ in the phase space of
 $a$ and
 $b$. The two trajectories circle around their time means. Because the two DNSs have reached statistically stationary states,
 $a$ and
 $b$ do not decay or increase. For comparison, in figure 5(b), we plot the trajectory of the shell model, an ergodic model for energy cascade, in the subphase space of two Fourier modes. The integral length of the corresponding isotropic flow is
 $L$. The two Fourier modes correspond to the length scales of
 $L/2$ and
 $L/8$ (relatively large-scale modes). Details of the data in figure 5(b) are presented in appendix D. Comparing figures 5(a) and 5(b), the trajectory in figure 5(b) visits a large area in the phase space and is easily ergodic, but the two trajectories in figure 5(a) are confined in two small regions, and the two regions do not overlap, thereby leading to two statistically stable states.
(a) Trajectories of  $R2$ and
 $R3$ in the phase space of
 $a$ and
 $b$. (b) Trajectory of the shell model for isotropic turbulence in the subphase space of two Fourier modes
 $\hat {u}_2$ and
 $\hat {u}_3$. The
 $x$ and
 $y$ axes in both panels span two decades.

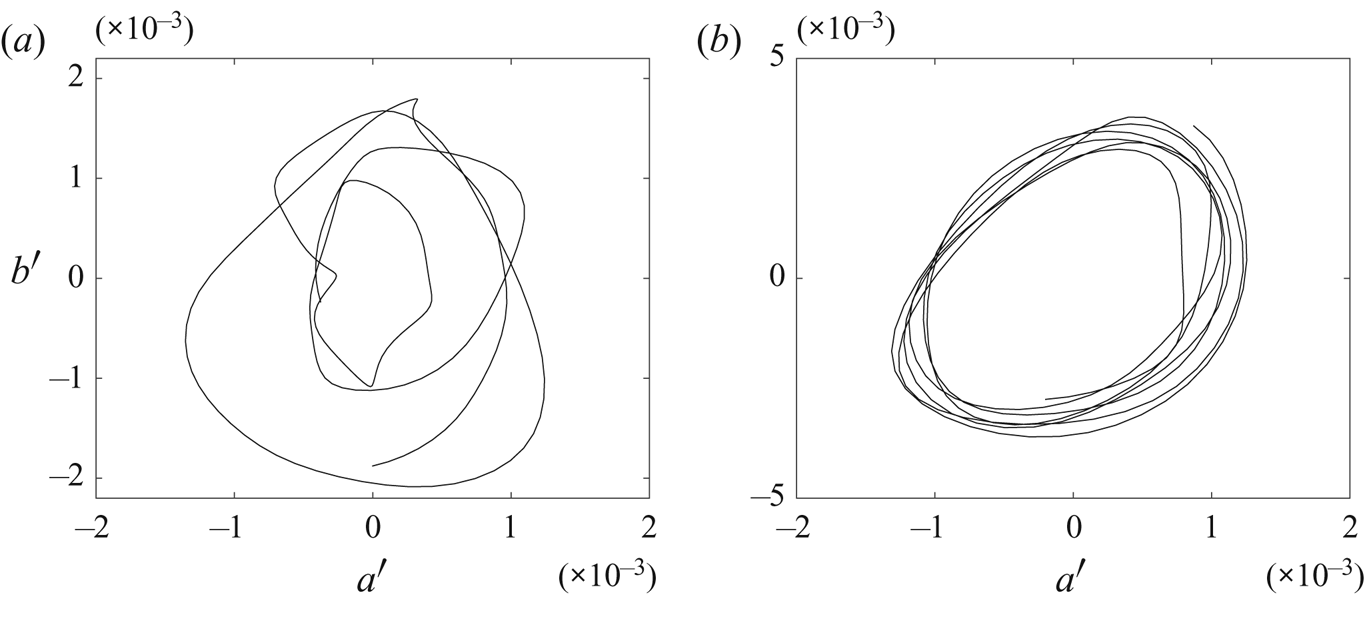
Figure 6 shows a zoom-in view of the trajectories in the phase space of  $a^\prime$ and
 $b^\prime$, where the superscript
 $\prime$ denotes temporal fluctuations. Limit-cycle-like trajectories are found in both
 $R2$ and
 $R3$. The time elapse of the data is
 $1000h/U_w$ (Xia et al. Reference Xia, Shi, Cai, Wan and Chen2018). Xia et al. could not rule out the possibility of state exchange because it was not clear how 1000
 $h/U_w$ compares to the turnover time of a roll cell. For example, if the eddy turnover time of a roll cell is 10
 $h/U_w$, the simulation time 1000
 $h/U_w$ would be sufficient to rule out the possibility of state exchange, but if the eddy turnover of a roll cell is
 $10\,000 h/U_w$, the simulation time
 $1000h/U_w$ would not be sufficient. Figure 6 addresses the above question. The time it takes to do a circle in the phase space is a good approximation of a roll cell's turnover time. Here, the flow is not able to escape after many cycles, and therefore we can safely conclude that
 $R2$ and
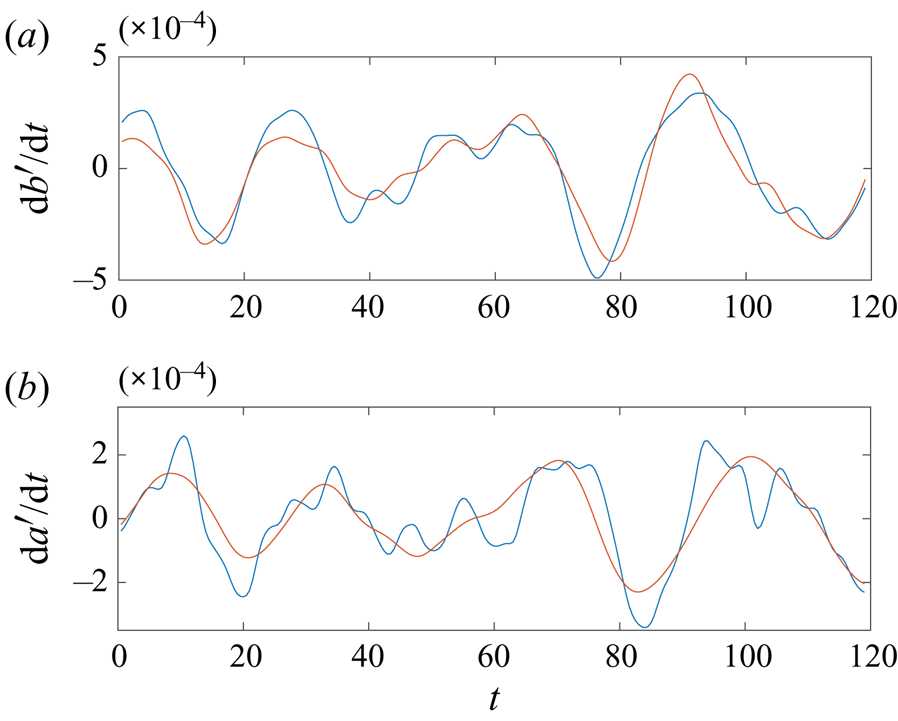
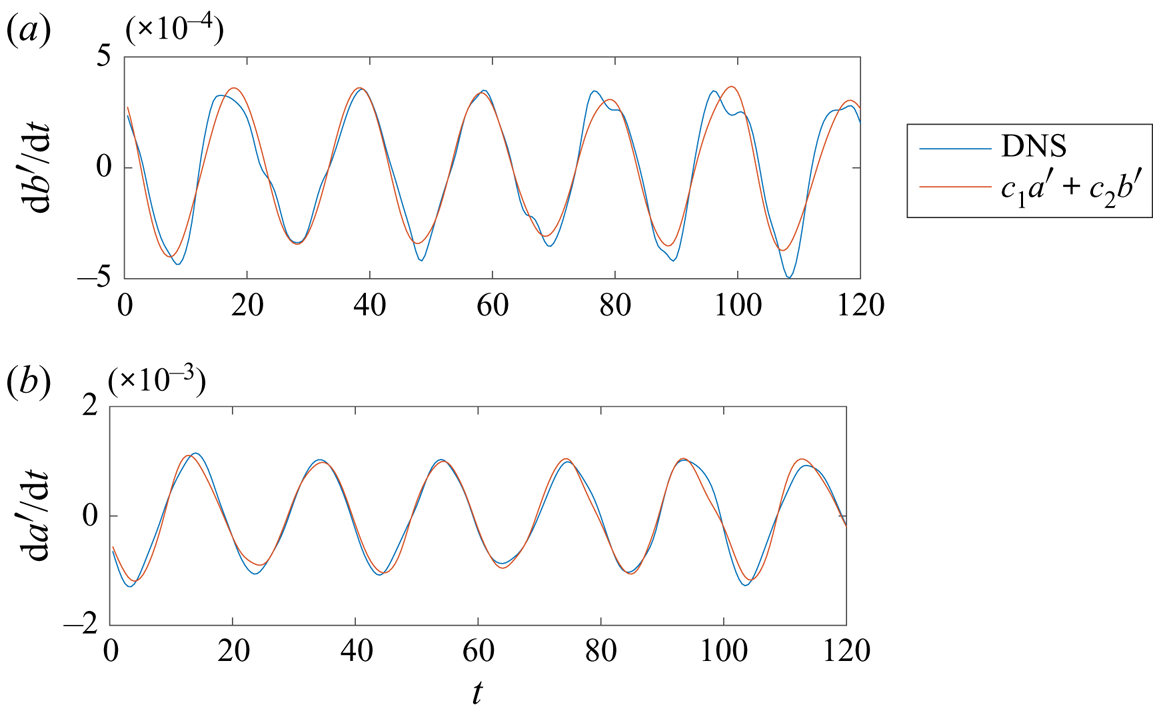
 $R3$ are stable multiple states. For reasons that will be clear in the next subsection, we fit
 $\textrm {d}a^\prime /\textrm {d}t$ and
 $\textrm {d}b^\prime /\textrm {d}t$ to the linear dynamics
 $c_1a^\prime +c_2b^\prime$, where
 $c_1$ and
 $c_2$ are constants. In figures 7 and 8, the data are compared to the linear dynamics, and the two are remarkably similar, suggesting that the flow near the two stable states is governed by linear dynamics. Ergodicity relies on sufficiently large fluctuations, and in a turbulent flow system, large fluctuations are often results of nonlinear interactions. The fact that the evolution of
 $a^\prime$ and
 $b^\prime$ follows linear dynamics explains, from a phenomenological standpoint, why the flow is trapped within a stable state. The challenge remains as to whether we could theoretically show that
 $a$ and
 $b$ follow linear dynamics.
Zoomed view of the trajectories of (a)  $R2$ and (b)
 $R3$ in the phase space of
 $a^\prime$ and
 $b^\prime$.

The time evolution of (a)  $a^\prime$ and (b)
 $b^\prime$ in
 $R2$ and fits to linear dynamics.

The time evolution of (a)  $a^\prime$ and (b)
 $b^\prime$ in
 $R3$ and fits to linear dynamics.

3.3. Truncated Galerkin projection and bifurcation analysis
We proceed with our derivation. In § 3.1, we were at step four. In § 3.2, we saw that the data suggest linear dynamics near a stable state. In this section, we see if our derivation gives rise to the observed linear dynamics. The fifth step is to plug (3.12) into (3.10) and (3.11) and project the two equations onto the ansatzes in (3.12). Projection is defined in (3.13). After some (long) algebra, we arrive at
 \begin{equation} \frac{\textrm{d}b}{\textrm{d}t}=\left[\frac{4k}{9}Ro+\frac{k{\rm \pi}}{3}\int_{{-}1}^1\sin^2\left(\frac{\rm \pi}{2}z\right) \cos\left(\frac{\rm \pi}{2}z\right)\frac{\textrm{d}U}{\textrm{d}z} \textrm{d}z\right]a -\left(k^2+\frac{4}{3}\right)\frac{1}{R}\left(\frac{\rm \pi}{2}\right)^2b \end{equation}
and
 \begin{equation} \frac{\textrm{d}a}{\textrm{d}t}={-}\frac{1}{R}(k^2+1)({\rm \pi}/2)^2a -\frac{4}{3}\frac{k}{k^2+1}Ro({\rm \pi}/2)^{{-}2}b, \end{equation}
which is indeed linear dynamics. In arriving at the above two equations, we invoke  $\sin ({\rm \pi} /2kL_y)=0$ since there can only be integer pairs of roll cells in the domain. It is worth noting that truncated Galerkin projection does not preclude nonlinearity. The integral in (3.14) is
 \begin{align} \int_{{-}1}^1\sin^2\left(\frac{\rm \pi}{2}z\right)\cos\left(\frac{\rm \pi}{2}z\right)\frac{\textrm{d}U}{\textrm{d}z} \textrm{d}z={-}\int_{{-}1}^1 U\frac{\rm \pi}{2} \sin\left(\frac{\rm \pi}{2}z\right)\left[2-3\sin^2\left(\frac{\rm \pi}{2}z\right)\right]\textrm{d}z \approx 0.27 \end{align}
for both  $R2$ and
 $R3$. Although it is somewhat trivial, we note that according to (3.16), the integral is concerned with
 $U$ not its derivative.
We are now at the last step. Sixth, we conduct bifurcation analysis of the ordinary differential equations in (3.14) and (3.15). If multiple statistically stable states exist,  $\textrm {d}a/\textrm {d}t=0$ and
 $\textrm {d}b/\textrm {d}t=0$ must have multiple non-trivial solutions. Hence, if multiple states exist, the eigenvalues of the ordinary differential equations in (3.14) and (3.15) must be such that
 \begin{equation} \lambda_{1,2}=0, \end{equation}
for non-trivial  $a$ and
 $b$. This necessarily leads to
 \begin{equation} (k^2+1)^2(k^2+4/3)-Ck^2=0,\quad C\approx{-} \left(0.039 Ro^2+0.025 Ro\right)R^2. \end{equation}
Equation (3.18a,b) is a cubic equation of  $k^2$ (note that
 $Ro<0$ and
 $C>0$). For certain
 $C$, i.e. for certain flow condition, there are two physically viable roots:
 \begin{equation} \left.\begin{gathered} k_1^2=h^{1/3} + gh^{{-}1/3} - 10/9,\\ k_2^2={-}\textrm{i}\sqrt{3/4}\times( h^{1/3}- gh^{{-}1/3}) -1/2\times(h^{1/3} + gh^{{-}1/3})-10/9, \end{gathered}\right\} \end{equation}
where  $f=5C/9+1/729$,
 $g=C/3+1/81$,
 $h=(\,f^2 - g^3)^{1/2} - f$,
 $\textrm {i}=\sqrt {-1}$,
 $\textrm {i}^{1/3}=\exp (\textrm {i}\cdot {\rm \pi}/6)$,
 $(-\textrm {i})^{1/3}= \exp (-\textrm {i}\cdot {\rm \pi}/6)$. Here,
 $k_2^2$ is real and is positive despite the appearance of the unit imaginary number
 $\textrm {i}$. Hydrodynamic stability does not allow for very slim or very fat roll cells (Drazin & Reid Reference Drazin and Reid2004). Determining the limits of roll cell aspect ratio falls out of the scope of this paper. Here, we arbitrarily cut off at
 $k=0.5$ and
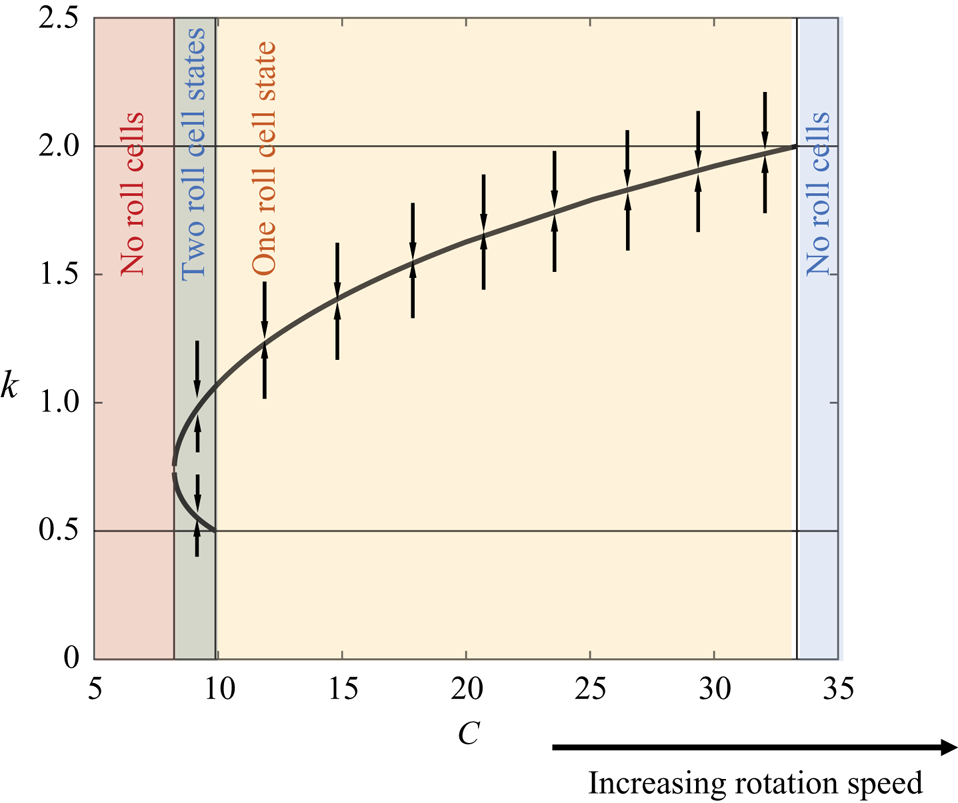
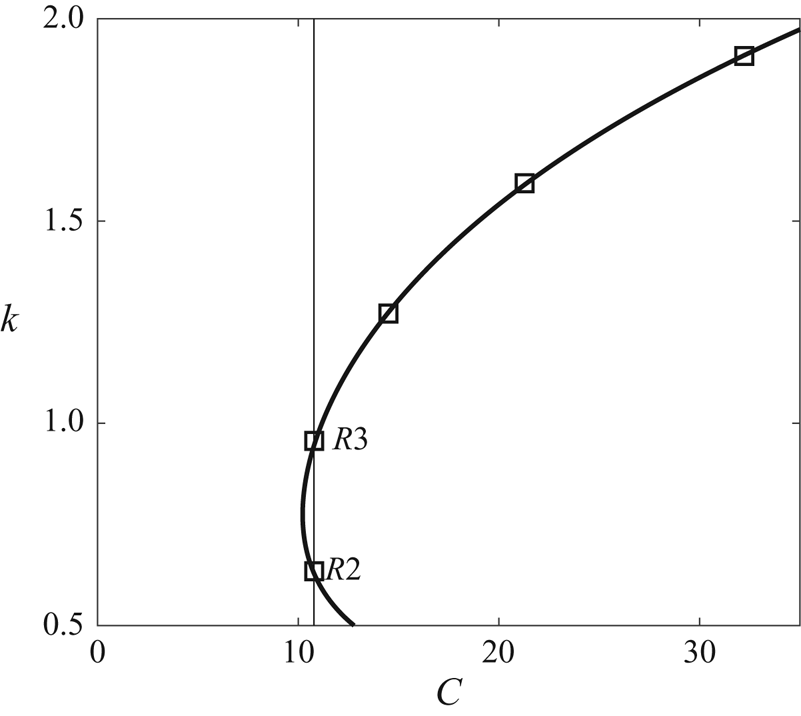
 $k=2$, constraining that the roll cell heights to be no more than twice their widths and no less than half their widths. Figure 9 shows the bifurcation diagram, where we plot
 $k_1$ and
 $k_2$ as a function of
 $C$. We conclude our derivation here.


Before we proceed to predictions, we make two observations. First, truncated Galerkin projection preserves nonlinearity in the equation; however, the application of truncated Galerkin projection to this particular problem leads to linear dynamics. Second, (3.18a,b) is, strictly speaking, a sextic polynomial, which, in principle, has six roots. Nonetheless, it turns out that if one regards  $k^2$ as the unknown, the equation reduces to a cubic one; and it also happens that one of the three roots of the cubic equation is always negative, leaving us only two physically viable roots.
4. Predictions of the model
4.1. Multiple states in an infinitely large domain
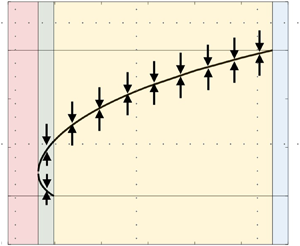
According to figure 9, for small values of  $Ro$, the flow is in the red zone, and there is no physically viable root to (3.18a,b). It follows that, for a non-rotating plane Couette flow, multiple states that feature roll cells with different wavenumbers are not possible. For a flow that is in the green zone, i.e. for a moderate rotation number, (3.18a,b) has two roots between 0.5 and 2, leading to multiple states. This is evidenced by the multiple states in Xia et al. (Reference Xia, Shi, Cai, Wan and Chen2018). In the yellow zone, i.e. at high rotation speeds, (3.18a,b) has one root between 0.5 and 2. This means that while roll cells could still be found, they could only be found at one wavenumber. The existence of this regime is confirmed in Huang et al. (Reference Huang, Xia, Wan, Shi and Chen2019a): the authors increased
 $Ro$ from a small value to
 $Ro=0.5$ and found that the spanwise domain always contains four roll cells irrespective of the initial condition (i.e. there is only one stable state). Last, in the blue zone, i.e. at high rotation speeds, (3.18a,b) does not have a root between 0.5 and 2, and no roll cells could be found. The existence of this regime is also confirmed in Huang et al. (Reference Huang, Xia, Wan, Shi and Chen2019a): the authors increased the rotation speed to 0.6, and the flow could no longer sustain the roll cells. For
 $C$ that gives rise to multiple states, e.g.
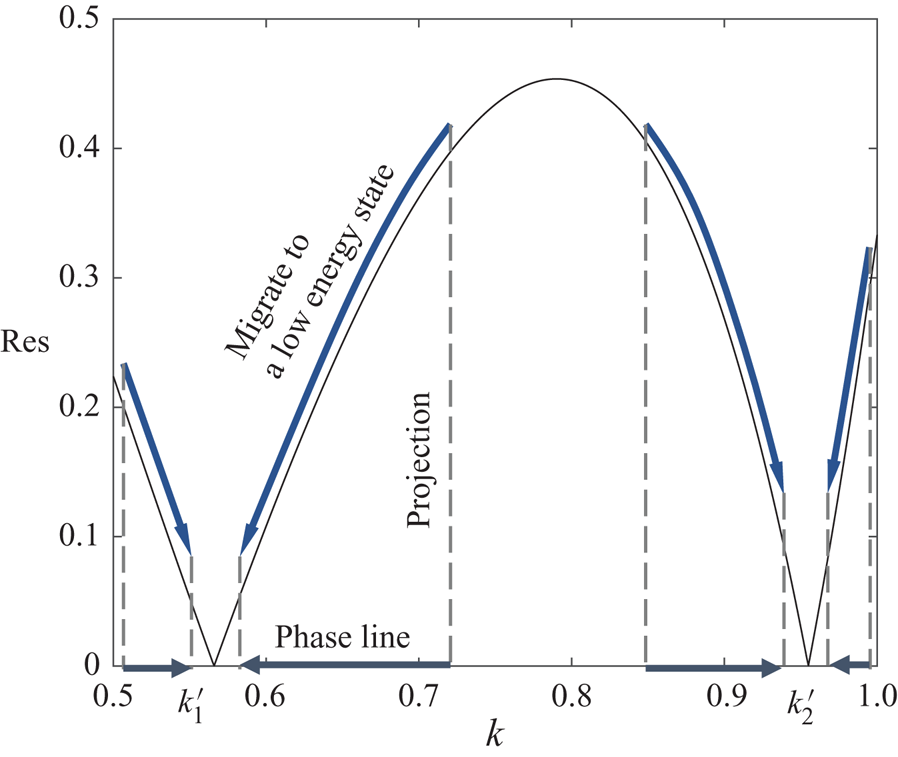
 $C=9$, we plot the residual of the cubic equation (3.18a,b) in figure 10. The two statistically stable states, denoted as
 $k_1'$ and
 $k_2'$, yield 0. The residual measures the distance of a state from the equilibrium and therefore can be interpreted as a measure of the energy level. From figure 10, we can conclude that the large energy barrier between the two stable states locks the flow at one state, leading to non-ergodicity. The system would have been ergodic if the energy barrier is low or if the flow has enough energy to go from one state to the other. Figure 10 also has implications on the flow dynamics. For instance, if the flow is at
 $k=0.7$, i.e. a high-energy state, it will migrate to
 $k_1'$, i.e. a low-energy state. Visualizing the migration of every state in the
 $k$ space leads to the phase lines in figure 10, and visualizing these phase lines at all
 $C$ values leads to the arrows in figure 9.
Residual of (3.18a,b) for  $C=9$. States
 $k_1'$ and
 $k_2'$ correspond to two states that yield 0 residual.

4.2. Multiple states in a finite domain
A finite domain admits only a few discrete wavenumbers. For a domain that extends  $L_y=4{\rm \pi}$ in the spanwise direction, the wavenumber
 $k$ can only take values
 $1/{\rm \pi}$,
 $2/{\rm \pi}$,
 $3/{\rm \pi} ,\ldots n/{\rm \pi}$, where
 $n$ is an integer. Xia et al. (Reference Xia, Shi, Cai, Wan and Chen2018) observed bistability for
 $k=2/{\rm \pi}$ and
 $k=3/{\rm \pi}$. However, according to (3.18a,b), the two wavenumbers
 $k=2/{\rm \pi}$ and
 $3/{\rm \pi}$ correspond to two different values of
 $C$, i.e.
 $C_1$ and
 $C_2$. Because of this, according to figure 9, bistability of
 $k=2/{\rm \pi}$ and
 $3/{\rm \pi}$ would not be possible at a given flow condition (for a given
 $C$) in an infinite domain. In the following, we explain why bistability of
 $k=2/{\rm \pi}$ and
 $3/{\rm \pi}$ is possible in a finite domain of size
 $L_y=4{\rm \pi}$.
First, we pick two flow conditions, i.e. two  $C$ values,
 $C'$ and
 $C''$, such that
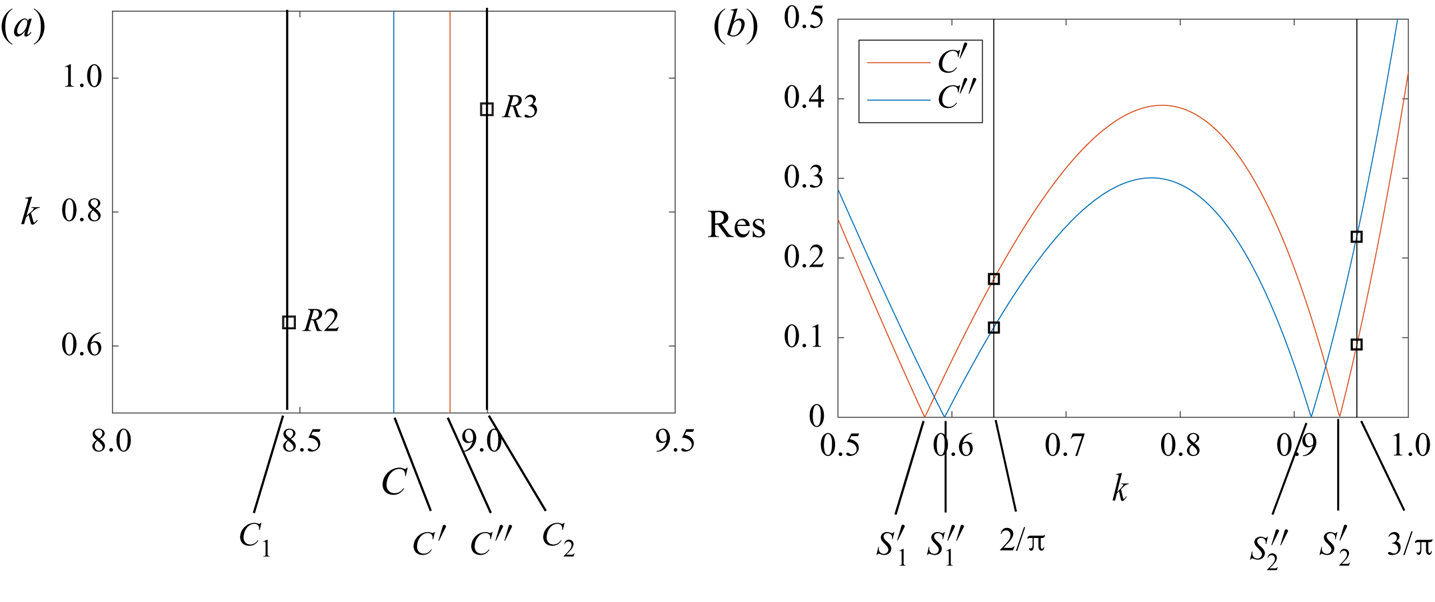
 $C_1<C'<C''<C_2$. Figure 11(b) plots the energy of all possible states, i.e.
 $k$, for the two conditions
 $C'$ and
 $C''$. For an infinite domain, condition
 $C'$ will result in bistability at
 $s_1'$ and
 $s_2'$ and condition
 $C''$ will result in bistability at
 $s_1''$ and
 $s_2''$. However, for a domain of size
 $L_y=4{\rm \pi}$ and at the condition
 $C'$,
 $k$ takes values of
 $1/{\rm \pi}$,
 $2/{\rm \pi}$,
 $3/{\rm \pi} ,\ldots n/{\rm \pi}$ only. Among those values,
 $k=2/{\rm \pi}$ and
 $k=3/{\rm \pi}$ are at the lowest energy. Now, supposing the flow is at state
 $k=2/{\rm \pi}$, the energy barriers (the bumps in figure 11b) will keep the flow at
 $k=2/{\rm \pi}$; and if the flow is at state
 $k=3/{\rm \pi}$, the energy barriers will keep the flow at
 $k=3/{\rm \pi}$: making bistability of
 $k=2/{\rm \pi}$ and
 $k=3/{\rm \pi}$ possible at both conditions
 $C'$ and
 $C''$. This explains why
 $R2$ and
 $R3$ can be observed for a range of rotation numbers in a finite domain (Huang et al. Reference Huang, Xia, Wan, Shi and Chen2019a) and in general why the same multiple states can be observed within a range of flow conditions.
(a) States  $R2$ (
 $k=2/{\rm \pi}$) and
 $R3$ (
 $k=3/{\rm \pi}$) and the corresponding
 $C$ values. State
 $R2$ corresponds to
 $C_1$ and
 $R3$ corresponds to
 $C_2$. Here,
 $C_1<C'<C''<C_2$. (b) Residual/energy for
 $C'$ and
 $C''$. Here
 $s_1'$,
 $s_2'$ are at
 $\textrm {res}=0$ for
 $C'$;
 $s_1''$,
 $s_2''$ are at
 $\textrm {res}=0$ for
 $C''$.

To elaborate, whether a state is statistically stable depends on whether the flow can migrate to a lower-energy state. A state will be statistically unstable if the flow can migrate to a lower-energy state, and a state will be statistically stable if the flow cannot migrate to a lower-energy state. A domain of size  $L_z=4{\rm \pi}$ admits
 $k=1/{\rm \pi}$,
 $2/{\rm \pi} ,\ldots , n/{\rm \pi}$, where
 $n$ is an integer. All these states have a residual. Among these states, the two states
 $k=2/{\rm \pi}$ and
 $k=3/{\rm \pi}$ have the smallest residual, i.e. lowest energy. Because the two states cannot migrate from one to the other (due to the energy barrier) and because other states are at higher energy levels, the two states
 $k=2/{\rm \pi}$ and
 $k=3/{\rm \pi}$ are statistically stable, leading to bistability of these two states in a finite domain. Following the above discussion, we can now more precisely define ‘bistability’. Bistability does not necessarily refer to two states that have 0 residual; it refers to two states that do not migrate from one to the other nor migrate to other states.
5. Conclusions
We present an analytically tractable derivation that gives rise to multiple states in rotating flows. We show that non-ergodicity in a spanwise rotating channel is because the flow does not have the energy to escape a statistically stable state. According to this derivation, spanwise RPCF in an infinitely large domain can have two and only two statistically stable states. If the initial state corresponds to an unstable state, the flow will migrate to a stable state. Finite domains (albeit with periodic boundary conditions in the horizontal directions) admit wavenumbers at a few discrete values. This gives rise to the observed selection of certain statistically stable states by differently sized domains and different initial conditions. A few straightforward extensions of our theory are presented in the appendices. They involve either the use of numerical tools, which enable us to handle more degrees of freedom, or long mathematical derivations. Refining this derivation to a point where it could make more quantitative predictions, like the exact rotation number from which we can observe multiple states, is tantalizingly out of reach at this moment and will be the focus of future research.
Acknowledgements
X.I.A.Y. thanks C. Meneveau, J. Cimbala and R. Kunz for useful inputs.
Funding
X.I.A.Y. acknowledges ONR for financial support. Z.X. acknowledges the support from NSFC (grant nos. 11822208 and 11772297).
Declaration of interests
The authors report no conflict of interest.
Appendix A. Taylor–Couette flow
Figure 12 is a sketch of a TCF, where  $\theta$ is the ‘streamwise’ direction,
 $z$ is the ‘spanwise’ direction and
 $r$ is the ‘wall-normal’ direction. Without loss of generality, the radius of the outer cylinder is
 $r=r_0+1$ and the radius of the inner cylinder is
 $r=r_0-1$. The azimuthal filtered flow is approximately homogeneous in the
 $\theta$ direction. Repeating the first step but for TCF, we get two equations that govern the dynamics of
 $\tilde {u}_\theta$ and
 $\tilde {\omega }_\theta$:
 \begin{equation} \left.\begin{gathered} \frac{\partial \tilde{u}_\theta}{\partial t}+\tilde{u}_r\frac{\partial \tilde{u}_\theta}{\partial r}+\frac{ \tilde{u}_r\tilde{u}_\theta}{r}+\tilde{u}_z\frac{\partial \tilde{u}_\theta}{\partial z}= \frac{1}{R}\left[\frac{1}{r}\frac{\partial }{\partial r}\left(r\frac{\partial \tilde{u}_\theta}{\partial r}\right)- \frac{\tilde{u}_\theta}{r^2}+\frac{\partial^2 \tilde{u}_\theta}{\partial z^2}\right]-Ro \tilde{u}_r,\\ \frac{\partial \tilde{\omega}_\theta}{\partial t}+\tilde{u}_r\frac{\partial \tilde{\omega}_\theta}{\partial r}+\tilde{u}_z\frac{\partial \tilde{\omega}_\theta}{\partial z}=\frac{1}{R}\left[\frac{\partial^2 \tilde{\omega}_\theta }{\partial r^2}+\frac{1}{r}\frac{\partial \tilde{\omega}_\theta}{\partial r}+\frac{\partial^2 \tilde{\omega}_\theta}{\partial z^2}\right]+Ro\frac{\partial \tilde{u}_\theta}{\partial z}. \end{gathered}\right\} \end{equation}
Observe that for  $r_0\gg 1$, (A1) reduces to (3.4) and (3.5) (upon a coordinate transformation that maps
 $\theta$ to
 $x$,
 $z$ to
 $y$ and
 $r$ to
 $z$). A streamline function
 $\psi$ could be defined:
 \begin{equation} \left.\begin{gathered} \tilde{u}_r={-}\frac{1}{r}\frac{\partial \psi}{\partial z},\\ \tilde{u}_z=\frac{1}{r}\frac{\partial \psi}{\partial r}, \end{gathered}\right\} \end{equation}
and it follows that the vorticity in the  $\theta$ direction is
 \begin{equation} \tilde{\omega}_\theta={-}\frac{1}{r}\left[\frac{\partial^2 \psi}{\partial z^2}+\frac{\partial^2 \psi}{\partial r^2}-\frac{1}{r}\frac{\partial \psi}{\partial r}\right]. \end{equation}
Repeating step two and plugging (A2) and (A3) into (A1) leads to two equations for  $\tilde {u}_\theta$ and
 $\psi$, similar to (3.7) and (3.8).
A sketch of TCF.

Further advancements will require ansatzes for the roll cells. Without loss of generality, a possible ansatz is
 \begin{equation} \left.\begin{gathered} \psi=a(t) \alpha(r,z), \quad \alpha(r,z)={-}r_0 \sin\left(\frac{\rm \pi}{2}kz\right)\cos\left(\frac{\rm \pi}{2}r\right);\\ \tilde{u}_\theta=b(t) \beta(r,z)+U(r), \quad \beta(r,z)={-}\cos\left(\frac{\rm \pi}{2}kz\right)\left(1-\cos\left({\rm \pi} r\right)\right). \end{gathered}\right\}\end{equation}
Proceeding to step five will lead to two ordinary differential equations for  $a(t)$ and
 $b(t)$, whose non-trivial nodes give the statistically stable states. However, such analysis involves integrals that could not be evaluated analytically. Also, considering that we do not have access to the TCF data, we will not pursue this analysis in this paper.
Appendix B. Accounting for interactions between the mean flow and the roll cells
We add an additional term  $c(t) \gamma (x_3)$ to the ansatz of
 $\tilde {u}_1$ in order to account for the interactions between the mean flow and the roll cells:
 \begin{equation} \left.\begin{gathered} \psi(x_2,x_3,t)=a(t)\alpha(x_2,x_3),\\ \tilde{u}_1(x_2,x_3,t)=b(t)\beta(x_2,x_3)+c(t)\gamma(x_3)+U(x_3). \end{gathered}\right\} \end{equation}
Repeating step three and plugging (B1) into (3.7) lead to
 \begin{align} &\beta \frac{\textrm{d}b}{\textrm{d}t}+\gamma\frac{\textrm{d}c}{\textrm{d}t}+ab\partial_2\beta\partial_3\alpha-ab \partial_3\beta \partial_2\alpha-a\partial_3U \partial_2\alpha -ac\partial_3\gamma \partial_2\alpha\nonumber\\ &\quad =\frac{b}{R}\partial_j\partial_j\beta+\frac{1}{R}\partial_3\partial_3U+\frac{c}{R}\partial_3\partial_3\gamma+Ro\,a\partial_2\alpha, \end{align}
and plugging (B1) into (3.8) leads to (3.11). Next, we repeat step four using the same ansatz in (3.12) for  $\alpha$ and
 $\beta$ and the following ansatz for
 $\gamma$:
 \begin{equation} \gamma={-}\sin({\rm \pi} z). \end{equation}
Repeating step five and projecting (B2) onto  $\beta$ and
 $\gamma$ leads to
 \begin{equation} \left.\begin{gathered} \frac{\textrm{d}b}{\textrm{d}t}= \left[\frac{4k}{9}Ro+\frac{0.14{\rm \pi} k}{3}\right]a -\left(k^2+\frac{4}{3}\right)\frac{1}{R}\left(\frac{\rm \pi}{2}\right)^2b +\frac{4{\rm \pi} k}{45}ac,\\ \frac{\textrm{d}c}{\textrm{d}t}={-}\frac{{\rm \pi}^2}{R}c-\frac{2{\rm \pi} k}{15}ab. \end{gathered}\right\}\end{equation}
Projecting (3.11) onto  $\alpha$ leads to (3.15). Equations (B4) and (3.15) govern the roll cell dynamics. The ordinary differential equations in (B4) and (3.15), however, have the same non-trivial node as (3.14) and (3.15) with
 $c=0$ (keeping the leading-order term in the
 $c$ equation).
Appendix C. Data-based ansatz for roll cells
In this appendix, we use the DNS solution as our ansatz.
Figures 13(a) and 13(b) show one pair of rescaled roll cells in  $R2$ and
 $R3$, respectively, at
 $Ro=0.2$ and
 $Re_w=1300$. We see from figure 13 that, after rescaling, the DNS solutions for
 $R2$ and
 $R3$ are very similar. This further justifies the use of (3.12) for both
 $R2$ and
 $R3$ in the main part of the paper. The following calculation will use the roll cell solution in
 $R2$.
(a) One pair of roll cells in  $R2$ and (b) one pair of roll cells in
 $R3$ at
 $Ro=0.2$ and
 $Re_w=1300$. Legends are the same as in figure 1. The
 $y$ axis is scaled such that
 $ky$ is from 0 to
 $4$. Again, the exact value of the contour is not relevant.

The velocities  $u$,
 $v$ and
 $w$ in
 $R2$ are related to the ansatz as follows:
 \begin{equation} u\sim \beta,\quad v\sim \partial_z\alpha,\quad w\sim{-}(2/{\rm \pi})\partial_{ky}\alpha. \end{equation}
Repeating step five and plugging  $\alpha$ and
 $\beta$ into (3.10) and (3.11) and projecting (3.10) and (3.11) on
 $\alpha$ and
 $\beta$, we have
 \begin{equation} \left.\begin{gathered} \frac{\textrm{d}b}{\textrm{d}t}=(0.15+0.85\,Ro)ka-{(7.4k^2+14)}\frac{b}{R},\\ \frac{\textrm{d}a}{\textrm{d}t}={-}\frac{1}{R}(2.4k^2+2.4)-\frac{0.31k}{k^2+1}Ro\,b. \end{gathered}\right\}\end{equation}
Taking fourth-order derivative, e.g.  $\partial _2^4$,
 $\partial _3^4$, lends the solution near the domain boundaries to significant numerical errors. To avoid such errors, all integrations are limited to wall-normal regions outside the viscous sublayer. In arriving at (C2), we have also neglected terms that are significantly smaller than the retained ones.
The presence of multiple states requires (C2) to have two or more non-trivial nodes, which in turn requires the following cubic equation of  $k^2$ to have two physically viable roots:
 \begin{equation} {(k^2+1)^2(k^2+14/7.8)}-Ck^2=0. \end{equation}
Figure 14 shows the bifurcation diagram, which leads to the same conclusions.
Bifurcation diagram of the system in (C2).

Appendix D. Shell model
The shell model of energy cascades in an isotropic turbulent flow reads
 \begin{equation} \left(\frac{\textrm{d}}{\textrm{d}t}+\nu k^2_n\right)u_n=i\left(k_nu_{n+2}^*u_{n+1}^*- bk_{n-1}u_{n+1}^*u_{n-1}^*-ck_{n-2}u_{n-1}^*u_{n-2}^*\right)+\,f_n. \end{equation}
It models the time evolution of a velocity fluctuation  $u_n(t)$ over a wavelength
 $k_n=k_0\lambda ^n$, with
 $\lambda$, the intershell ratio, usually set to 2. The nonlinear coupling conserves the energy with
 $b=1/2$ and
 $c=-(1-b)$. A equilibrium condition is obtained by forcing the flow at the large scale, i.e.
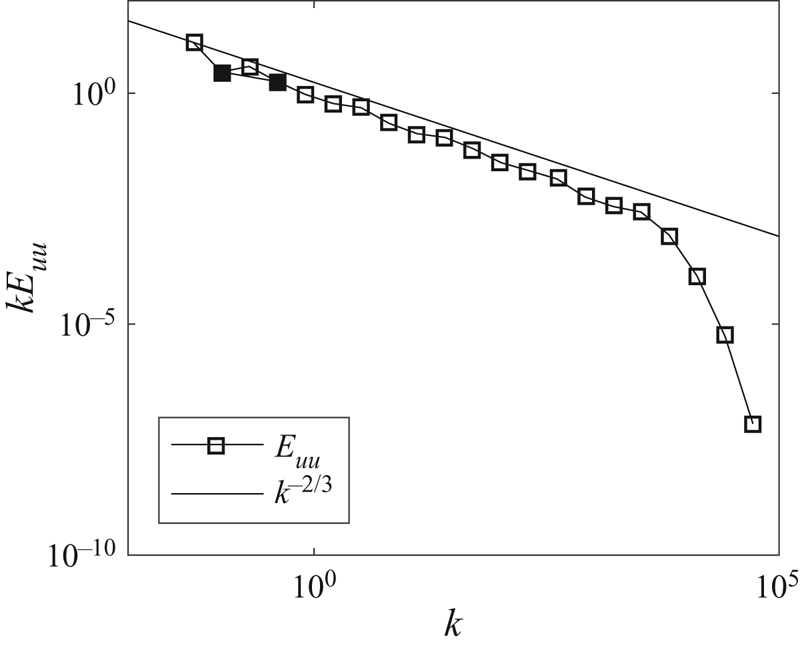
 $f_n=\delta _{1n}$. Despite its simple form, the shell model yields flow statistics that are nearly identical to those from an isotropic turbulent flow. Further details of the shell model can be found in the review by Biferale (Reference Biferale2003). The trajectory in figure 5(b) is a plot in the phase space of
 $|u_2|$ and
 $|u_4|$. For our calculation, the number of shells is
 $N=21$, the wavenumber of the first shell is
 $k_1=0.05$, the molecular viscosity is
 $\nu =5\times 10^{-6}$ and the forcing term is
 $f_1=0.1(1+1j)$. Figure 15 shows the premultiplied shell model energy spectrum,
 $kE_{uu}$. We see that
 $kE_{uu}$ follows
 $k^{-2/3}$ closely.
Premultiplied shell model energy spectrum. The second and the fourth modes, whose trajectory is plotted in figure 5, are coloured black.