Introduction
Human unilateral nasal airflow often exhibits spontaneous changes over a period of hours that are frequently reciprocal in nature and termed a ‘nasal cycle’.Reference Kayser1–Reference Stoksted3 The term ‘nasal cycle’ may be misleading as many subjects do not exhibit a ‘classic’ nasal cycle,Reference Gilbert and Rosenwasser4–Reference Tatar and Atlas7 but reciprocal changes between right and left nasal airflow are a common finding.
The reciprocal changes in nasal airflow associated with the nasal cycle are controlled mainly by the sympathetic nerve supply to the nose, which causes decongestion of the large venous sinuses in the nasal epithelium.Reference Hanif, Jawad and Eccles8 Blockade or section of these peripheral sympathetic nerves has been shown to abolish the nasal cycle in humans and domestic pigs.Reference Stoksted and Thomsen9, Reference Eccles10
The spontaneous changes in sympathetic activity are proposed to be mainly controlled by centres in the brain rather than the effects of nasal airflow, as the nasal cycle persists in the absence of nasal airflow after laryngectomy.Reference Fisher, Liu and Lung11, Reference Fisher, Liu and Lund12 It has been suggested that the hypothalamus controls the spontaneous changes in sympathetic activity and nasal airflow. Electrical stimulation of the hypothalamus in the cat was shown to cause bilateral nasal vasoconstrictor responses.Reference Eccles and Lee13 Hypothalamic control of the nasal cycle in humans is supported by reports that in hypothalamic disorders such as Kallmann's syndrome no nasal cycle is present.Reference Galioto, Mevio, Galioto, Fornasari, Cisternino and Fraietta14
It has been proposed that the reciprocal nature of nasal airflow is controlled by left and right oscillators (half centres) located in the respiratory areas of the brainstem reticular formation, and these oscillators drive the sympathetic outflow to the nasal blood vessels that regulate nasal airway resistance.Reference Eccles15, Reference Eccles16
There is much variation in the spontaneous changes in human unilateral nasal airflow, with some subjects exhibiting in-phase changes in unilateral airflow and some exhibiting reciprocal changes.Reference Gilbert and Rosenwasser4, Reference Tatar and Atlas7, Reference Flanagan and Eccles17 When the changes in unilateral airflow are described in terms of a correlation coefficient ‘r’, with a value of +1 indicating in-phase changes and −1 indicating reciprocal changes in nasal airflow, a range of approximately 0.8 to −0.8 has been reported in healthy subjects. However, the majority of subjects exhibit reciprocal changes in unilateral airflow with negative correlation coefficients.Reference Gilbert and Rosenwasser4, Reference Flanagan and Eccles17 A recent study on the stability of the nasal cycle over a three-month period in healthy subjects reported that the pattern of airflow changes may transform from one type to another over this time period, suggesting that the airflow pattern is not stable in any individual, and may be influenced by external factors such as exercise and infection.Reference Tatar and Atlas7
The present study aimed to determine the pattern of unilateral changes in nasal airflow (described in terms of a correlation coefficient (r)) over a period of approximately one week, in a group of healthy human subjects, in order to better understand any central mechanism that controls human nasal airflow. A model for the central control of human nasal airflow was developed to explain the observed types of nasal cycle.
Materials and methods
Subjects were recruited by poster and e-mail advertisements around the university campus, seeking out normal healthy volunteers. The aim was to recruit 30 volunteers who would complete the protocol.
Inclusion and exclusion criteria
The inclusion criteria were: age of 18 years or over and provision of written informed consent. The exclusion criteria were: any history of chronic nasal conditions; active nasal disease (e.g. current upper respiratory tract infection or allergic rhinitis); any history of trauma to the nose or sinuses; any significant nasal septal abnormality; presence of upper lip facial hair that may interfere with the measurement of nasal resistance; known allergy to surgical tape or rubber; any disease, or medical or surgical history, that the investigator deemed may affect nasal physiology and influence the results of the study (e.g. chronic respiratory disease or the intake of medicines known to affect the nose such as topical corticosteroids); daily usage of tobacco; and intake of more than 4 units of alcohol within 12 hours of nasal airflow measurement.
Study procedure
Subjects were screened for entry criteria. Suitable subjects were trained in the technique of active anterior rhinomanometry and asked to return to the centre on a convenient day.
On study day 1, the subjects arrived at the centre at 09.00 hours. They rested from 09.00 until 09.30; the first measurements of left and right nasal resistance commenced at approximately 09.30. Measurements were taken every hour until 16.30. Subjects were asked to refrain from smoking and eating any menthol-containing products such as mints, and only to consume the food and drink provided by study staff. All subjects received a standard meal of a sandwich, crisps and chocolate bar between 12.00 and 13.00 hours, and were given water to drink as required. Subjects were asked to remain within the laboratory environment during the day, and to refrain from exercise, sleep or lying down.
After the completion of day 1, the subjects were asked to return to the centre 6–9 days later (study day 2) and the same procedures were carried out as on day 1. If for some reason a subject could not return within the 6–9-days period for measurements on study day 2, they were asked to return on the nearest convenient day.
Nasal resistance measurement
Nasal resistance was measured by active anterior rhinomanometry. Surgical tape was used to attach a pressure-sensing tube and seal one nasal passage. Airflow was measured from the other free nasal passage by means of a face mask and flow head.Reference Eccles18 Nasal resistance to airflow was measured as inspiratory nasal airflow (millilitres per second) at a fixed pressure of 75 Pa; this was measured using the Otopront® Rhino-Sys rhinomanometer.
Two measurements were performed for each data point of nasal resistance and the coefficient of variation was calculated; if this was greater than 15 per cent, the measurement was repeated up to four times or until the coefficient of variation of two consecutive measurements was less than 15 per cent.
The results are expressed as nasal airflow at a fixed pressure of 75 Pa. A sample pressure of 75 Pa was used in this study because all the subjects were healthy and free of nasal disease. Because of the relatively low nasal resistance in this population, it was thought that it would be difficult for some subjects to achieve a sample pressure of 150 Pa. This is in agreement with the sample pressure of 75 Pa recommended by the consensus report on rhinomanometry published in 2005.Reference Clement and Gordts19
Statistics
The pattern of nasal airflow for each subject on days 1 and 2 was expressed as a Pearson's correlation coefficient r, where a value of +1.0 indicated a direct correlation of left and right nasal airflow with in-phase changes, and a correlation coefficient of –1.0 indicated an inverse or reciprocal correlation of left and right nasal airflow. Differences between the mean correlation coefficients for day 1 and day 2 were tested by means of a paired student's t-test. The relationship between the change in correlation coefficient between days 1 and 2 and the correlation coefficient on day 1 was calculated by means of a scatter graph and Pearson's correlation coefficient.
Ethics approval
The authors assert that all procedures contributing to this work complied with the ethical standards of the relevant national and institutional guidelines on human experimentation, and with the Helsinki Declaration of 1975 (as revised in 2008). This study was approved by the Cardiff University School of Biosciences Ethics Committee (application 1014-7).
Results
Thirty-nine subjects were initially recruited to the study. Of the 30 subjects who completed the study, 13 were male and 17 were female, with a mean age of 22.7 years (range, 19–66 years). The mean period between the study day 1 and study day 2 measurements was 7.6 days, with a range of 6–21 days. Complete data were available for day 1 and day 2 for 29 subjects; 1 subject only provided 6 out of 8 data points on day 2. The incomplete data for this subject are included in the correlation analysis of nasal airflow.
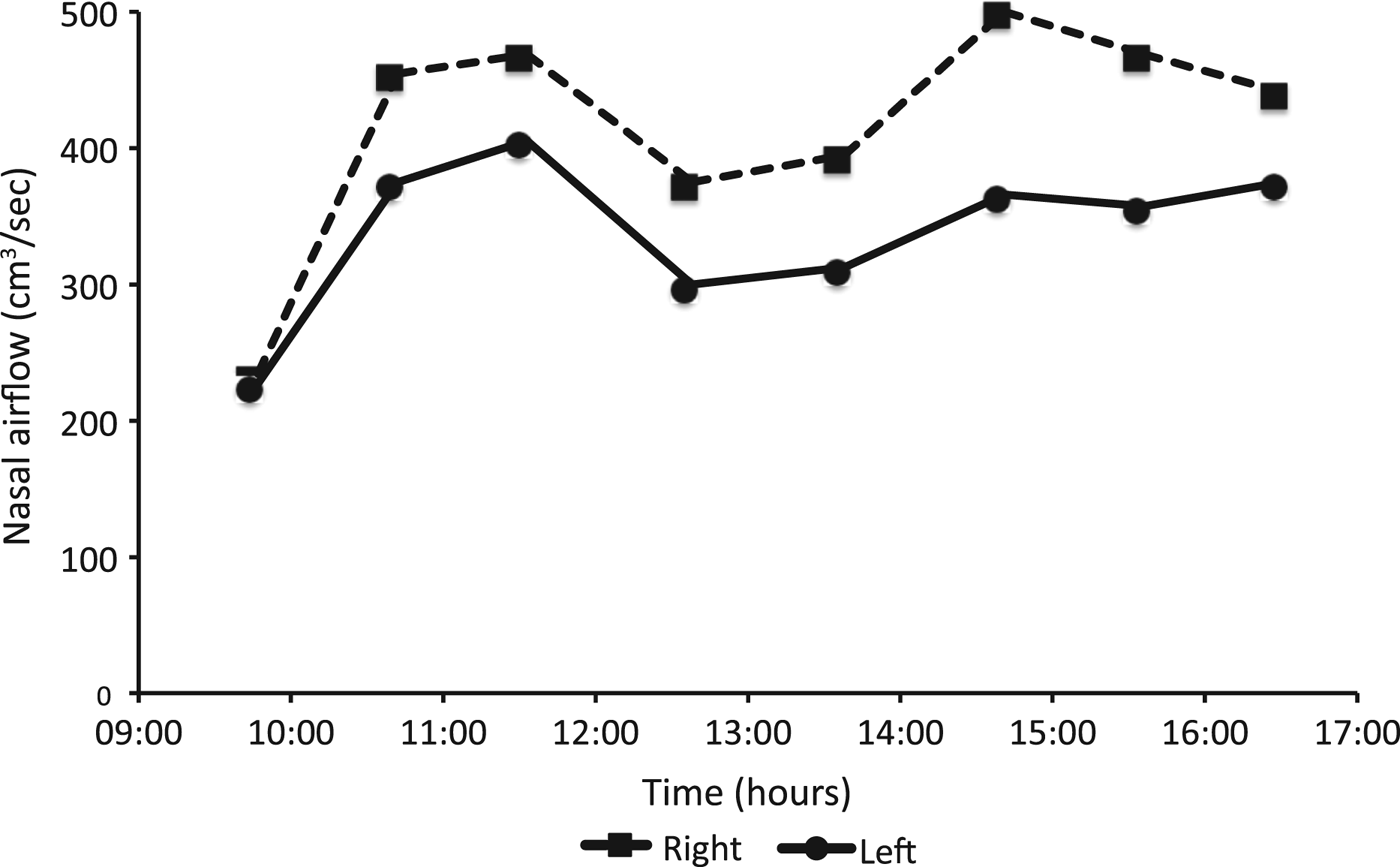
The relationship between left and right nasal airflow varied greatly between subjects, but the majority exhibited some reciprocal relationship between right and left nasal airflow. The extremes of the airflow patterns are illustrated in Figures 1 and 2. Figure 1 graphs the changes in unilateral nasal airflow over the 7-hour study period on day 1 in subject number 19, who exhibited in-phase changes in unilateral nasal airflow (correlation coefficient r = 0.97). Figure 2 graphs the changes in unilateral nasal airflow for the same subject (number 19), on study day 2, when the pattern of changes in nasal airflow exhibited a reciprocal relationship (correlation coefficient r = −0.57). The mean r value for all day 1 changes in airflow was −0.32 (range, −0.89 to 0.97) and the mean r value for all day 2 changes in airflow was −0.47 (range, −0.9 to 0.5); there was no significant difference between these r values (p = 0.06).
Changes in right and left nasal airflow recorded in subject 19 on day 1 of the study. The pattern of changes in nasal airflow shows a direct in-phase relationship with a correlation coefficient of r = 0.97.

Changes in right and left nasal airflow recorded in subject 19 on day 2 of the study. The pattern of changes in nasal airflow shows a reciprocal relationship with a correlation coefficient of r = −0.57.
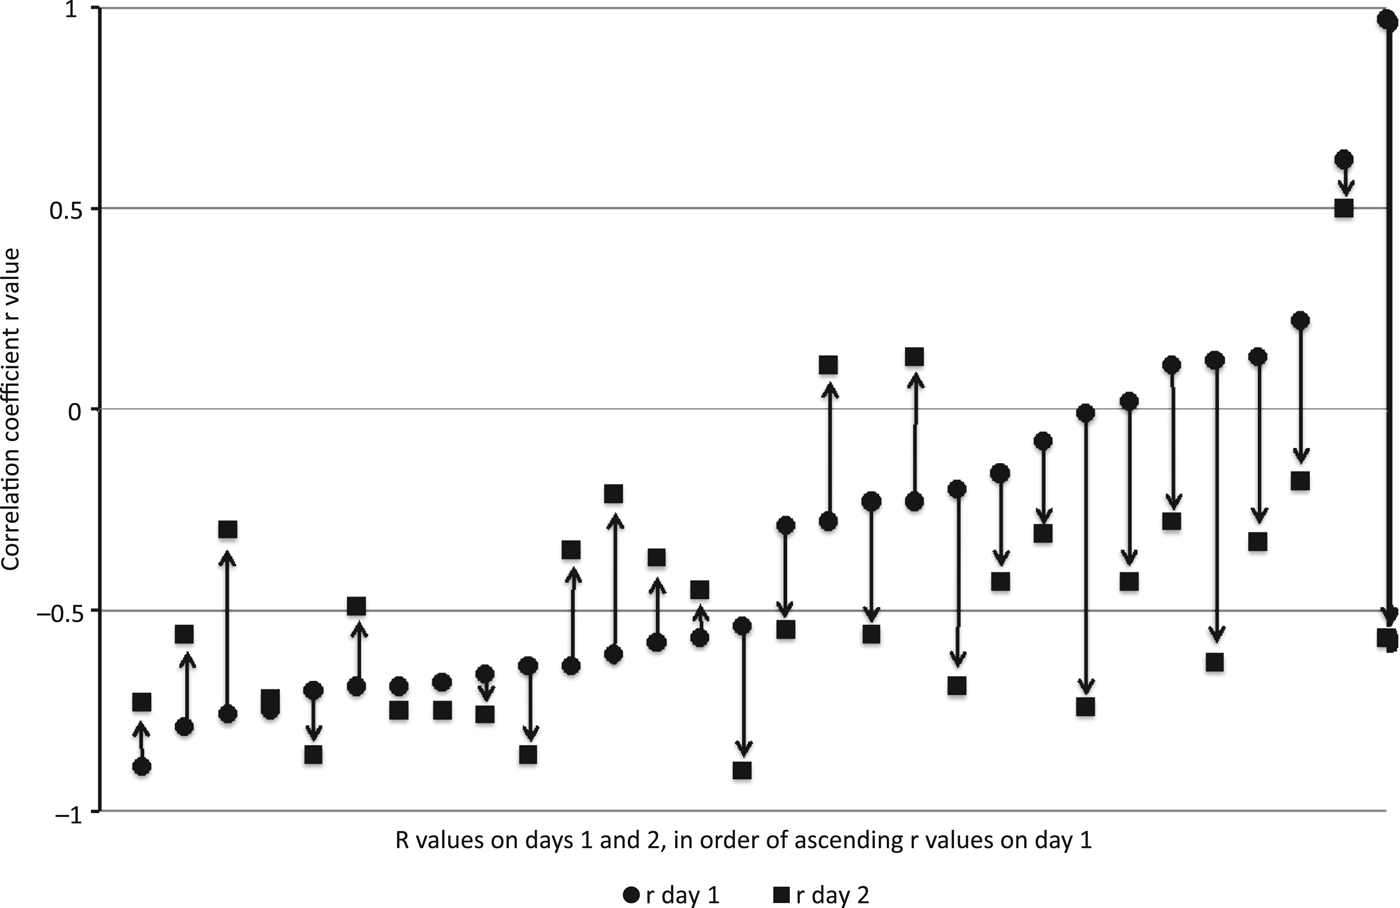
Figure 3 illustrates all the r values for nasal airflow for day 1 and day 2 for all subjects, plotted in ascending order of r value for day 1, from the largest negative value to the largest positive value of r on day 1. The figure clearly illustrates that the majority of r values for day 1 and day 2 (50 out of 60) are negative (as the majority of points on the graph are below the mid x-axis zero point for r), indicating reciprocal changes in unilateral airflow. Figure 3 also illustrates that the change in r value from day 1 to day 2 is smallest for the high negative values of r; the magnitude of change in r value gradually increases as the r value becomes less negative and moves into a positive r value. For all day 1 r values plotted between −0.2 and 0.97 (11 in total), the day 2 r value is more negative i.e. there is a shift towards a greater reciprocity of nasal airflow between day 1 and day 2. This is most apparent for the subject with the highest r value on day 1 (subject 19), where the r value changed from 0.97 on day 1 to −0.57 on day 2, as illustrated in Figures 1 and 2.
Correlation coefficient r values for nasal airflow on day 1 and day 2, plotted in ascending order of correlation coefficient for day 1. When r had a high negative value on day 1 (reciprocal airflow), there was little change in r values between day 1 and day 2, but when r had a positive value on day 1 (in-phase airflow) there was a tendency for the r value to become more negative on day 2. The majority of r values for both day 1 and day 2 are negative (showing reciprocal airflow).
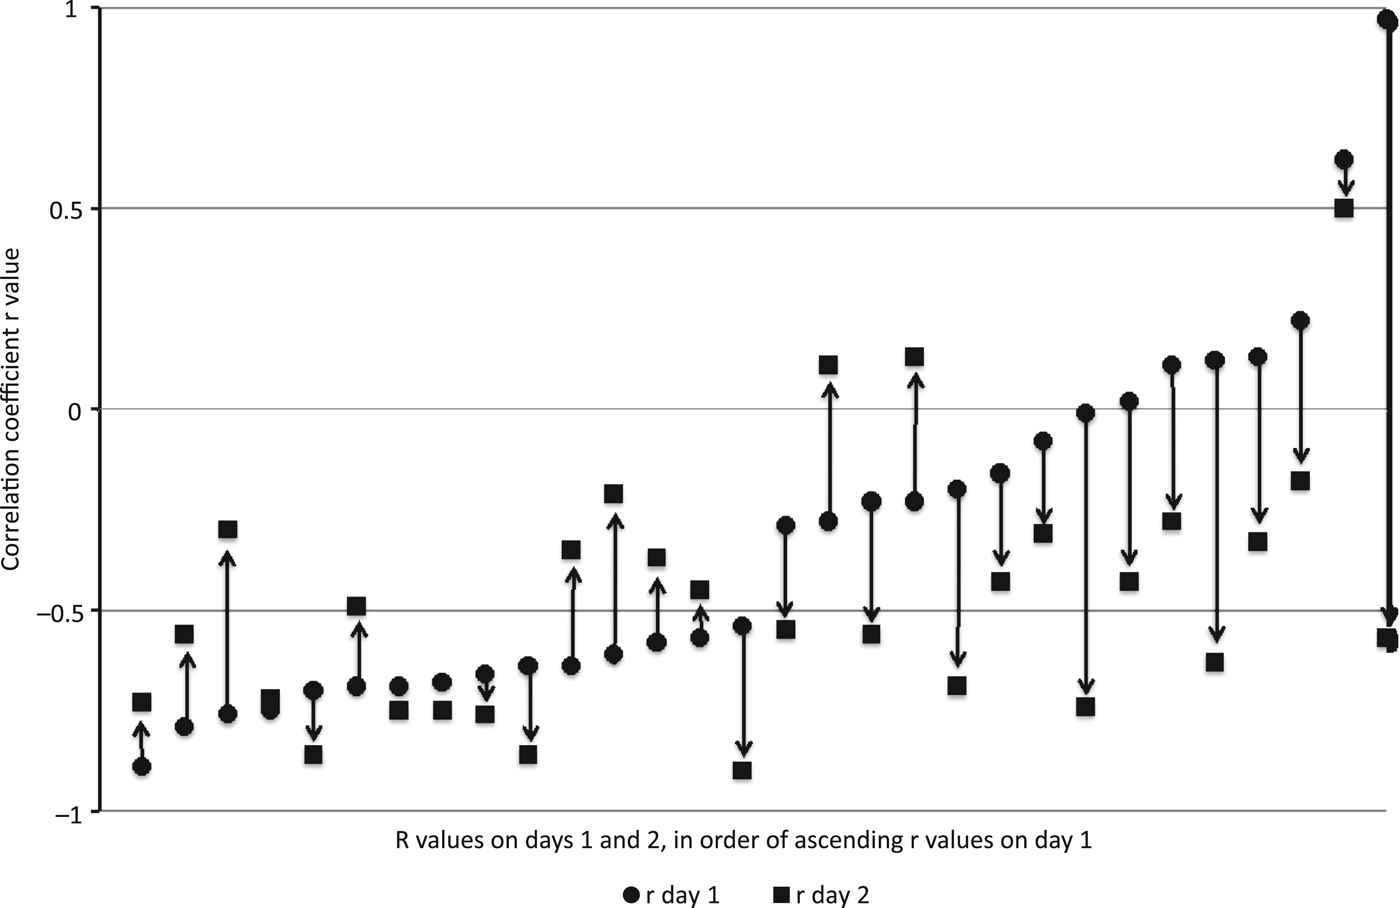
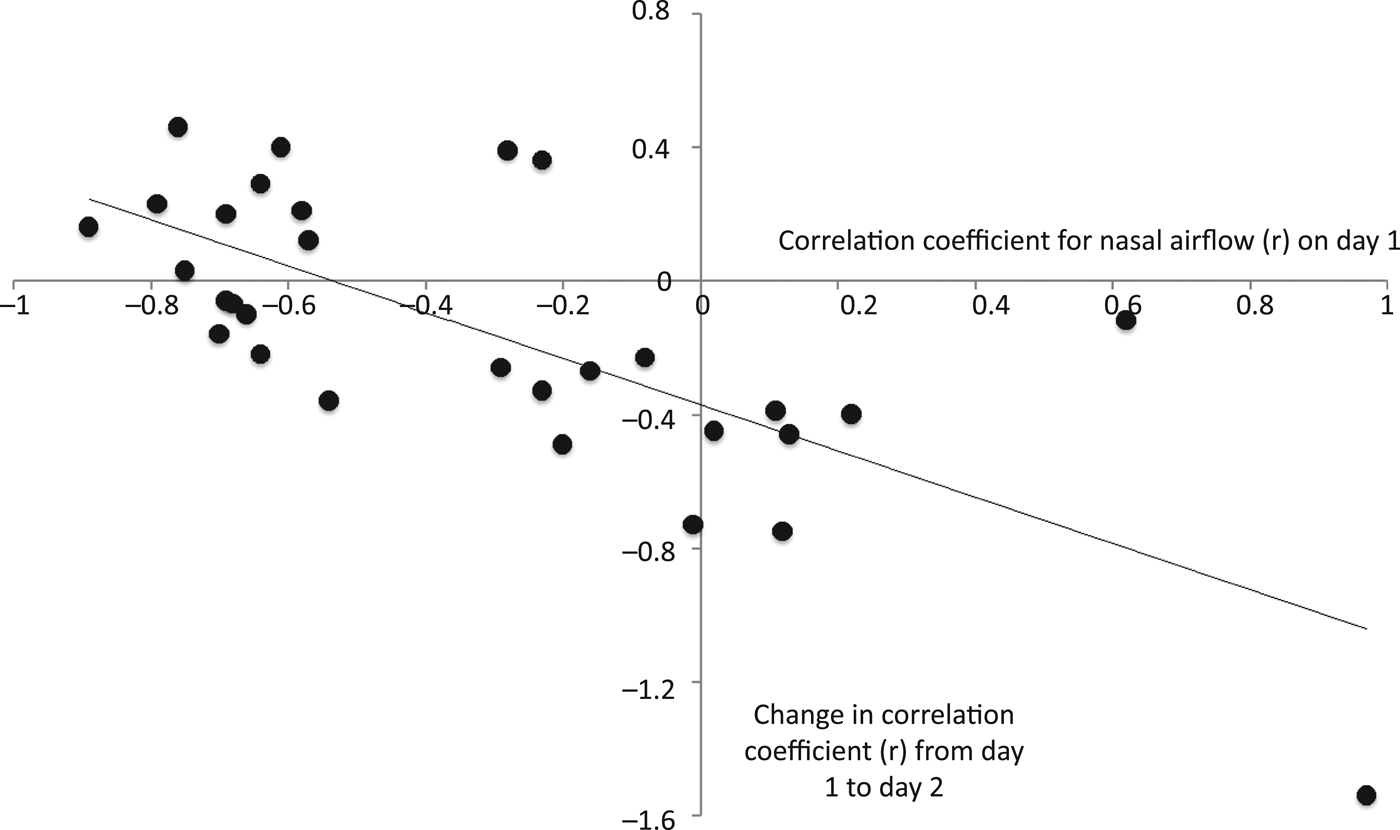
Figure 3 illustrates a relationship between the correlation coefficients for nasal airflow on day 1 and its tendency to change on day 2. Highly negative correlation coefficients for nasal airflow changed little between day 1 and day 2, and were relatively stable. In contrast, the correlation coefficients for nasal airflow with a high positive value tended to become more negative on day 2. Hence, nasal airflow was more likely to exhibit a reciprocal relationship with a negative correlation coefficient. This relationship is clearly apparent in Figure 4, which plots the absolute change in the correlation coefficients for nasal airflow (r) between day 1 and day 2 against the correlation coefficients for nasal airflow on day 1.
Absolute change in correlation coefficient (r) between day 1 and day 2, plotted against correlation coefficient (r) on day 1. The scatter plot shows a direct correlation of r = −0.73 (p < 0.001). When the two outliers are removed, the correlation still holds at r = −0.68.
Figure 4 illustrates the relationship between r values for nasal airflow on day 1 and changes in r values for nasal airflow between day 1 and day 2. This correlation, which is also given as a correlation coefficient ‘r’, should not be confused with the ‘r’ values used to measure the relationships between right and left nasal airflow in Figure 3. Figure 4 shows that there is a direct relationship between the day 1 correlation coefficients for nasal airflow and the change in correlation coefficients for nasal airflow between day 1 and day 2, with a correlation coefficient for this relationship of r = −0.73 (p < 0.001). The correlation is still maintained at r = −0.68 even when the two outliers are removed from the analysis, indicating that this is a robust correlation.
Discussion
Nasal airflow in humans and other mammals (such as the domestic pig, rat, rabbit and dog) often exhibits a reciprocal relationship between the two nasal passages.Reference Stoksted3, Reference Eccles10, Reference Bojsen-Moller and Fahrenkrug20, Reference Webber, Jeffcoat, Harman and Ruttimann21 The control of nasal vasomotor activity occurs even in the absence of nasal airflow (as demonstrated in patients after laryngectomy), and the origin of the cyclical activity is proposed to originate in the central nervous system.Reference Fisher, Liu and Lung11 The reciprocal control of nasal airflow has been proposed to originate from centres in the brainstem.Reference Eccles15, Reference Eccles16 Speculation about the brainstem site of these control centres is supported by data from studies on the anaesthetised cat: electrical stimulation of brainstem areas elicited reciprocal nasal vasomotor responses, and it was possible to flip/flop the responses from side to side by alternating left and right side stimulation of the brainstem reticular formation.Reference Bamford and Eccles22
The results of the present study demonstrate that spontaneous changes in human nasal airflow are mainly reciprocal in nature. Furthermore, there is a tendency for some stability of this relationship, as measured by the correlation coefficient of left and right unilateral nasal airflow (r). The mainly reciprocal nature of changes in human nasal airflow (as measured by correlation) has been reported in the literature previously, and this study supports that knowledge.Reference Gilbert and Rosenwasser4, Reference Flanagan and Eccles17 Gilbert and Rosenwasser reported that 12 out of 16 subjects had nasal cycles with a negative correlation coefficient, with r ranging from −0.87 to 0.32.Reference Gilbert and Rosenwasser4 In addition, Flanagan and Eccles reported 36 out of 52 subjects with a negative correlation coefficient, with r ranging from approximately −0.9 to 0.7.Reference Flanagan and Eccles17
When the overall mean changes in correlation coefficient between day 1 and day 2 were compared, there was no significant difference between the study days (p = 0.06). This may be explained by the fact that there was little or no change in r for those subjects with reciprocal changes in nasal airflow on day 1 (negative correlation coefficients), and r tended to be more negative on day 2 only in those subjects with positive or close to zero values of r, as seen in Figure 3.
The new knowledge provided by the current study is that between study day 1 and day 2 (mean, 7.6 days), there was a tendency for maintenance of reciprocal changes in nasal airflow; those subjects with highly reciprocal changes in nasal airflow (highly negative r values) tended to maintain a reciprocal pattern, whereas those subjects with in-phase or low negative values for correlation tended to have more reciprocal changes in nasal airflow on study day 2 (more negative r values). The stability of the reciprocal nature of nasal airflow is apparent in Figure 3 and is supported by the correlation seen in Figure 4. It is a robust relationship, with a strong direct correlation between the reciprocal nature of nasal airflow and the changes observed between study day 1 and day 2 (r = −0.73, p < 0.001). Even when the two outliers in Figure 4 are removed from the analysis, the correlation is still maintained (r = −0.68).
The results from the current study may be explained by means of a control diagram for the nasal cycle, as illustrated in Figure 5. The central rhythm of the spontaneous changes in nasal airflow (or nasal cycle) is proposed to originate from an oscillator in the hypothalamus, and reciprocal changes in nasal airflow are proposed to be controlled from two half-centre oscillators in the brainstem. The hypothalamic oscillator causes bilateral and symmetrical increases and decreases in sympathetic activity, but this is superimposed on any asymmetry in the brain stem oscillators. This element of the model is based on the knowledge that electrical stimulation of the hypothalamus in the anaesthetised cat causes nasal vasoconstriction, but does not elicit any reciprocal changes in nasal sympathetic activity.Reference Eccles and Lee13
Model to explain the central control of the nasal cycle. The model consists of a hypothalamic oscillator that generates bilateral in-phase oscillations in sympathetic tone, and brainstem half-centre oscillators that generate reciprocal changes in sympathetic tone. In-phase changes in nasal airflow are shown on the left side of the figure where the hypothalamic oscillators dominate, and although the brainstem oscillators exhibit asymmetry of tone there is no reciprocal pattern present. Reciprocal changes in nasal airflow are shown on the right side of the figure where the hypothalamic tone is weak and the brainstem oscillators dominate the sympathetic tone and exhibit reciprocal changes. (See text for further explanation of model.) –ve = negative; +ve = positive
When the changes in nasal airflow are in phase (as shown on the left control diagram in Figure 5), it is proposed that the dominant control of the nasal cycle is from the hypothalamus. The hypothalamic oscillator drives the brainstem oscillators in phase. The brainstem oscillators have asymmetrical activity, but the reciprocal connections between them are not sufficiently active to cause any flip/flop of dominance of left and right sympathetic outflow, and airflow changes are in phase. When the changes in nasal airflow are reciprocal (as shown on the right control diagram in Figure 5), the central rhythm of the nasal cycle still originates from the hypothalamus, but the reciprocal activity between the brainstem oscillators is strong enough to cause a flip/flop of sympathetic outflow, so that the nasal airflow changes are reciprocal in nature.
In summary, the hypothalamus drives the central rhythm of the nasal cycle, and the brainstem oscillators are responsible for any asymmetry and reciprocal changes of sympathetic activity (and therefore airflow). The generation of reciprocal changes in nasal sympathetic activity is supported by the knowledge that electrical stimulation of the brainstem in the anaesthetised cat causes reciprocal nasal vasomotor responses.Reference Bamford and Eccles22 The control model may explain the predominantly reciprocal nature of the nasal cycle by proposing that under most conditions the brainstem oscillators determine any asymmetry of nasal airflow because of their reciprocal connections.
The predominance of reciprocal changes in airflow on study day 2 compared to day 1 may be related to a change in hypothalamic activity, as the subjects may have been more anxious during day 1 of the study, as they were unfamiliar with the centre and procedures. A week or more later, on day 2, the subjects were more familiar with the routine and were more relaxed. Future studies with psychological measures of anxiety could determine whether there is any link between mood and anxiety and the nature of nasal airflow changes.
• The nasal cycle is variable, but in most there is a reciprocal relationship between right and left nasal airflow
• The nasal cycle may be studied and classified by calculation of the correlation coefficient ‘r’ between right and left airflow
• This study measured the correlation coefficient ‘r’ of the nasal cycle on two occasions (around one week apart) to develop a nasal cycle central control model
• Most subjects exhibited reciprocal changes in nasal airflow with a negative correlation coefficient ‘r’
• The ‘r’ values tended to become more negative at the second measurement
• A control model involving a hypothalamic centre and two brainstem half centres is proposed to explain the study results
The control model for the nasal cycle proposed in this study is put forward as a hypothesis to explain the data obtained in the study, and from the limited knowledge that exists regarding central control of the nasal cycle. Future knowledge in this area may support or refute the model hypothesis.
Acknowledgements
This study was supported by research funds from Cardiff University. The authors would like to thank Happersberger Otopront (Breithardt, Germany) for the generous loan of the Rhino-Sys rhinometry system used for the current study.