Introduction
The Nilagiri sheep, native to the Nilagiri hills of Tamil Nadu is known for its adaptability to high altitude. They are usually maintained in a low-input system for dual utility (fine wool and meat). These Sheep have been maintained over centuries in the Nilagiri hills. Shortt (Reference Shortt1869) has given an account of sheep being offered for sacrifice by the Toda tribes of the Nilgiris. Littlewood (Reference Littlewood1936) was perhaps the first to describe the sheep of Nilgiris with good-quality wool. The breed has been used along with Merino, in the development of another synthetic wool breed named Sandyno, which has better wool quality. The Nilagiri sheep are able to withstand wide climatic variations (frost during winter and high wind velocity and humidity during monsoons) prevalent in the region. The population was reported as 8 000 by Ganesakale and Rathnasabapathy (Reference Ganesakale and Rathnasabapathy1973). At present, the breed is endangered, with numbers less than one thousand (Report, 2008; personal survey), warranting immediate action towards conservation (Bhatia and Arora, Reference Bhatia and Arora2005). The Sheep Breeding Research Station (SBRS), Sandynallah, which has been maintaining the breed for over 40 years has about 50 percent of the current population of Nilagiri sheep. A Government of India scheme on “Conservation of Threatened Breeds” for enumeration, in situ conservation, health care and provision of feed supplements, is functioning at SBRS.
Pedigree analysis is an important tool to describe genetic variability and its evolution across generation. Computation of effective population size (Falconer and Mackay, Reference Falconer and Mackay1996) is a key not only to understand the genetic diversity, but also for further prognosis in terms of conservation. Another important goal in conservation of endangered breeds is to restrain the rate of inbreeding. Several studies in sheep report a reduction in reproduction, growth and wool production due to inbreeding depression (Lamberson, Thomas and Rowe, Reference Lamberson, Thomas and Rowe1982; Ercanbrack and Knight, Reference Ercanbrack and Knight1991; Mandal et al., Reference Mandal, Pant, Notter, Rout, Roy, Sinha and Sharma2005). An increase in inbreeding is directly related to decrease in heterozygosity for a given locus in a closed, panmictic population of finite size (Wright, Reference Wright1931). Additionally, in the case of domestic livestock population, founder equivalents (Lacy, Reference Lacy1989) and f a (Boichard, Maignel and Verrier, Reference Boichard, Maignel and Verrier1997) provide complementary information to inbreeding parameters (Gutiérrez et al., Reference Gutiérrez, Altarriba, Díaz, Quintanilla, Cañón and Piedrafita2003).
While efforts are being made to conserve the Nilagiri sheep, it is appropriate to understand the genetic structure of the population through pedigree analysis. Management methods based on pedigree analysis (Goyache et al., Reference Goyache, Gutiérrez, Fernández, Gómez, Álvarez, Díez and Royo2003; Gutiérrez and Goyache, Reference Gutiérrez and Goyache2005; Gutiérrez et al., Reference Gutiérrez, Cervantes, Molina, Valera and Goyache2008; Gutiérrez, Cervantes and Goyache, Reference Gutiérrez, Cervantes and Goyache2009) can act as a tool for preventing the breeds from extinction. In this study, the generation interval (GI), pedigree completeness level, inbreeding coefficient (F), average relatedness (AR), effective population size (N e), Genetic Conservation Index (GCI), and effective number of founders (f e) and ancestors (f a) were calculated from pedigree information to evaluate the current status of the breed with respect to genetic variability.
Materials and methods
With the total population of Nilagiri sheep being less than one thousand, a major proportion of the population is being maintained at SBRS. The flock has been closed with no introduction of animal from outside, after 1990 for more than 20 years and selection was practiced for 6 months body weight. Selected rams were usually removed after three seasons of breeding. Data on 5051 Nilagiri sheep maintained at SBRS were utilized for the study. Pedigree information collected included unique identification of animal, sire and dam, date of birth, and sex. Records available for 48 years (from 1965 up to 2012) were utilized for the study.
GI was studied as the average age of parents when their progeny used for breeding were born. It was calculated along the four gametic pathways; father to son, father to daughter, daughter to son, and daughter to daughter. The evolution of this parameter was studied as per Gutiérrez et al. (Reference Gutiérrez, Altarriba, Díaz, Quintanilla, Cañón and Piedrafita2003). The reference population for GI was taken as those animals who were parents during the four years (from 2008 to 2011) previous to the last year of analysis. A period of 4 years was preferred keeping in mind the average GI for sheep. To study evolution, GIs for another sample of animals born in a block of four consecutive years from 1988 to 1991 were computed.
The reference population for all other parameters included animals with known parents and born during 2009–2011. Data on animals born during 2012 were not complete at the time of study. Pedigree completeness level was studied as the proportion of parents, grandparents and great-grand parents known and complete equivalent number of generations (Boichard, Maignel and Verrier, Reference Boichard, Maignel and Verrier1997). The equivalent number of generations was assessed for each animal (i) in the reference population as follows:
 $$\left({\rm EqG}_i \right)=\left(1/2 \right)^n$$
where “n” is the number of generations separating each known ancestor from the individual.
F values of all the individuals were calculated as in Wright (Reference Wright1923). N e, i.e. the number of breeding individuals that would give rise to the same rate of inbreeding if they contribute equally to the next generation, was calculated as per Wright (Reference Wright1931) as below:
 $$N_{\rm e}=1/2\Delta F$$
Where, ΔF is the rate of inbreeding per generation. The rate of inbreeding was estimated as per as per Gutiérrez et al. (Reference Gutiérrez, Altarriba, Díaz, Quintanilla, Cañón and Piedrafita2003) and Gutiérrez et al. (Reference Gutiérrez, Cervantes, Molina, Valera and Goyache2008) modified by Gutiérrez, Cervantes and Goyache (Reference Gutiérrez, Cervantes and Goyache2009). The later method corrects for variations in depth of pedigree and also allows overlapping generations.
The average relatedness (AR) could be defined as twice the probability that two random alleles, one from the animal and the other from the population in the pedigree (including the animal), are identical by descent and can then be interpreted as the representation of the animal in the whole pedigree regardless of the knowledge of its own pedigree. This was computed as described in Dunner et al. (Reference Dunner, Checa, Gutiérrez, Martín and Canón1998). It is the average of the coefficients in the row corresponding to the individual in the numerator relationship matrix.
The f e, is the number of equally contributing founders that would be expected to produce the same genetic diversity as in the population under study (James et al., Reference James1972; Lacy, Reference Lacy1989). The effective number of founders was calculated as
 $$\,f_{\rm e}={1 \over \sum\nolimits_{k=1}^f {q_k^2 } }$$
where q k is the probability of gene origin of kth ancestor.
f a (Boichard, Maignel and Verrier, Reference Boichard, Maignel and Verrier1997) was studied for the reference population. f a is the minimum number of ancestors, founders or not, necessary to explain the complete genetic diversity of the population under study. f a is less than f e and the comparison of both numbers can be used to find the bottlenecks that have occurred from the founders to the present population (Boichard, Maignel and Verrier, Reference Boichard, Maignel and Verrier1997): the greater the f e/f a ratio, the more stringent the bottlenecks.
GCI (Alderson, Reference Alderson, Alderson and Bodo1992) was calculated for all the individuals in the population under study as the reciprocal of proportion of contribution of all the founders in the pedigree of the animal.
All the analyses were done using the software ENDOG version 4.8 (Gutiérrez and Goyache, Reference Gutiérrez and Goyache2005).
Results and discussion
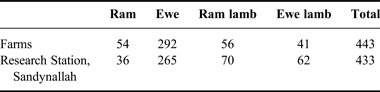
The census for Nilagiri sheep (Table 1) indicate that half the population of the existing animals are maintained in the farm. The population for the breed was 8 000 in 1973 (Ganesakale and Rathnasabapathy, Reference Ganesakale and Rathnasabapathy1973) and has drastically reduced to less than a thousand. Pedigree analysis was done from data available in the station.
Number of Nilagiri sheep enumerated*.

* Nilagiri sheep are exclusive to the Nilagiri hills of Tamil Nadu, India.
Generation interval
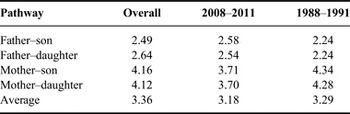
The overall GI and the evolution over periods are presented in Table 2. The mean GI for the whole population was 3.36 years. GI calculated from sire and dam pathways were 2.55 and 4.15 years, respectively. GI decreased from 3.29 years in the earlier reference period to 3.18 year in the last four consecutive years of the study. This could be due to better reproductive management and use of genetic evaluation for decision-making in breeding. A similar trend was noticed by Gutiérrez et al. (Reference Gutiérrez, Altarriba, Díaz, Quintanilla, Cañón and Piedrafita2003) for beef cattle in Spain. However, in the present study, the trend was different in the father pathway, where the GI increased in the recent years. The larger GI could be due to retaining of sires for longer periods. Lower and higher GIs have already been reported for sheep in the literature. Goyache et al. (Reference Goyache, Gutiérrez, Fernández, Gómez, Álvarez, Díez and Royo2003) reported GIs ranging from 2.67 to 2.87 year on the father side and from 3.11 to 3.23 year on the mother side for Xalda sheep (genealogical data of 805 individuals). Li Strandén and Kantanen (Reference Li, Strandén and Kantanen2009) reported GIs for Finnsheep in terms of all possible pathways: father–son 2.96 years, father–daughter 3.15 years, mother–son 2.65 years, mother–daughter 2.49 years. Danchin-Burge et al. (Reference Danchin-Burge, Palhiére, Francois, Bibé, Leroy and Verrier2010) reported a mean GI between 2.9 and 4.1 years for analysed sheep breeds in France. GIs ranging from 2.2 to 4.1 years on the father side and from 3.9 to 5.6 years on the mother side for a closed Merino Rambouillet flock over 50 generations of inbreeding was reported by Prod'homme and Lauvergne (Reference Prod'homme and Lauvergne1993). Oravcova and Krupa (Reference Oravcova and Krupa2011) reported higher values of 4.07 ± 0.157 years for the whole population.
Evolution of generation interval.

Pedigree completeness
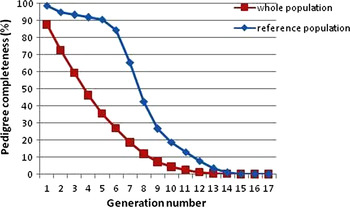
Knowledge on pedigree completeness is important as the inferences drawn on inbreeding and N e depends on it. The decrease in proportion of ancestral knowledge from first to fifth generation was 98.81 to 84.47 and 85.58 to 35.47 percent in the reference and whole pedigree population, respectively (Figure 1).
Percentage of ancestral knowledge for whole and reference populations in Nilagiri sheep.

The percent of ancestor knowledge was balanced, with almost equal proportions for sire and dam pathways, even in the fifth generation. Several other studies have shown pedigrees more shallow and imbalanced than this population. Oravcova and Margetin (Reference Oravcova and Margetin2011) observed a decrease from 100 to 34 percent in the first to fifth generation of the reference population and from 63 to 16 percent in the first to fourth generation of the whole pedigree population for the Former Valachian sheep.
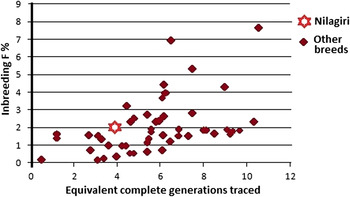
The equivalent complete generation for the reference population was 7.12 compared with 3.75 for the whole population. This was indicative of good depth in pedigree. Values reported in literature for other breeds were 1.09 for whole population of Xalda breed of sheep (Goyache et al., Reference Goyache, Gutiérrez, Fernández, Gómez, Álvarez, Díez and Royo2003), 1.40 and 0.43 for reference population and whole population, respectively, for Mallorquina sheep (Goyache et al., Reference Goyache, Fernandez, Espinosa, Payeras, Perez-Pardal, Gutierrez, Royo and Alvarez2010) and 4.70 and 1.16 for reference population and whole population, respectively, for Former Valachian sheep (Oravcova and Margetin, Reference Oravcova and Margetin2011). Danchin-Burge et al. (Reference Danchin-Burge, Palhiére, Francois, Bibé, Leroy and Verrier2009) reported higher number of equivalent generations (ranging from 4.6 to 10.5) for younger individuals in reference population in sheep breeds of small populations in France. The inbreeding coefficient and equivalent number of generations reported for various sheep breeds has been compared with that obtained for Nilagiri sheep (Figure 4). A balanced ancestral knowledge with higher equivalent complete generation in the present study is indicative of good pedigree depth.
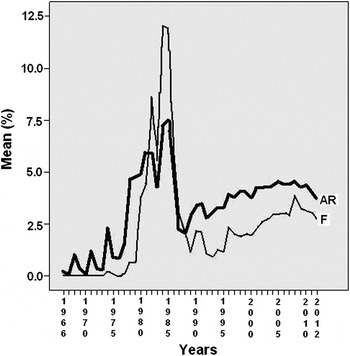
Trends of mean inbreeding (F) and average relatedness (AR) of Nilagiri sheep over years.

Inbreeding coefficient and average relatedness
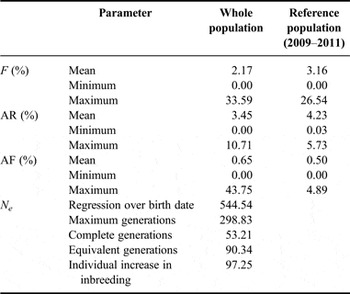
F and AR values for the whole and reference population are presented in Table 3. Previous studies have demonstrated that the completeness of pedigree information has an effect on the estimates for F within a breed (Lutaaya et al., Reference Lutaaya, Misztal, Bertrand and Mabry1999; Cassell, Adamec and Pearson, Reference Cassell, Adamec and Pearson2003). The pedigree completeness and equivalent number of generations for the Nilagiri breed was optimal. The average inbreeding values for the whole and reference population were 2.17 and 3.16 percent, respectively. The inbreeding values were thus well below critical levels. In the whole population, 45 percent were inbred, while 78 percent had inbreeding less than 3.125 percent. The highly inbred matings in the whole population were 159 (3.15 percent) between half sibs and 22 (0.44 percent) between parent-offspring. Similar finding of high mean value of heterozygotes (0.72), which was also indicative of low level of inbreeding, has been reported based on molecular characterization of the Nilagiri breed (Haris Girish et al., Reference Haris, Sivaselvam, Karthickeyan and Saravanan2007).
Inbreeding coefficient (F), average relatedness (AR), individual increase in inbreeding (AF) and effective population size (N e) in whole and reference populations.

The AR (2.45 percent ) was higher than the mean inbreeding and this may be due to the closed nature of the flock and good pedigree depth. Goyache et al. (Reference Goyache, Gutiérrez, Fernández, Gómez, Álvarez, Díez and Royo2003) also observed an AR of 1.8 percent, which was higher than the inbreeding value (1.5 percent) in a small population of Xalda sheep. Very high values of AR up to 15 percent have been found in a small sheep population closed for more than 40 years (Lamberson, Thomas and Rowe, Reference Lamberson, Thomas and Rowe1982; Vanwyk Erasmus and Konstantinov, Reference Vanwyk, Erasmus and Konstantinov1992). Higher AR with lower inbreeding coefficient is indicative of high degree of relatedness between all individuals of the pedigree. This could lead to difficulties, when trying to avoid mating between unrelated or slightly related individuals.
The mean inbreeding (Figure 2) increased over the years and peaked during 1984 (>12 percent), after which, it dipped suddenly (<1.25 percent) in 1989. In the subsequent years, there has been a gradual and fluctuating increase to 2.5 percent for the current population. The sudden dip in inbreeding during 1989 is proportional to the shallowness in pedigree with low equivalent number of generations during 1987. The ancestors without pedigree during the period were purchased from farmers' flock where pedigree records were not available. The offspring analysis also shows lesser number of parents contributing more number of offsprings prior to the peak inbreeding value.
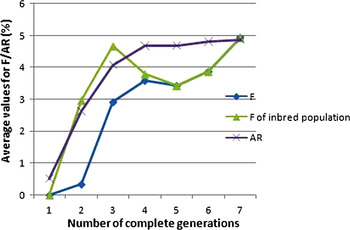
Inbreeding in the whole population, inbred population and average relatedness over complete generations.

In order to distinguish between recent and cumulated inbreeding, the evolution of this parameter per year of birth was also computed, taking into account only the last three generations. Differences between the trend lines result from cumulated inbreeding due to good pedigree depth and uniform breeding management (Gutiérrez et al., Reference Gutiérrez, Altarriba, Díaz, Quintanilla, Cañón and Piedrafita2003). The higher value of average inbreeding in reference population, compared with the whole pedigree, also indicates cumulative inbreeding carried through the deep pedigrees. Gutiérrez et al. (Reference Gutiérrez, Altarriba, Díaz, Quintanilla, Cañón and Piedrafita2003) observed similar results for A-NI breed of cattle in Spain.
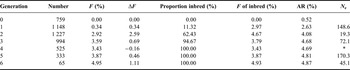
The F value of inbred population and AR per generation are presented in Table 4 and Figure 3. AR is higher than F throughout. After the fourth generation, the percent inbred population becomes 100 percent, where F and mean inbreeding of inbred population becomes the same. According to FAO guidelines and the recommendation by Bijma and Wooliams (Reference Bijma and Wooliams2000), a rate of inbreeding of more than 1 percent per generation should be avoided to maintain fitness in a breed. The rate of inbreeding in the Nilagiri population was more than 2 percent in the second generation and just above 1 percent in the sixth generation (Table 4). Thus, the rate of inbreeding is marginally above the critical level and steps need to be taken to introduce genetic variability. One of the objectives of the conservation scheme described above is to open the flock to breeding animals from farmers' flock. The process of introduction is under progress from 2012.
Average inbreeding and equivalent number of generations reported for other breeds of sheep compared with Nilagiri sheep.

Average inbreeding (F), rate of inbreeding (ΔF), proportion inbred, mean inbreeding of inbred population, average relatedness (AR) and effective population size (N e) over complete generations.

*Negative value for ΔF.
Effective population size
Effective population size estimated from regression on birth dates was 544.54, and that from maximum generations was 298.83. Even though these values are encouraging in terms of genetic diversity, the fluctuations noticed in F value and equivalent generations, and negative values of rate of inbreeding make them the upper limits for “N e”. Figure 3 shows the trend for F and mean inbreeding of population inbred over generations. The negative rate of inbreeding after fourth generation leads to negative values for N e . For these reasons, the method proposed by Gutiérrez et al. (Reference Gutiérrez, Cervantes, Molina, Valera and Goyache2008, Reference Gutiérrez, Cervantes and Goyache2009) using individual increase in inbreeding coefficient (AF) appear to be more suitable to estimate the realized “N e ”, which was computed as 106.82. The 50/500 rule, i.e. a population with N e less than 50 is under immediate threat from inbreeding depression, while a minimum N e of 500 is needed to prevent loss of genetic diversity over centuries, has been used as guidance in conservation schemes (Rieman and Allendorf, Reference Rieman and Allendorf2001). Meuwissen (Reference Meuwissen and Oldenbroek1999) has recommended a critical N e between 50 and 100. The Nilagiri population, though not vulnerable to immediate effects of inbreeding depression, is under threat from loss of adaptive genetic variation. This was also seen from the critical rates of inbreeding. Maiwashe and Blackburn (Reference Maiwashe and Blackburn2010) found a lower N e (92 animals) for Navajo Churro sheep (genealogical data of 2 950 animals) kept in four regions of the USA. Ghafouri-Kesbi (Reference Ghafouri-Kesbi2010) reported the realized N e at 71 animals for a closed population of Zandi sheep, whose reference population consisted of 2 566 animals. Li Strandén and Kantanen (Reference Li, Strandén and Kantanen2009) reported the mean increase in inbreeding at 0.148 percent and the realized N e of 122 animals.
Founders and ancestors
The number of founders and ancestors for the whole and reference population were 759 and 154 and 469 and 154, respectively. The difference between f e and f a allows an evaluation of the extent that the genetic variability available in the founders has been reduced because of bottlenecks between the base population and the reference population (Boichard, Maignel and Verrier, Reference Boichard, Maignel and Verrier1997). In the present study, the difference between f e and f a in the Nilagiri population was not very high. An f e/f a ratio of 1.41 in the Nilagiri population is indicative of absence of stringent bottlenecks. A range of 1.3 to 2.0 was reported by Danchin-Burge et al. (Reference Danchin-Burge, Palhiére, Francois, Bibé, Leroy and Verrier2009) for seven small breeds of France. Oravcova and Krupa (Reference Oravcova and Krupa2011) have reported an f e/f a ratio of 3.1 for the Former Valachian sheep. Very high values have been reported for Roussin de la Hague (11.7) and Charmoise (10.1) breeds of sheep. f a contributing to 50 percent of the population (19) observed for the Nilagiri breed was also comparatively high. Thus, the genetic variability from the founders was not lost due to bottlenecks, unbalanced contribution or loss due to segregation.
Genetic conservation index
The maximum GCI value of an individual in the population was 48.71. The proportion of animals with GCI greater than 10 was 36.74 percent. This could be used as a scale to use such animals with higher GCI to maintain balanced contribution from the founders.
Conclusion
The Nilagiri breed of sheep is known for its adaptability and utility under the typical conditions of the Nilagiri hills. The population has been reduced to less than thousand and this warrants immediate conservative measures. Higher AR, rate of inbreeding greater than 1 percent and lower N e can lead to loss of genetic variability. The breeding plan must be devised to check further inbreeding and loss of genetic variability. Introduction of genetic variability through animals from other farmers' flock is under progress. Less represented animals with lower AR value and better GCI index can be used for breeding. Ex-situ conservation in the form of cryopreservation can be thought of as a long-term plan for preservation of germplasm. Careful monitoring of breeding programme, along with other conservation measures, will help in conserving the breed.
Acknowledgement
The authors thank the Director, Centre for Animal Production Studies, for permitting to utilize the data from SBRS, Sandynallah for this study, which is part of Ph.D. programme of the first author at Madras Veterinary College, TANUVAS, Chennai.