1 Introduction
Australia has one of highest per capita retirement savings in the world.Footnote 1 By 2046, it is projectedFootnote 2 that only 35% of retirees will need in full the ‘safety net’ age pension paid for by pay-as-you-go tax revenue of the state. The relatively high level of pension funding compared to some other countries can be largely attributed to defined contribution schemes introduced in Australia two decades ago. This approach has a mandatory component that now requires employers to contribute on behalf of employees 9% of their gross income. There is also a voluntary component that taxes additional contributions at the 15% concessional rate compared to a much higher top marginal tax rate of 48.5% for personal income. The well being of many Australians now depends on how this large and growing pool (currently over $1.2 trillionFootnote 3) of the retirement savings are managed and regulated.
In Australian superannuation, small funds are definedFootnote 4 as pension funds that have less than five members, and they are often called colloquially ‘Do-It-Yourself’ (DIY) funds. At 30 June 2005, there were about 300,000 small funds holding about $175 billion or 23% of all superannuation assets, second in asset size only to the Retail sector (with 32%), well ahead of Public Sector, Industry, or Corporate sectors (in that order). If the trend growth rate of over 23% per annum averaged over the last few years continues for the Small Fund sector, then the sector could hold the most assets of any sector within the next few years. Also, within the limits set by the Superannuation Industry (Supervision) Act (SIS Act), small funds have the greatest freedom of choice by members, as the investment decisions are largely directed by the members.Footnote 5 With the freedom come potential risks that need to be identified and quantified and hence more research is needed for this sector.
In this paper, we contribute to the research on several thousand small funds regulated by the Australian Prudential Regulation Authority (APRA) by analysing the empirical data collected by APRA. The more extensive and detailed data collection of the past few years has facilitated the research into issues that would have been difficult or impossible before. This provides a rare opportunity to learn about how individuals invest and manage compositeFootnote 6 portfolios. The findings may have important commercial and regulatory implications for the superannuation industry. This is particularly pertinent when recent researchFootnote 7 in behavioural finance suggests individual investors may make irrational choices under situations of risk and uncertainty.
Using recent data, we continue earlier APRA research on Small APRA FundsFootnote 8 (SAF) by a study of some important issues, which were raised in earlier work. Our contribution is based importantly on audited accounting data of individual funds, thus permitting more accurate calculations not available to the rest of the industry, which normally has to rely on unaudited calculated data submitted voluntarily by the funds to publishers. Whilst we are forbidden by lawFootnote 9 to publish individual fund data in an identifiable way, we are able to use unique data aggregation methods to obtain accurate statistical averages over groups of funds. In this paper, we contribute to SAF research in the following ways.
Firstly, we provide estimates on the running cost of Small APRA Funds. The reported data on SAF expenses are probably the most accurate of all superannuation fund data because there is no agent incentive to under-state or under-reportFootnote 10 expenses. It has often been asserted that small funds would have high running costs due to the lack of economies of scale. On this issue, we provide distributions of expense ratios and fund asset sizes and their statistical relationships.
Secondly, we calculate SAF investment returns from the recent data and provide an analysis of SAF investment performance. To answer the question about how small funds perform relative to professionally run institutional funds, we provide a distribution of the return on assets and compare their average returns to those of institutional funds.
Thirdly, we provide data on SAF portfolio composition, estimate average asset allocations in terms of traditional asset classes and quantify their differences to average institutional asset allocation. The analysis suggests there are some systematic portfolio differences in the portfolio composition of small funds.
Finally, we offer a possible explanation for the observed differencesFootnote 11 between small funds and institutional funds. We hypothesize an explanation in terms of the idiosyncratic and systematic factors associated with differences in portfolio composition, demographics, and fund operation.
In the next section, we describe the new empirical data used and state the main reasons for the way the data sample is selected for this research. This is followed in Section 3 by some background statistics of the data sample. In Section 4, we provide estimates of the running cost of Small APRA Funds and show their relationships to asset sizes. In Section 5, the distribution of investment performances of Small APRA funds for June 2005 is shown and the annual returns of these funds are compared with those of institutional funds over the last nine years. In section 6, we study the SAF portfolio composition data and estimate their average asset allocation in terms of more familiar asset classes. We note some portfolio characteristics that are idiosyncratic to the Small Fund sector.
Given the observed differences in investment performances and portfolio compositions between SAF and non-SAF portfolios, we apply a well-known approachFootnote 12 in Section 7 to assess the degree to which the differences in investment performances can be explained by the differences in asset allocation. On finding that there are residual differences in investment performance, which cannot be accounted for by asset allocation differences, we hypothesize possible explanations rising from likely differences in tax expenses due to different demographics and from likely differences in operating expenses due to variations in fund operations.
In the Section 8, we summarize the empirical findings and our explanatory hypothesis for the investment performance differences between the SAF and non-SAF sectors. In the final section, we briefly discuss the some potential implications for the superannuation industry.
2 Data description and selection
Small funds with member trustees, called Self-Managed Superannuation Funds (SMSF), are regulated by the Australian Taxation OfficeFootnote 13 (ATO), while those with external approved trustees, called Small APRA Funds (SAF), are prudentially regulated by APRA. The external trustee of a SAF provides administrative services, including custody, compliance, and accounting. It can often also provide other optional services such as access to investing in managed funds on a wholesale basis, life insurance, and financial advice. In contrast, member trustees of self-managed funds would have to do the administration and some or all of the other tasks themselves.
Whilst there are many more funds in the SMSF sectors than in the SAF sector, the difference in trusteeships appears less importantFootnote 14 than the common feature of small fund members largely directing their own investments. We will exploit the similarities to interpret some of the SAF statistics.
Through the Financial Sector (Collection of Data) Act 2001, APRA has been empowered to collect data from SAFs and other APRA-regulated superannuation funds. Since 2004, APRA has been collecting electronically more detailed SAF data on investment performance and asset allocation. These data details have not been published officially or analysed before and are therefore open to possible subsequent revisions. In this paper, we analyse the data but only draw conclusions that are robust against potential imprecision of the numbers used. Where there are any potential uncertainties, numbers are rounded to indicate the appropriate level of precision.
As more than 90% of Small APRA Funds have only one or two members, the data provide a significant sample of how individual superannuation investors have performed and how their retirement portfolios are structured. In contrast to most published research where aggregate performances are reported, the new data provide a rare and significant opportunity to report individual variations from disaggregated data. The density and the extent of the tails of cost and performance distributions provide valuable insights into the quantification of the risk of how many individuals may potentially have insufficient retirement income.
To obtain accurate estimates of costs and performances, we need to select a sample from the full population of over 7,000 Small APRA Funds in June 2005. The published numbers (APRA, 2006a, 2006b) include many funds that have wound up, or were in the process of winding up, but that have not yet completed the formalities of ceasing to be APRA regulated entities. By law, these funds were still considered regulated and therefore must be included in statistical publications.
Many of those exiting funds have either missing data or very large cash flows, making estimates of costs and performances highly inaccurate. It is well known that large cash flows with unknown timings over a one-year period could lead to significant errors in the estimates of investment returns. Through some simulations studies where we optimize the trade-off between sample sizes against computational accuracy, we have excluded funds with absolute component cash flows greater than 8% of total assets.Footnote 15 The numbers of Small APRA Funds that satisfy this criterion were 6,357 and 6,225 for June 2004 and June 2005 respectively, representing more than 85% of the notional populations.
While the data collection is a significant sample of disaggregated and audited accounting data on portfolios of mostly individuals and couples, it does not contain accurate personal information such as the ages of fund members, their employment and their incomes. The main reason is that APRA has a mandate to collect accurate data that are relevant for the prudential regulation of the funds, and it is more restricted in its ability to collect personal information that has not been shown to be directly relevant to its mission. This data limitation creates greater difficulties for such cross-sectional studies as the individual relationship between social characteristics such as personal income and general investment behaviour. However, our data when supplemented with other sources mentioned in this paper can be used to make broad demographic assumptions.
3 Background statistics of the sample
On 30 June 2005, the aggregated total assets of the SAF sample of 6,225 funds was about $3 billion, owned by about 9,500 members, with an average total asset per member of over $300,000. This far exceeds the superannuation industry averageFootnote 16 member account balances of about $26,000. Even taking into account that there are over 27 million member accounts in the industry and therefore there are members with multiple accounts, the SAF sector has retirement savings of members who have accumulated substantially more wealth.Footnote 17
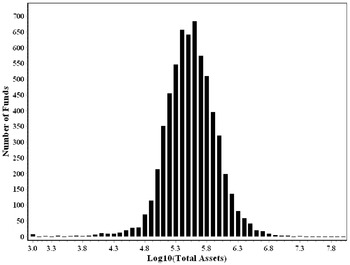
The vast majority (93%) of the funds has only one (57%) or two (36%) members. The frequency distribution of SAF total assets is shown in Figure 1, which appears log-normal,Footnote 18 with the logarithm to base 10 of fund total assets having a mean 5.49 and a standard deviation 0.41. Note that logarithm to base 10 makes asset values easier to read, e.g. a value of 5 corresponds to $100,000 in asset value and it is easy to convert to natural logarithmFootnote 19 by multiplying the base 10 value by a constant of about 2.3.
Distribution of total assets of small APRA funds (June 2005)

About two thirds of our sample of funds are within one standard deviation on either side of the mode at $309,000, in the range $132,000 and $721,000. The largest total assets for some SAF portfolios in this dataset are over $10 million.
This distribution is at first surprising, since classical studies of Pareto suggest that wealth has a power-law distribution with fatter tails, whereas the observed distribution suggests strong cut-off mechanisms in operation at the high value end. The thin tail at the low value end below $100,000 can be explained by the fact, as shown empirically below, that funds with low total assets suffer high expense ratios, as commonly asserted. They therefore seek to invest economically more efficiently through other vehicles such as public offer funds.
On the other hand, very high net worth individuals with total assets approaching $1 million and beyond appear not to employ the superannuation vehicle to substantially manage their retirement savings. Possible reasons include the existence of limitsFootnote 20 to the level of contributions, which receive tax concessions and the greater opportunities for wealthy individuals to use other tax effective strategies.
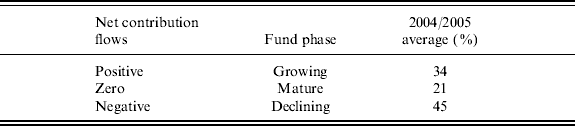
Net contribution flows consist of member contributions, rollovers, and insurance proceeds minus contribution tax, benefit payments, and insurance costs. A fund is growing (declining) if its net contribution flow is positive (negative) and it is mature if the net contribution flow is zero. Table 1 shows that averaged over 2004 and 2005, about 45% of the funds had net contribution outflows.
Distribution of net contribution flows of small APRA funds
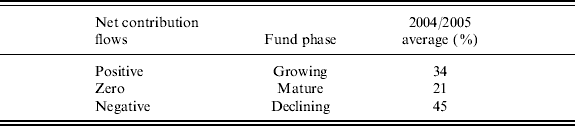
For the year to June 2005, the growing funds had a total of about $208 million net contribution inflows, while the declining funds had a total of about $127 million net contribution outflow. The total investment for growing funds was about $1.1 billion, for mature funds was about $0.4 billion, and for declining funds was about $1.5 billion. About 48% of the funds were paying out benefits totalling around $164 million.
These statistics are consistent with an older demographic profileFootnote 21 of small funds compared with the other funds, where over 50% of SMSF members are 50 or over and whereas only 20% of non-SMSF members are 50 or over. The relative high proportion of Small APRA Funds paying benefits could be related to this demographic factor. About half of SMSF members have industry classificationsFootnote 22 in the finance, insurance, real estate, and business services sector. The average total income of SMSF members is more than doubleFootnote 23 that of non-SMSF members.
The empirical evidence suggests small funds generally have high levels of accumulated assets by members who are more likely to be older professional workers or small business owners with greater than average familiarity and confidence with managing investments. About 30% more SAF funds compared to non-SAF funds may be substantially in the withdrawal phase, paying benefits to fund members.
4 Running cost of small APRA funds
The cost of running a superannuation fund is measured by the expense ratio, which is defined as the sum of investment expenses and operating expenses divided by the average total assets over the period.
About 66% of the institutional fund assetsFootnote 24 are invested through other funds, where each fund could have many types of expenses from distribution, marketing, advisory fees, brokerage, manager fees, custodian fees, administration fees etc. To track all these sources down and accurately account for them would involve a non-negligible cost to the entities for which there would be negative commercial benefit resulting from reporting higher expense ratios. The current regulatory reporting standard requires entities to only supply information that is readily available (e.g. supplied by service providers). Often funds are simply reporting returns net of expenses. Hence, there is a natural bias to under-report expenses.
Moreover, there are as well other important ways where expenses could be under-reported by institutional funds. For example, when a fund changes investment managers, selling the old portfolio of securities and buying the new incurs opportunity and market impact costs, which are real but invisible costs. These costs affect the fund in lowering the reported gross earnings.
Other invisible costs related to trustee governance practices include situations where investment performance fees by managers may be paid through incentive allocation of options or units in a fund of funds situation.Footnote 25 Soft-dollar arrangements where higher transaction costs are paid via higher bid-offer spreads by broker principal dealing would also contribute to an invisible expense. Many other practices such as free-switching and late-trading by managers also are potential ways that add to invisible costs of managed funds. Invisible costs are expected to be high when trustee governance is poor.
Compared to institutional funds, the problems of under-reporting of expenses are greatly diminished for small funds, the agent's incentive to under-report expenses is absent and, indeed, the bias might even operate in the opposite direction, where a fund would want to claim maximum tax benefits by declaring fully all expenses.Footnote 26 Moreover, most of SAF assets are directly invested, for example more than 50% in direct shareholdings, making investment expenses easier to monitor. Hence, the SAF data are potentially the most accurate data on investment expenses of all types of superannuation funds.
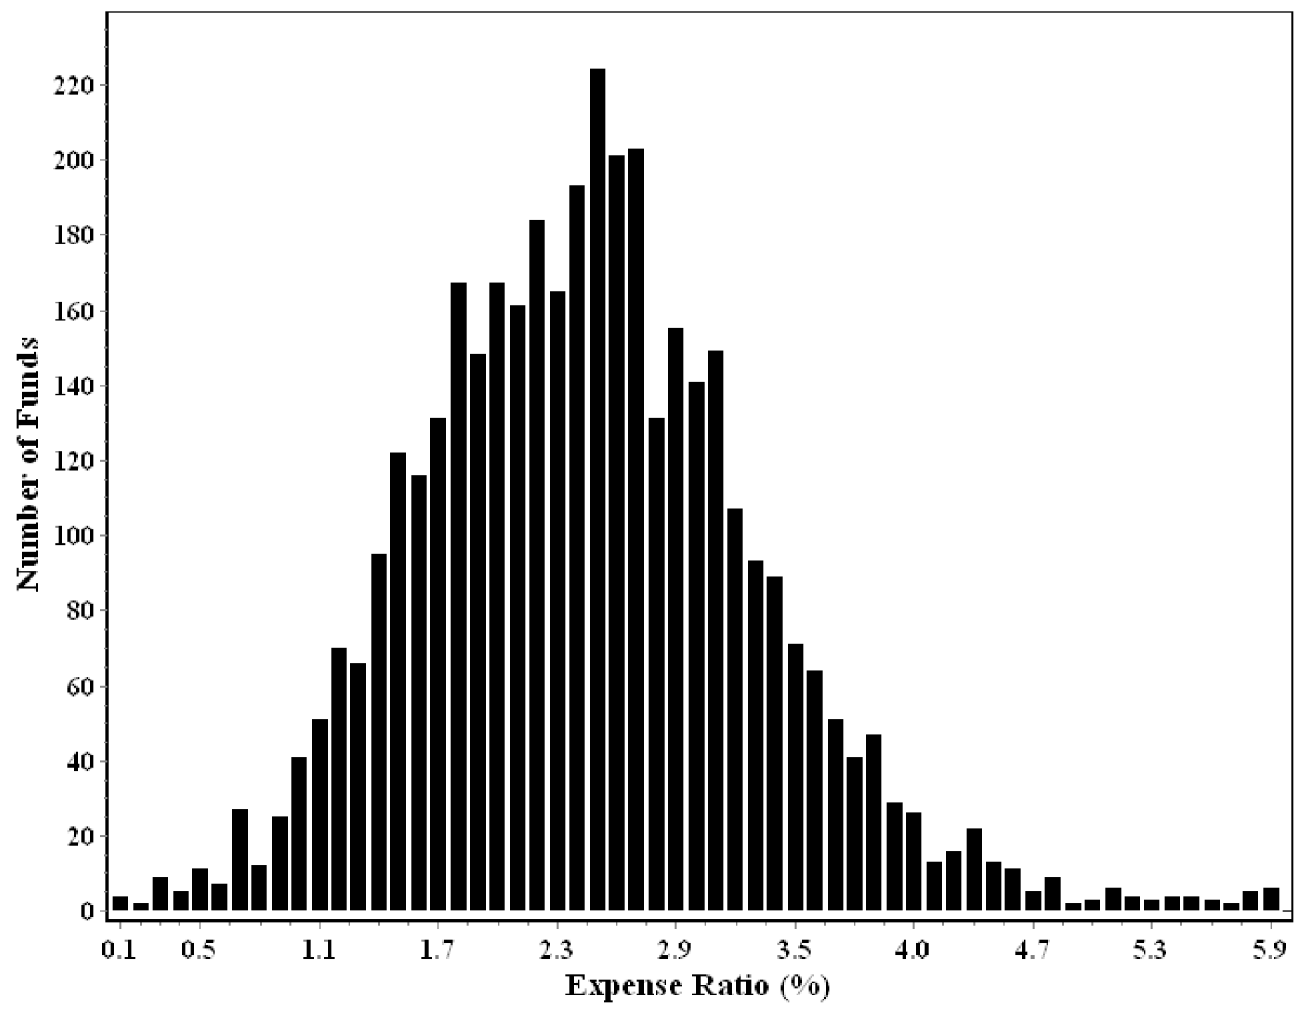
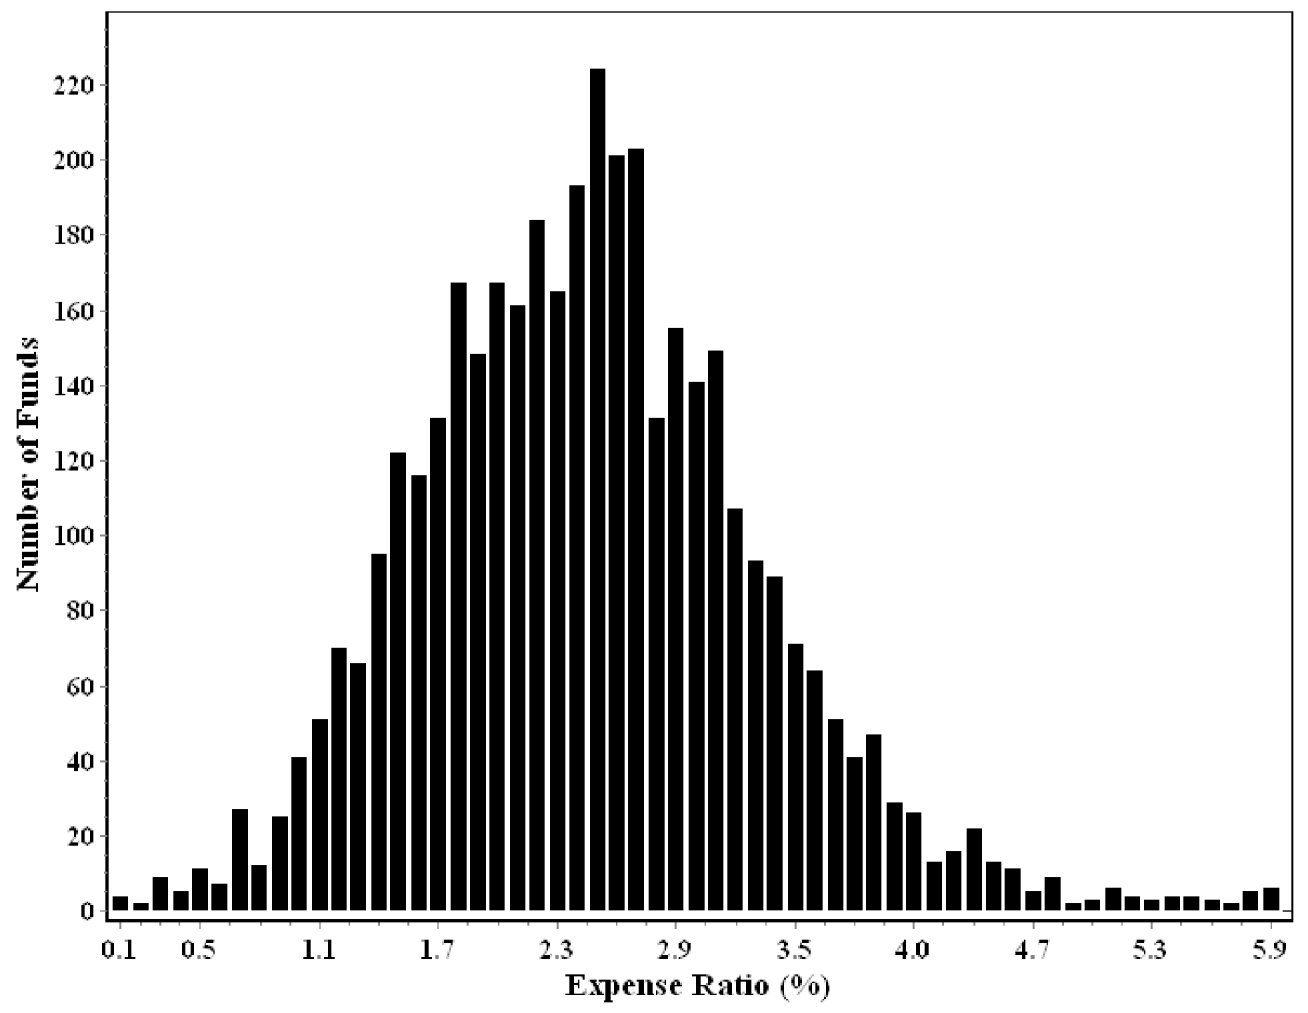
These potentially more accurate SAF data on expense ratios are shown in Figure 2, where we see quite a broad distribution of outcomes.
Distribution of expense ratio for small APRA funds (year to June 2005)
External trustees can provide a lengthy list of potential services to a fund for which fixed or variable fees are charged, leading to complex cost structures. Typically, fixed fees could include one-off fees for fund establishment or termination and annual fees for fund administration, auditing, tax reporting, and APRA levy. Variable asset-based fees typically include those for contributions or withdrawals, trustee investment management, brokerage, commission, and fees for share trading or managed funds. Other services that attract further fees include financial advice, actuarial service, and life insurance. While there are many potential cost items, they are often optional and not standardized for reporting. They are only required to be disclosed in such detail in prospectuses of trustee service providers. This means data from the funds can only be collected in practice in broad cost categories, with administration being one of the main ‘catch all’ categories.
About 75% of total expenses are attributable to administration fees, which principally contribute to making operating expensesFootnote 27 more than 90% of total expenses; that is, Small APRA Funds have relatively low investment expenses. Obviously, SAF members could spend significant amounts of time in managing their investments and since this effort has not been expensed, it is not accounted for in their expense ratios. The chart shows how the expense ratio is widely distributed among the funds. The ‘equal weighted’ or arithmetic average over individual funds is 2.6%, whereas the asset weighted averageFootnote 28 falls to 1.8%.
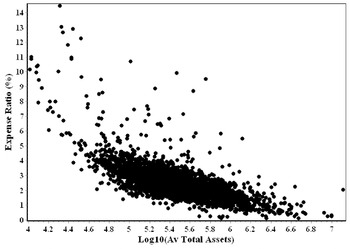
The significant difference between the two averages suggests an asset size effect. The arithmetic average is elevated by the high expense ratios of very small size funds with less than $100,000 in total assets – as Figure 3 shows, the expense ratio generally falls as fund size increases, confirming the widely held viewsFootnote 29 on the benefits of the economies of scale.
Relationship between SAF expense ratio and average asset (year to June 2005)

The scatter plot shows a significant statistical relationship with relatively few outliers. Most extreme outliers with high expenses occur at low asset levels. The two discernible non-linear tails at the low assets end may be associated with the different cost structures of the two main external approved trustees. The proportion of extreme outliers in expense ratios starts to decline substantially when total assets are greater than $100,000. The expense ratioFootnote 30 approaches SAF sample averages of about 2% and further decreases as total assets increase beyond about $200,000. The cost efficiency threshold of about $200,000, suggested by the above statistics, is broadly in agreement with widespread opinions of financial advisers and external trustees in the Australian industry.
5 Investment performance of small APRA funds
Return on assets (ROA) is defined as net earnings divided by the average asset for the period.Footnote 31 Net earnings is the sum of investment income (including capital gains) and other income less investment expenses, operating expenses, and tax expenses on earnings.
This is the most reliable method of measuring investment performance because the calculations are based on audited accounting data. Unknown timings of a few large cash flows could potentially make the ROA calculation inaccurate for a single fund. We have mitigated the possible inaccuracy by our selection of fund sample with a limit on the size of any cash flow component for any fund.
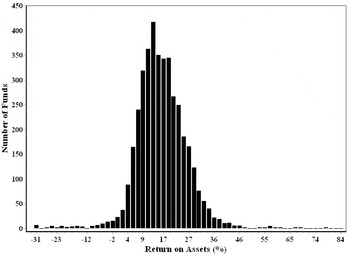
As the following chart (Figure 4) shows, most Small APRA Funds have enjoyed strong returns in 2005, even though there was significant variability and a small number of funds had negative returns. The equal-weighted average return was 16.3%, lower than the asset-weighted return of 17.1%. This may be explained by very small funds with total assets less than $100,000 having very high expense ratios (as seen above), dragging down their own returns and the sector average return.
Distribution of return on assets for small APRA funds (year to June 2005)

As may be expected, the range of investment outcomes is greater for small funds than for institutional funds. The standard deviation of the ROA is about 10.5% for the above SAF sample, whereas the corresponding standard deviation for non-SAF or institutional funds regulated by APRA is 8.5%.
Unlike the clear inverse relationship found in the previous section between expense ratios and asset sizes, there is only a weak correlation (11%) between return on assets and asset size for individual funds in the 2005 data. This is to be expected because the investment performance of a fund of a given size can have high cross-sectional and temporal volatility, whereas its expense ratio is less volatile being less dependent on portfolio compositions and market fluctuations.
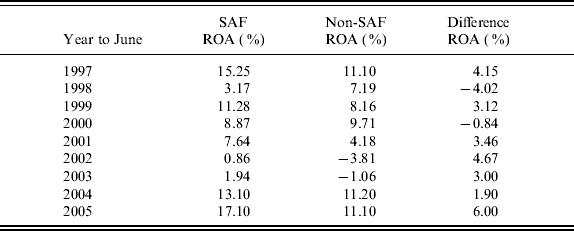
At 17.1% ROA for the year to June 2005, the SAF sample out-performed by 6% the non-SAF sector, which returned 11.1%. Obviously, there are differences within the non-SAF sector, which consists of the Public Sector, Corporate, Industry, and Retail sectors, with the Retail sector being ‘for-profit’ and the other sectors being ‘non-profit’. There appears to be systematic performance differences between the ‘for-Profit’ and ‘non-profit’ sectors, which may be related to agency costsFootnote 32 of profit making firms. In this paper, we focus on individual versus institutional investor investment performance and behaviour. We therefore ignore the sector distinctions between institutional funds and call them collectively the non-SAF sector for brevity.
It is important to note that sector investment performances in this paper are not simple averages of individual fund performances. Instead, we use a method of aggregation of audited accounting data of all funds in the sector. Net earnings and average assets are summed in dollar amounts across all funds in the sector to create what is effectively an aggregated SAF sector fund.
This method provides the most accurate asset-weighted return on assets (ROA) for a whole sector when averaged across fund sizes and asset allocations. The method substantially reduces the impact of cash flows, as it smoothes out the timing of cash flows and reduces the relative size of any large cash flow to total assets. This method of averaging is not available to the industry at large because the accounting data for all regulated funds are only available to the regulator.
The industryFootnote 33 in general has to rely on collating and averaging individual ROA estimated by each fund. This process may be unreliable because of non-uniformity of calculation methods across different funds and the unknown impact of large cash flows should they exist for a particular fund. Moreover, in supervising and regulating the funds, we know from the lateness and errors found in data submissions that there are funds that experience difficulties in supplying even basic accounting data. This does not lend confidence to the numbers published by some of the funds. Indeed, some funds have publicly admitted unit pricing errors and have been forced to compensate investors for those errors.
Including performance data from APRA research for previous years,Footnote 34 a comparison table (Table 2) for annual investment performances in terms of asset-weighted ROA between SAF sector and the non-SAF sector is obtained for the past nine years.
Return on assets of small APRA funds and other APRA regulated funds
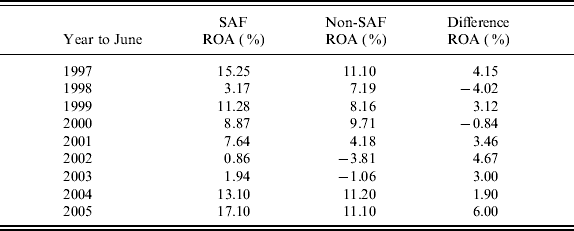
It is interesting to observe that the SAF sector out-performed the non-SAF sector in seven periods out of nine and that the SAF sector had no negative return periods, whereas the non-SAF sector had two years of loss. The t-statistics for the performance difference is 2.33, indicating a 95% probability that the results are not random.
The simple average ROA over the period for SAF sector at 8.80% per annum is more than 2% higher than that for non-SAF sectorFootnote 35 at 6.42%. The geometric mean returns are 8.66% per annum and 6.29% respectively, and average compound out-performance is 2.2% per annum by the SAF sector over the non-SAF sector. The total return over the nine-year period was 111% for the average Small APRA Fund and 80% for the average institutional fund.
The volatility of average returns for the SAF sector at 5.90% is slightly higher than that for non-SAF sector at 5.55%. Assuming an average after tax return on Treasury bill rate of 5% for the nine-year period, the Sharpe ratio for net investment performance of the SAF sector at 0.64 is higher than that of non-SAF sector at 0.26. This suggests that there are potentially systematic explanations for the investment performance differences.
6 Portfolio composition of small APRA funds
It is well-knownFootnote 36 that asset allocation is a major determinant of investment performance in explaining return levels, variability over time or variability across funds. Hence, an analysis of the new asset allocation data for APRA regulated superannuation funds should provide substantial insights into possible explanations for the observed differences in the investment performances between the SAF and non-SAF sectors.
Asset allocation typically refers to allocation to major asset classes such as domestic equity, international equity etc. for which there are benchmark indices for fund investment performance comparisons. Such comparisons and their associated asset allocation data are important for institutional funds. However, because such performance comparison is not required for small funds, there has been little incentive to analyse fund holdings in terms of exposure to major asset classes. Holdings for small funds are typically reported to the tax office and regulators in terms of holdings in investment vehicles such as listed or unlisted trusts, investments in life companies, and wholesale trusts, as well as direct holdings of listed equity securities.
The available asset allocation data are expressed in terms of allocations to investment vehicles.Footnote 37 To convert from the allocations to investment vehicles to the more familiar allocations to asset classes, we use an aggregation procedure where the cash asset class represents deposits. Fixed interest consists of loans and debt securities with individuals, unlisted corporations, unlisted private trusts, and all others. Listed equity is composed of equity securities of listed corporations and units in listed unit trusts. Unlisted equity includes equity securities of unlisted corporations, units in unlisted private trusts, and interests in ventures. Direct property consists of both incomplete and completed property. Diversified trusts include investments in pooled super trusts, unlisted retail/public offer unit trusts, and wholesale trusts. Other includes direct holdings of derivative financial instruments, investments in leased assets, insurance policies held in statutory fund of life companies, and any other investments.
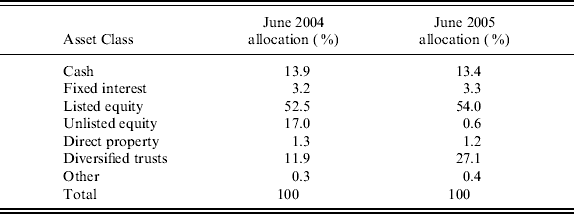
The following table provides the asset-weighted average asset allocations of SAFs for the financial year ending 2004 and 2005.
The change in asset allocation from unlisted equity to diversified in June 2005 is likely to be apparent rather than real, as the definitions of those two asset classes can have overlapping interpretations and as 2004 was the first year when the new forms were used. This glitch in the data collection may be useful in suggesting that over half of diversified assets are probably equity investments in unlisted trusts; that is, in the 2004 data, holdings in managed funds investing predominantly in shares were classified as unlisted equity. However, in 2005 the same holdings were thought to be better classified as diversified trusts, mainly because some of these trusts may hold small amounts of derivatives for hedging purposes. We note that apart from this data glitch, the average portfolio composition remains relatively constantFootnote 38 from 2004 to 2005.
The relatively high allocation to listed equities in Table 3 may well be related to the confidence and familiarity with direct shareholding by Australians in general. In the 1990s, Australian governments encouraged widespread share ownership in their approach to the privatization of major national enterprises such as the Commonwealth Bank, Qantas, and Telstra. Demutualization of major insurance companies such as AMP and NRMA also added to popular interest in shares. According to a 2004 survey by the Australian Stock Exchange,Footnote 39 55% of adult Australians (8 million) own shares. Of these, 44% own and manage some or all of their shares directly in portfolios, with an average portfolio value of $41,400, while 11% own them indirectly through managed funds.
Asset weighted average asset allocation of small APRA funds
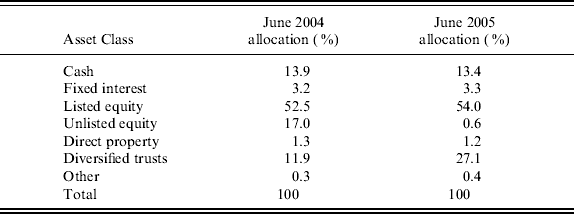
In contrast, the fixed interest investments have attracted much less attention from retail investors, perhaps due to a combination of reasons. Firstly, the Australian government has been running budget surpluses and has been retiring government debt in recent years. This has reduced the supply of the highest quality fixed interest stock. Secondly, even when local government and corporate bonds are available, they have typically $100,000 face values, making them too lumpy for retail portfolios. Thirdly, it has been difficult for fixed interest managed funds to convince retail investors that they can add much value in recent environments with relatively flat yield curves and low volatility. Fourthly, when retail investors have taken the risk with high yield property debentures, the experience has often been disappointing. These factors may explain the low allocation to fixed interest securities in Table 3.
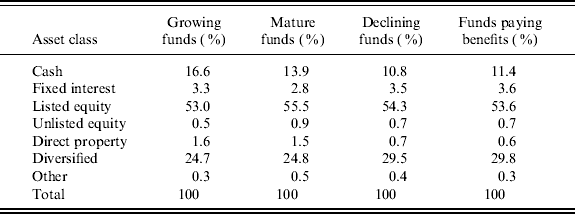
The average asset allocation of SAFs does not depend significantly on whether the funds are growing or declining or whether they are paying benefits, as Table 4 shows for June 2005.
Asset allocations of small APRA funds with different net contribution flows
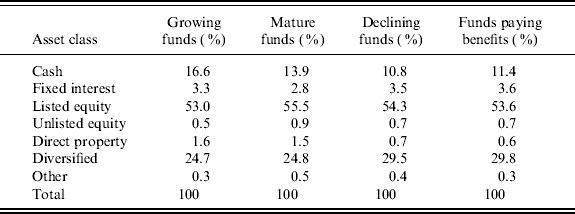
The relatively small shifts in asset allocation between different retirement portfolios suggest the most beneficiaries are likely to be in the early stages of retirement. Since in such cases the post-retirement portfolios may need to be paying benefits still for many years to come, there needs to be at most only a gradual transition to more conservative portfolios with fewer growth assets.
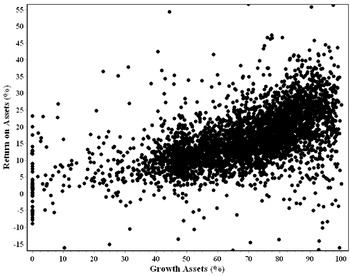
Defining growth assets as the sum of listed equity, unlisted equity, direct property, and half of diversified trusts, then the impact of asset allocation to growth assets on investment performance as measured by ROA for the year to June 2005 can be seen in Figure 5, which shows a statistically significant relationship with relatively few outliers.
Relationship between return on assets and percentage growth assets (year to June 2005)

The data evidently support our definition of growth assets and confirm that there are obvious benefits in having high weightings in growth assets in periods of strong economic growth. It is likely the SAFs on average over an extended period have about 70% or more in equity or growth assets, which is higher than 56% to 64% as typically stated by the institutional funds' default investment strategies.
The non-linear relationship between weighting to growth assets and portfolio performance apparent in the above chart suggests the possible existence of gearing in some portfolios, which may be achieved through such investment products as installment warrants.
The average equity portfolio of SAF sector also appears to have a strong home country bias. Only 29 Small APRA Funds declared a total of about $4.5 million in foreign investment holdingsFootnote 40 (out of a total asset of $3 billion for the SAF sector in June 2005).
The exposure to foreign investments by small funds is likely to be understated because it is possible to invest in foreign equities directly through listed investment companies on the Australian Stock Exchange and indirectly through diversified managed funds and to report such holdings as domestic investments. Even though the negligible foreign investment is almost certainly understated, a home country bias is still highly likely when compared with a 23% allocation to international equities stated by institutional funds for their default investment strategies.Footnote 41
It is possible to provide additional evidence to support hypothesis of the existence of a strong home country bias in the SAF sector, because of clearly identifiable events that drove the significant differences in Asian and US financial market performances in past decade, as we will discuss below. From an Australian investor's point of view, any differences in portfolio performance are likely to depend mostly on differences in asset allocation between Australian and international equities, driven mainly by US equities.
We use the performances of the ASX All Ordinaries Index and the S&P 500 Index as proxies for the average performances of domestic equities and international equities. We compare the differences in Australian and US equities performances with the differences in investment performances of the SAF and non-SAF sectors to see whether there is a statistical relationship between these differences.
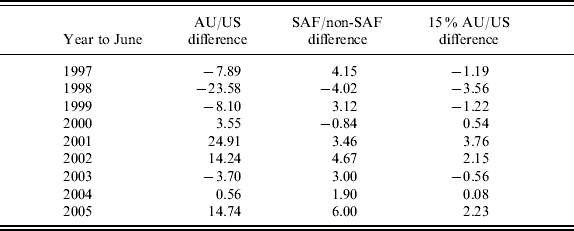
A minimization of the residual sums of squares of the deviations to optimize the correlation between asset allocation differences and investment performance differences leads to an estimate that the average SAF portfolio had about 15% more Australian equities than international equities compared to the average non-SAF portfolio. This result is consistent with the 23% allocation to international equities stated by the institutional funds for their default investment strategies (APRA, 2006b). The results are summarized in the following comparison table.
Some of the more extreme differences in this table have well recognized explanations. The Asian currency crisis starting in July 1997 had led to a ‘flight to quality’ to US assets, leading to a strong relative out-performance of US equities compared to Australian equities in the year to June 1998. The inflation of the ‘tech bubble’ (partly associated with the Y2K anxiety) in 1999 led to stronger performance of US equities relative to Australian equities, but widespread scepticism might have kept the non-SAF sector from a full participation in the mania. The collapse of the ‘tech bubble’ in April 2000 and the September 11 terrorist attack on New York City in 2001 led to strong relative out-performance of Australian equities in 2001 and 2002.
Finally, the year to June 2005 shows extraordinary out-performance of the SAF sector relative to non-SAF sector (6%), more than appears reasonable from the relative performances of the benchmark indices. However, from 2004, the rise in energy prices accelerated, the ASX Energy Index out-performed the All Ordinaries Index in the year to June 2005 by a factor of three at over 64% return in that financial year. Hence, even a modest over weighting in the resources or energy sectors would have a dramatically positive effect on investment outcomes.
In spite of the fact that in the last two columns of Table 5 there are opposite signs in four cases out of nine, the correlation coefficient is still about 64% and an ordinary least squares regression gives a slope of 0.46, due to high correlations in extreme events. Hence, the data suggest home country bias may be a significant explanatory variableFootnote 42 for the differences in the average SAF and non-SAF investment performances.
Relative Australian/US equity and SAF/non-SAF investment performance
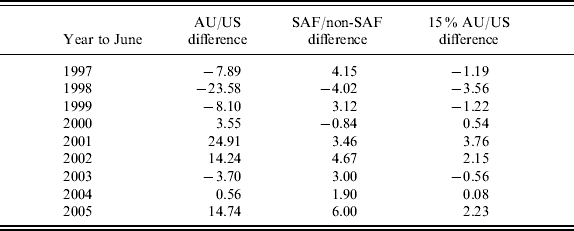
In conclusion, we estimate that the average SAF portfolio has likely differences relatively to the average non-SAF portfolio of about 10% more growth assets and about 15% more domestic equities in place of international equities. These portfolio composition idiosyncrasies may be persistent over the nine-year period of analysis, as the SIS Act requires funds to generally adhere to stated investment strategies.
7 Performance attribution of small APRA funds
The average performance difference between the average SAF and non-SAF portfolio is about 2.2% per annum compounded over the nine years to June 2005. The standard performance attributionFootnote 43 suggests a significant role played by the idiosyncratic differences in composition of market exposure between SAF and on-SAF portfolios. On an aggregated basis over a large number of portfolios, we assume ‘alpha’ cancels out, since gains in stock selection and market timing in some portfolios are cancelled out by losses in other portfolios.
A study of benchmark indices suggests an average investment performance differential between growth and non-growth assets of about 5% over the past decade. Hence, about 0.5% per annum of out-performance of the SAF sector relative to the non-SAF sector may be attributed to about 10% more growth assets held by the SAF sector.
A similar analysis shows the home country bias of 15% more domestic equities versus international equities has benefited the SAF portfolios to produce extra returns of about 0.4% per annum over the period. About 0.25% is due to capital gains difference and 0.15% is due to dividend imputation benefits. Of the 2.2% per annum out-performance by the SAF sector, we conclude about 0.9% may be accounted for by strategic asset allocation. This leaves about 1.3% out-performance by the SAF sector as yet unexplained by portfolio idiosyncrasies.
Some of the remaining out-performances may be explained by systematic demographic differences between SAF and non-SAF memberships. An older SAF membership suggests more of them are likely to be benefit-paying funds for which there are tax concessions on fund earnings thus improving their net investment returns. If we assume there are 30% more funds in the SAF sector paying benefits than those in the non-SAF sector and if we assume 30% of total SAF earnings are tax-free, because of funds getting tax rebates from using annuities and allocated pension arrangements, then we estimate up to about 0.4% per annum may be attributable to this tax advantage.
The remaining factors, which may explain the relative performance differences, are operating costs, since institutional funds and small funds have very different cost structures from having operations of entirely different scales and business requirements. Institutional funds may need expensive computer systems for administration, accounting, and reporting requirements. They may also need to advertise or use external custodians. Many also use asset consultants, actuaries, and legal services. The trend away from direct investment and towards indirect investment through fund managers also increases investment expenses. These additional costs may not be fully compensated by other savings through the economies of scale of institutional funds.
In a recent research report sponsored by the Investment and Financial Services Association (IFSA), Rice Warner ActuariesFootnote 44 provided estimates of expense ratios for different market segments and sectors. The estimates are based on research on known expenses revealed in a variety of sources including reported expenses from APRA publications and product disclosure statements (PDS) of retail funds. It is likely that the expense estimates set lower bounds for true expenses because of the existence of invisible costs mentioned above. We assume the relative expense ratios estimated across segments are more accurate than their absolute values.
We use the estimates given by Rice (Footnote 2007) and calculate an asset-weighted non-SAF expense ratio for June 2005 by averaging the ratios calculated from its 2004 and 2006 published values. The expense ratio at 1.44% is 0.5% higher than 0.94% found for the SMSF sector from a similar calculation. Hence we hypothesize that 0.5% of the SAF out-performance may be attributable to cost savings from running funds with simpler operating structures. The remaining 0.4% out-performance still not accounted for we put down provisionally to invisible and other cost savings. Apart from invisible costs, e.g. arising from soft dollar arrangements and other cost shifting mechanisms, there might be costs from institutional funds, providing on average more services such as insurance and financial advice.
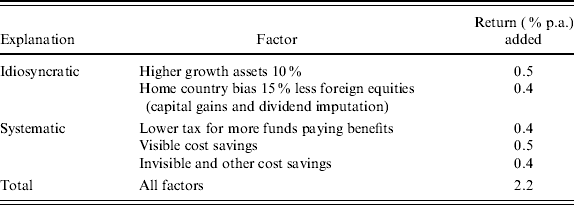
The above decomposition of SAF out-performance is summarized in Table 6.
Decomposition of out-performance of small APRA funds over other APRA regulated funds
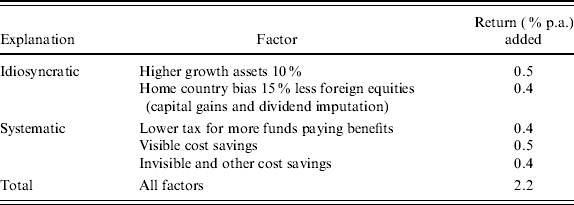
Notes: We are assuming 30% more small funds than institutional funds are paying benefits and obtaining tax rebates. Visible cost savings are estimated from Rice (Footnote 2007) from expense differentials between institutional funds and the SMSF sector. Invisible and other cost savings are essentially a balancing item attributed to possibly known but unaccounted for costs.
The above performance attribution of the 2.2% per annum SAF out-performance over the nine years to 2005 suggests 0.9% per annum is due to idiosyncratic asset allocation differences, 0.4% is due to likely tax advantage from demographic differences, and 0.9% is due to cost savings from running simpler operations. Included in the cost savings are possibly savings from not paying investment management fees, because many SAF members may use their own experience and effort to direct their own investments.
If we accept that the expense ratio calculated from reported SAF data is the most accurate available from accounting data, then it can be used to calibrate expense ratios of other superannuation funds. If the differences in expense ratios between the SAF and non-SAF portfolios are accurate, then we can infer expense ratios of non-SAF portfolios from accurate SAF expense ratios. The above performance attribution would suggest an average expense ratio of 2.3% to 3.1% for non-SAF portfolios, based on a 1.8% expense ratio for the SAF sector. The same line of reasoning would put the expense ratio for the average retail fund at over 3%, based on the segment relativities of the Rice Warner Report.Footnote 45 A survey of the fees set out in publicly available product disclosure statements of retail funds would indicate that an average expense ratio over 3% is quite plausible.
8 Summary
The collected data for 2005 show Small APRA Funds generally have high levels of accumulated assets (over $300,000 per member) owned by members who are more likely to be older professional workers or small business owners with greater than average familiarity and confidence with managing investments. Our sample of about 6,000 funds is similar in this respect to the more numerous funds in the SMSF sector.Footnote 46
We find from the 2005 SAF data that the cost of running Small APRA Funds was about 1.8% per annum on an asset weighted basis. We confirm the existence of economies of scale, where costs for asset sizes less than $100,000 were very high and decline rapidly from $100,000 to $200,000, at which point the expense ratio approaches average SAF values and continues to decrease for higher asset values.
Averaged over the nine years to June 2005, Small APRA Funds perform 2.2% per annum betterFootnote 47 than institutional funds, on an asset weighted basis, though the spread in investment outcomes between portfolios is larger for SAF than for non-SAF portfolios. The asset allocation data suggest the existence of a home country bias in fund portfolios, with 15% less foreign equities than institutional funds and the portfolios also have on average 10% more growth assets.
Both the home country bias and higher allocation to growth assets have advantaged the SAF sector and we estimate that this results in 0.9% per annum out-performance over the period. We hypothesize that systematic factors coming from the tax advantage of having more SAF fund paying benefits may account for up to 0.4% per annum of the out-performance. We suggest the remaining 0.9% per annum performance differential comes from savings on operating cost and other invisible costs not borne by small funds. Whilst we have not analysed in detail SMSF expense ratio, performance, and portfolio composition, we believe the sources of savings on operating cost are likely to be similarly applicable.Footnote 48
Assuming the average expense ratio for the SAF sector estimated from reported data is unusually accurate and assuming the performance attribution does indicate cost savings from simpler management of SAF portfolios, then our study suggests expense ratios for non-SAF portfolios are higher than current estimatesFootnote 49 from simply summing up known expenses. This difference may be due to invisible costs mentioned in this paper, which are difficult to quantify directly in financial statements.
9 Discussion
Our research has contributed to the understanding of a number of topical issues in the pension industry relating to running cost of funds, investment performance, and portfolio composition. There are some potential implications for the industry.
The past several years have seen keen competitionFootnote 50 in the Australian pension industry based on costs between public offer funds.Footnote 51 If merit is based on cost alone, small funds appear to have merit due to a cost advantage,Footnote 52 from the results of this paper, only if they have $200,000 or more in assets. While younger workers have little choice but accept or select institutional funds, older and financially savvy workers who have accumulated sufficient assets appear to be taking the ‘do-it-yourself’ route, judging by the rapid growth of the Small Fund sector in recent years.
The hypothesisFootnote 53 that the larger than expected equity premium found in historical data might be due to myopic loss aversion by investors appears to apply less to individual investors than to institutional investors – as our data show, the SAF portfolios have higher growth assets and hence higher market risk than non-SAF portfolios.
The past decade has seen the home country bias work to the advantage of the SAF sector relative to the non-SAF sector. However, this advantage may not be sustainable in the long-term. There are both financial and economic reasons to have adequate exposure to foreign investments. Finance theoryFootnote 54 shows the existence of portfolio benefits from international diversification, particularly for small economies such as Australia, which has less than 2% of global economic production.
Studies have shownFootnote 55 uninformed individuals following a simple diversification strategy could do as well as most superannuation funds. These studies confirm empirically the compelling argumentFootnote 56 that for investors in aggregate they can only get market returns and hence a key strategy for a large portfolioFootnote 57 is to have adequate market exposure at the lowest cost. Indeed this appears to be supported by the fact that the estimated expense ratiosFootnote 58 seem to be inversely correlated to investment performance.Footnote 59
The operational risks faced by SAF and non-SAF sectors are qualitatively different. The operational risks of institutional funds arise mainly from those associated with the ‘principal and agent’ problemFootnote 60 and regulatory efforts recognizingFootnote 61 those risks have led to the licensing of superannuation trustees of all non-SAF funds in 2006.
Given their simpler structures, risks such as poor corporate governance, poor disclosure, related party dealings, fraud etc., which may apply to non-SAF sectors, are less relevant for the SAF sector, though other risks remain. There are funds with abnormally high contributions and withdrawals relative to their total assets, which appear unusual from the data, and which may have legitimate or illegitimate reasons. Illegitimate reasonsFootnote 62 may include some forms of money laundering, tax avoidance, and improper or early access of superannuation funds (to purchase or consume goods and services). There have been callsFootnote 63 to consider more regulation for the Small Fund sector, particularly for the SMSF sector. We note that any regulation should not erode the low cost and simplicity apparently enjoyed by this part of the industry.
In this study, the available evidence from our research suggests Small Fund sector assets are on average no less efficiently managed than institutional funds. Indeed, by fund members' own efforts, which have not been separately accounted for, a small fund can save about 1% per annum on average by having lower operating expenses than institutional funds,Footnote 64 provided it has a sufficient asset size.
Individual freedom in investing by small funds also produces a substantially wider range of outcomes in terms of financial results, leading to increased risk that those at the lower end of the outcome range may have insufficient savings for their retirement. The social concern of having an acceptably narrow range of outcomes to provide a secure foundation for national retirement income has been highlighted in other studies.Footnote 65 The challenge to the investment industry is to create more low cost products providing market exposure, particularly to international equities, to help small fund investors.
The longer-term implications of the findings of this paper are potentially highly significant for both the Australian and global pension industry. If our hypothesis that the rapid growth of individual self-managed funds is partly but significantly explained by a realization of cost savings relative to institutional funds, then we would expect that the cost factor will continue to drive national retirement savings along the self-managed route. This process will accelerate as workers accumulate sufficient assets closer to retirement to pass cost efficiency barriers and then they may take matters into their own hands. No one knows what the ultimate proportions of self-managed assets or retirees will be, but they are already significant.
Australia is unusual among the countries in that it addressed the issue of retirement savings earlier than most countries and took a lightly regulated approach based on tax incentives and employing several different strategies. It is unlikely that anyone would have predicted the growth and the importance of small funds we witness today. The national retirement saving strategies of many countries are not typically as diversified and do not permit individual investors to play as large a role as they do in Australia.