Implications
An increasing amount of turkey breast meat is sold in self-service packages. Because of this, meat colour differences between meat pieces or higher drip loss are more obvious to consumers, which is one of the reasons for increasing complaints. The muscle-to-meat transition is a complex process, characterised by a decrease in pH and a change in the oxidative status, revealing the simultaneous production of reactive oxidative substances by mitochondria and the activation of the corresponding antioxidative enzymes. The aim of this study was to elucidate the changes in these oxidative processes after animal slaughter in relation to meat quality differences.
Introduction
Although the colour variation of poultry meat under modified atmospheric conditions could be, to a certain degree, physiologically explicable (Werner et al., Reference Werner, Janisch, Kuembet and Wicke2009), at the time of purchase consumers show concern, especially if meat is characterised by a heterogeneous appearance, poor texture and cohesiveness, and a higher drip loss (Barbut, Reference Barbut2009). This meat is referred to as pale, soft and exudative (PSE)-like meat with similarities to PSE pork (Barbut, Reference Barbut2009; Petracci et al., Reference Petracci, Bianchi and Cavani2009). Colour of meat is related to the total myoglobin (Mb) content and the proportion of the Mb redox forms oxy-, deoxy- and met-Mb. Total Mb content is influenced by gender, genetics, age and, within a species, muscle type. An important feature is the fibre-type composition of the muscles, with breast muscles only consisting of fast-twitch glycolytic (FTG) fibres containing low Mb and mitochondria concentrations, and leg muscles additionally containing Mb and mitochondria-rich slow-twitch oxidative (STO) fibres (Papinaho et al., Reference Papinaho, Ruusunen, Suuronen and Fletcher1996; Mancini and Hunt, Reference Mancini and Hunt2005). Proportions of oxy-, deoxy- and met-Mb are strongly related to the oxidative status of the tissue influenced by the oxygen consumption and the antioxidative capacity of the tissue (Figueiredo et al., Reference Figueiredo, Mota, Appell and Duarte2008). The electron transport chain (ETC) of mitochondria is not only responsible for the oxygen consumption of the tissue, but is also a significant source of reactive oxygen species (ROS). Under physiological conditions, up to 5% of the oxygen reacts to superoxide (O2−) anions. O2− is oxidised to hydrogen peroxide (H2O2) catalysed by the antioxidative enzyme superoxide dismutase (SOD). H2O2 is subsequently broken down by the glutathione peroxidase (GPx) or catalase to H2O or H2O and O2 (Figueiredo et al., Reference Figueiredo, Mota, Appell and Duarte2008). Taking into account the impact of the mitochondria and the antioxidative enzymes on the proportion of Mb redox forms, an influence on the meat quality could be suggested. Therefore, in this study, the mitochondrial respiratory activities (MRA) and antioxidative enzyme activities of muscle samples collected from toms of a commercial turkey line slaughtered after 147 days were investigated. The aim of this study was to investigate the muscle (anti)oxidative processes after animal slaughter and its possible impact on meat quality.
Material and methods
Animals and sample collections
In all, 115 turkey toms (mean age: 147 days) of the genetic strain B.U.T. Big 6 (Big 6; Aviagen Ltd, Midlothian, United Kingdom) were slaughtered on three different slaughter dates between 12 November 2007 and 10 December 2007 (n = 37 or 38 per slaughter day) in a commercial turkey slaughter house. Immediately after stunning (150 mA, 4 s), bleeding was initiated by mechanical cutting of the a. carotis communis. After scalding (58–60°C, 45 s), the carcasses were defeathered and automatically eviscerated followed by veterinary meat inspection. Before entering the chilling room, the carcasses were removed from the slaughter chain and weighed. Following this, the left m. pectoralis superficialis (MPS) and the left leg were carefully excised from the carcasses by an experienced person and weighed after removal of the skin. The MPS and the leg muscles m. gastrocnemius (MG) and m. iliotibilialis lateralis (MIL) were used for further sample collection and analysis. All the samples were stored on ice until physico-chemical analysis or sample collections (antioxidative enzymes).
The investigated turkeys had carcass, breast and leg weights of 15.6 ± 1.4, 4.36 ± 0.71 and 4.43 ± 0.39 kg, respectively, whereas the breast and leg yields, related to the carcass weight, were 27.8% ± 2.7% and 28.5% ± 2.3%, respectively.
The determination of the MRA was performed with the MPS and MIL collected 20 min after slaughter and stored on ice in a storage buffer (SB; 15 mM phosphocreatine, 49 mM potassium morpholino-ethanesulphonic acid, 20 mM taurine, 20 mM imidazol, 5.2 mM ATP, 9.5 mM MgCl2, 3 mM potassium hydrogen phosphate, 0.5 mM dithiothreitol, pH 7.1) until analysis. For the analysis of antioxidative enzyme activities, MPS samples were collected 20 min and 48 h after slaughter, frozen in liquid nitrogen and stored at −70°C until analysis.
Methods
pH
The pH value was measured 20 min and 24 h after slaughter (p.m.) with a portable pH meter (pH-Star, Matthäus GmbH, Poettmes, Germany) equipped with a glass electrode (InLab 427, Mettler-Toledo, Urdorf, Switzerland). For the determination of the pH value, the electrode was inserted once in the centre of the MPS and MG, waiting at least 30 s until the pH value was nearly stable. As the pH24 h p.m. is an important characteristic during muscle-to-meat transition, the data sets were assorted by this parameter considering the least square mean values of this pH as threshold.
Electrical conductivity (EC)
The EC was measured 20 min and 24 h after slaughter (p.m.) with a portable EC meter (LF-Star, Matthäus GmbH). For the EC determination, the electrode was inserted in the centre of the MPS and MG.
Colour
The meat lightness (L*), redness (a*) and yellowness (b*) values were determined with a colorimeter (Minolta CR 400, Minolta GmbH, Langenhagen, Germany) 20 min, 24 h, 48 h and 72 h p.m. on the medial surface (bone side) of the MPS and on the lateral surface of the MIL (not 72 h p.m.). Each value was an average of at least five (MG) or three (MIL) measurements. In the results, only the L* and a* values are considered.
Drip loss
For determination of the drip loss, the MPS was weighed 11 and 72 h p.m., and the drip loss was calculated as the loss of weight and expressed in percentage. Between the measurements, the muscle was stored at 4°C in an individual plastic container.
MRA
The MRA of the MPS and MIL samples collected 20 min p.m. was determined as soon as possible within 24 h after sample collection using an Oxygraph (Oroboros, Innsbruck, Austria) equipped with a Clark electrode (Werner et al., Reference Werner, Natter, Schellander and Wicke2010). Because of the time limit, only 60 samples (n = 20 per slaughter) of the MPS and MIL were analysed. All steps were performed on ice with cold buffers, unless otherwise indicated. The samples were dissected in SB using two pairs of small cannulae. After dissection, the muscle fibres were permeabilised for 20 min in SB with saponin (50 μg/ml) and subsequently washed in incubation buffer (IB, 75 mM mannitol, 25 mM sucrose, 0.1 M KCL, 0.5 mM EDTA, 20 mM Tris, 5 mM MgCl2 × 6H2O, 10 mM KH2PO4 and 0.5 mM DTT, pH 7.4) freshly supplemented with fatty acid-free bovine serum albumin (BSA; 1 mg/ml). The fibres were carefully removed from the IB + BSA, dried on filter paper and weighed before transfer to the incubation chamber of the Oxygraph. The respiration measurement was performed at a temperature of 30°C in IB + BSA. The MRA was analysed with the substrate pyruvate/malate (Pyr 10 mM/ Mal 2 mM). State-3 respiration was initiated with 5 mM ADP and state-4 respiration with 28 μM carboxy-atractyloside (CAT) (Calbiochem GmbH, München, Germany). The weight-specific oxygen consumption (pmol O2/min mg sample weight) was calculated as the time derivative of the oxygen concentration using the software Datlab 4.1 (Oroboros). The respiratory control index (RCI) was calculated by dividing the state-3 respiration Pyr/Mal and the state-4 respiration rates.
Antioxidative enzyme activities
The frozen muscle samples were diluted 1 : 10 in phosphate buffered saline (2.68 mM KCL; 141.74 mM NaCl; 10.14 mM Na2HPO4; 1.76 mM KH2PO4) and homogenised on ice for 5 min at 1200 U/min with a Potter-Homogenisator (B. Braun Biotech International, Melsungen, Germany). Subsequently, the protein concentration was determined (Bradford, Reference Bradford1976), and the homogenate was adjusted to a protein concentration of 6 mg/ml for further enzyme activity analysis. The activities of the enzymes SOD, GPx and glutathione reductase (GR) were analysed photometrically at an incubation temperature of 30°C and a pH of 7.4. To prevent storage-related effects, the homogenate was kept on ice between the investigations, and the activity determinations were finished within 2 h after initial dilution of the frozen muscle samples. The enzyme activity analysis was performed at least in triplicates and the results were stated in U/g protein. The SOD activity was determined according to Simonovicova et al. (Reference Simonovicova, Tamas, Huttova, Siroka and Mistrik2004). Briefly, the enzyme xanthin oxidase (1 U/ml) catalyses the oxidation of xanthine (50 mM) to uric acid accompanied with the reduction of O2 to O2−. Within the assay, the O2− anion spontaneously reduces methylthiazolyldiphenyl-tetrazolium bromide (MTT; 70 mM) to MTT formazan, a reaction product with an absorbance maximum at 560 nm. As the SOD catalyses the dismutation of two O2− molecules to O2 and H2O2, the reduction to MTT formazan decreases with an increasing SOD activity. Therefore, SOD activity is calculated from the time-dependent difference between the MTT assay containing and not containing the homogenate. GPx was analysed using a modification of the coupled enzyme assay by Otto-Knapp et al. (Reference Otto-Knapp, Jurgovsky, Schierhorn and Kunkel2003). Within the test, GPx catalysed the H2O2 (0.05%)-dependent oxidation of reduced (glutathione, GSH; 0.1 mM) to oxidised glutathione (GSSG). The GPx activity was finally determined by following the oxidation of NADPH (0.15 mM) to NADP at 340 nm within the GR (1 U/ml) catalysed reduction of GSSG to GSH. GR was analysed according to Otto-Knapp et al. (Reference Otto-Knapp, Jurgovsky, Schierhorn and Kunkel2003) by following the oxidation of NADPH (0.3 mM) to NADP at 340 nm within the GR-catalysed reduction of GSSG (2 mM) to GSH.
Thiobarbituric acid-reactive substances (TBARS)
The concentration of TBARS was determined according to Du et al. (Reference Du, Cherian, Stitt and Ahn2002). Briefly, 500 mg of the frozen muscle samples was diluted 1 : 10 in deionised water and homogenised on ice for 2 min at 1500 U/min with a Potter-Homogenisator (B. Braun Melsungen). After addition of thiobarbituric acid (TBA; final concentration 0.28%), trichloroacetic acid (1.8%) and butylhydroxytoluene (0.07%), the solution was heated for 15 min at 100°C. After cooling down and centrifugation for 5 min at 2000×g, the supernatant was analysed photometrically at 521 nm. The TBARS concentration was expressed as ng malondialdehyde (MDA) per g tissue.
Chemicals
All chemicals were purchased from Sigma-Aldrich GmbH (Taufkirchen, Germany), unless otherwise indicated.
Statistical analysis
For the data analysis, the software Statistica 7.1 (StatSoft, Germany) was used. No significant (P < 0.05) influence of the slaughter days was found. Differences between the pH, EC and colour values, as well as enzyme activities and TBARS concentrations, at the different determination times were analysed with the t-test of dependent measures considering P < 0.05. Differences between the MRA of the MPS and MIL and the L* and a* values of the MPS and MG at the different determination times were also analysed with the t-test of dependent measures considering P < 0.05.
Results
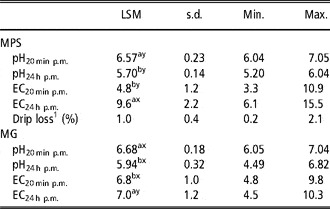
The pH values of both muscles decreased significantly (P < 0.05) between 20 min and 24 h p.m. However, the MG had higher (P < 0.05) pH values at both determination times in comparison with the MPS. The EC values increased significantly (P < 0.05) in both muscles with the ageing of the meat. Whereas the EC at 20 min p.m. was higher (P < 0.05) in the MG, the EC values increased more in the MPS, resulting in significantly (P < 0.05) higher values 24 h p.m. in this muscle in comparison with the MG. The drip loss of the MPS was 1.0% (Table 1).
LSM, s.d. as well as Min. and Max. values of the meat quality parameters determined in the MPS and MG of the investigated turkey toms (n = 115).

LSM = least square mean; s.d. = standard deviation; Min. = minimal; Max. = maximal; MPS = m. pectoralis superficialis; MG = m. gastrocnemius; p.m. = post mortem; EC = electrical conductivity (mS/cm).
1Drip loss was determined between 11 and 72 h p.m.
a,bLSM with different letters between the pH and EC values determined 20 min and 24 h p.m. differ significantly (P < 0.05).
x,yLSM with different letters between the pH and EC values of the MPS and MG at the same determination times differ significantly (P < 0.05).
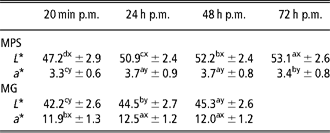
The L* values of the MG and MPS increased significantly (P < 0.05) during ageing of the meat. The MPS had generally higher lightness values in comparison with the MG. The a* values increased in the MPS and MG between 20 min and 24 h p.m. and remained on comparable (P > 0.05) levels during further ageing to 48 h p.m. In the MPS, the a* values decreased up to 72 h p.m. significantly (P < 0.05), but not to the level 20 min p.m. Comparing the redness results of the investigated muscles, the MG had 3.5-fold higher (P < 0.05) a* values than the MPS (Table 2).
LSM and standard deviations of the L* and a* values of the MPS and MG of the investigated turkey toms (n = 115) determined on the surface of the muscles 20 min, 24 h, 48 h and 72 h p.m. (only MPS)
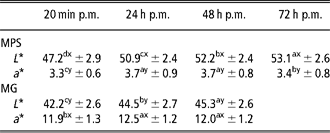
LSM = least square means; L* = lightness; a* = redness; MPS = m. pectoralis superficialis; MG = m. gastrocnemius; p.m. = post mortem.
a,b,c,dLSM with different letters between the determination times differ significantly (P < 0.05).
x,yLSM with different letters between the L*- and a*-values of the MPS and MG at the same determination times differ significantly (P < 0.05).
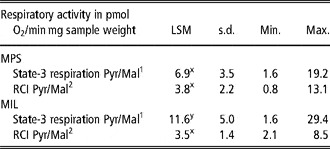
The MRA of the permeabilised muscle fibres from the MPS were with 6.9 pmol O2/min mg sample weight significantly (P < 0.05) lower in comparison with the MIL (11.6 pmol O2/min mg sample weight). The RCI values did not differ between the muscles (Table 3) because of higher state-4 respiration rates in the MIL (data not shown).
LSM, s.d., as well as Min. and Max. values of the mitochondrial respiratory activities analysed in permeabilised muscle fibres of the MPS and MIL of the investigated turkey toms (n = 60) collected 20 min after slaughter

LSM = least square means; s.d. = standard deviation; Min. = minimal; Max. = maximal; MPS = m. pectoralis superficialis; MIL = m. iliotibilialis; RCI = respiratory control index.
1The state-3 respiration Pyr/Mal was determined with the substrate combination pyruvate/malate.
2The RCI Pyr/ Mal was calculated by dividing the state-3 respiration Pyr/Mal and the state-4 respiration rates (data not shown).
x,yLSM of the respiratory activities and RCIs with different letters between the MPS and MIL differ significantly (P < 0.05).
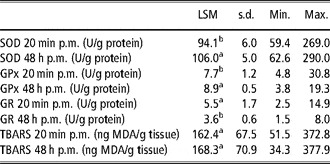
In Table 4, the activities of the antioxidative enzymes SOD, GPx and GR, as well as the TBARS concentration, determined in MPS samples collected 20 min and 48 h p.m. are presented. The SOD activities were the highest, followed by the activities of the GPx and GR, respectively. Between 20 min and 48 h p.m., the SOD and GPx activities increased significantly (P < 0.05), but the GR values decreased during ageing of the meat. The TBARS concentrations did not change (P > 0.05) between 20 min and 48 h p.m.
LSM, s.d., as well as Min. and Max. values of the SOD, GPx and GR activities as well as TBARS concentrations analysed in the MPS of the investigated turkey toms (n = 115)

LSM = least square means; s.d. = standard deviation; Min. = minimal; Max. = maximal; SOD = superoxide dismutase; GPx = glutathione peroxidase; GR = glutathione reductase; TBARS = thiobarbituric acid reactive substance; MPS = m. pectoralis superficialis; p.m. = post mortem; MDA = malondialdehyde.
a,bLSM with different letters between the 20 min and 48 h p.m. values of the different enzyme activities and the TBARS concentrations differ significantly (P < 0.05).
As the pH24 h p.m. is an important characteristic during muscle-to-meat-transition process and is clearly related to other parameters like drip loss or colour (Berri et al., Reference Berri, Le Bihan-Duval, Debut, Sante-Lhoutellier, Baeza, Gigaud, Jego and Duclos2007), the data sets were assorted with regard to those with pH values greater than (high-pH group), or less than 5.7 (low-pH group; Table 5). Considering the meat quality traits, significantly (P < 0.05) higher drip loss, L*24 h p.m. and L*48 h p.m. values could be found in samples with lower pH24 h p.m.. Other parameters such as the pH20 min p.m., EC24 h p.m., a*24 h p.m. and a*48 h p.m. values, as well as the enzyme activities, were comparable (P > 0.05) between the high- and low-pH groups. Only the activities of the SOD20 min p.m. were significantly (P < 0.05) higher in the low-pH group. The SOD48 h p.m. activities were tendentially (P = 0.15) higher and state-3 respiration rates tendentially (P = 0.16) lower in the samples with reduced pH24 h p.m. values (Table 5).
LSM (upper values) and s.d. (lower values) of different meat quality parameters, state-3 respiration rates, RCI and enzyme activities of the SOD, GPx and GR in breast muscles collected 20 min and 48 h after slaughter (p.m.) after assorting the data sets considering the LSM of the pH24 h p.m. determined in the MPS

LSM = least square means; s.d. = standard deviation; RCI = respiratory control index; SOD = superoxide dismutase; GPx = glutathione peroxidase; GR = glutathione reductase; p.m. = post mortem; MPS = m. pectoralis superficialis; EC = electrical conductivity in mS/cm; L* = lightness; a* = redness; s.w. = sample weight.
P-value less than 0.05 (bold marked) was considered significant.
1Drip loss (in %) was determined between 11 h and 72 h p.m.
2EC = electrical conductivity in mS/cm.
3L* and a* values were determined on the bone side of the MPS.
4The state-3 respiration (in pmol O2/min mg s.w.) was determined with the substrate combination pyruvate/ malate.
5The RCI Pyr/Mal was calculated by dividing the state-3 respiration Pyr/Mal and the state-4 respiration rates (data not shown).
6Enzyme activities in U/g protein.
7n = 21 for the state-3 respiration rates and RCI.
8n = 39 for the state-3 respiration rates and RCI.
Discussion
The presented pH decrease and EC increase during ageing of the meat are in accordance with the results of Sante and Fernandez (Reference Sante and Fernandez2000), Le Bihan-Duval et al. (Reference Le Bihan-Duval, Berri, Baeza, Sante, Astruc, Remignon, Le Pottier, Bentley, Beaumont and Fernandez2003), Fraqueza et al. (Reference Fraqueza, Cardoso, Ferreira and Barreto2006), Duclos et al. (Reference Duclos, Berri and Le Bihan-Duval2007) or Werner et al. (Reference Werner, Riegel and Wicke2008). The pH differences between the MPS and MG are in accordance with the publications of Fernandez et al. (Reference Fernandez, Sante, Baeza, Le Bihan-Duval, Berri, Remignon, Babile, Le Pottier, Millet, Berge and Astruc2001) and Le Bihan-Duval et al. (Reference Le Bihan-Duval, Berri, Baeza, Sante, Astruc, Remignon, Le Pottier, Bentley, Beaumont and Fernandez2003), which also presented higher pH20 min p.m. and pH24 h p.m. values in the leg muscle m. iliotibialis. The biochemical differences between the muscles seem to be related to the different muscle structures of the MPS and MG. In turkeys, the MPS only consists of FTG fibres (Opalka et al., Reference Opalka, Wicke, Gellerich, Schmidt, Rosner, Zierz and von Lengerken2004; Branciari et al., Reference Branciari, Mugnai, Mammoli, Miraglia, Ranucci, Dal Bosco and Castellini2009). Leg muscles such as the MG also have fast-twitch oxidative (FTO) and STO fibres (Papinaho et al., Reference Papinaho, Ruusunen, Suuronen and Fletcher1996; Remignon et al., Reference Remignon, Zanusso, Albert and Babile2000). Also taking into account the results of Opalka et al. (Reference Opalka, Wicke, Gellerich, Schmidt, Rosner, Zierz and von Lengerken2004), which presented a higher oxidative energy metabolism in the MIL, and the present results with a higher MRA of the MG, it could be concluded that shortly after slaughter the glycogen in the MG is degraded to a higher extent via citrate cycle and ETC in comparison with the MPS accompanied with lower lactate accumulation and higher pH, as shown by Fernandez et al. (Reference Fernandez, Sante, Baeza, Le Bihan-Duval, Berri, Remignon, Babile, Le Pottier, Millet, Berge and Astruc2001). The EC values determined 24 h p.m. support this assumption, as this parameter is negatively correlated with the pH (Werner et al., Reference Werner, Riegel and Wicke2008).
The presented higher lightness values in both muscles during ageing of the meat are in accordance with investigations by Berri et al. (Reference Berri, Wacrenier, Millet and Le Bihan-Duval2001), Molette et al. (Reference Molette, Serieye, Rossignol, Babile, Fernandez and Remignon2006) and Petracci and Fletcher (Reference Petracci and Fletcher2002) in broiler. The change is influenced by the decreasing pH values. Owens et al. (Reference Owens, Hirschler, McKee, Martinez-Dawson and Sams2000), Petracci et al. (Reference Petracci, Betti, Bianchi and Cavani2004) and Berri et al. (Reference Berri, Le Bihan-Duval, Debut, Sante-Lhoutellier, Baeza, Gigaud, Jego and Duclos2007) showed a negative correlation between the pH and the lightness of the meat. The pH values also explain the lightness differences between the MPS and MG, as the MG had generally higher pH values. In addition to the pH, further reasons for the differences between the investigated muscles are the Mb content of the meat and the proportion of the Mb redox forms, especially met-Mb. The Mb content of muscles with lower L* values is higher (Boulianne and King, Reference Boulianne and King1998) and this is influenced by the muscle structure. As already stated by different authors (Papinaho et al., Reference Papinaho, Ruusunen, Suuronen and Fletcher1996; Remignon et al., Reference Remignon, Zanusso, Albert and Babile2000), the MG not only consists of FTG such as the MPS, but also of FTO and STO fibres. Because of this, the MG has higher Mb concentrations (Castellini et al., Reference Castellini, Mugnai and Dal Bosco2002) and lower L* and higher a* values, as shown in this study. The proportion of the Mb redox forms is influenced by the oxidative status, especially with regard to the production of ROS. It could be suggested that the increased ROS content raised the met-Mb concentrations, as shown by Guidi et al. (Reference Guidi, Castigliego, Benini, Armani, Iannone and Gianfaldoni2006) in turkeys and Ryu et al. (Reference Ryu, Rhee, Lee and Kim2005) in broiler. The heme of the met-Mb contains oxidised Fe3+, which is responsible for the brownish colouration of the meat (Mancini and Hunt, Reference Mancini and Hunt2005) and therefore for the increase of the L* values. However, the increasing a* values in the MPS and MG between 20 min p.m. and 24 h p.m., which was also shown in broiler by Petracci and Fletcher (Reference Petracci and Fletcher2002), are quite contradictory to the latter assumption.
Determination of the MRA is a method to investigate oxygen consumption of the tissue and has been analysed in muscle/meat samples from poultry (Tang et al., Reference Tang, Iqbal, Cawthon and Bottje2002; Opalka et al., Reference Opalka, Wicke, Gellerich, Schmidt, Rosner, Zierz and von Lengerken2004; Bottje and Carstens, Reference Bottje and Carstens2009). Using the skinned fibre technique, Opalka et al. (Reference Opalka, Wicke, Gellerich, Schmidt, Rosner, Zierz and von Lengerken2004) also showed significantly higher MRAs in the MIL in comparison with the MPS, and this difference is related to the higher percentage of oxidative FTO and STO fibres in the leg muscle and the accompanied increasing oxidative metabolism, as already discussed in the previous chapter.
In many studies, the activities of antioxidative enzymes or the oxidative status in poultry meat were investigated in relation to the feeding (Maraschiello et al., Reference Maraschiello, Sarraga and Regueiro1999; Renerre et al., Reference Renerre, Poncet, Mercier, Gatellier and Metro1999; Sarraga et al., Reference Sarraga, Carreras, Regueiro, Guardia and Guerrero2006), but investigations during muscle-to-meat transition in turkeys have not been published until now. As Sarraga et al. (Reference Sarraga, Carreras, Regueiro, Guardia and Guerrero2006) presented comparable SOD and GPx activities in leg and breast muscles of turkeys, in this study only data from the MPS were considered. However, the increase of the antioxidative enzyme activities between 20 min and 48 h p.m. is difficult to explain. After slaughter, a proteolysis in combination with missing resynthesis of the different enzymes would be expected. This is probably true for this study, especially with regard to the GR, but the data also show that the antioxidative enzymes SOD and GPx were activated during storage of the turkey meat. Especially the SOD, which had 15- to 20-fold higher activities than the GPx and GR, is very important, as it oxidises O2− to H2O2 – a key step within the reduction of ROS (Buettner et al., Reference Buettner, Ng, Wang, Rodgers and Schafer2006). This increase in the antioxidative properties agrees with the simultaneous higher concentrations of TBARS, an indicator for the lipid oxidation and the ROS content within the tissue after slaughter, as presented by McKibben and Engeseth (Reference McKibben and Engeseth2002) and Jo et al. (Reference Jo, Nam, Min, Ahn and Lee2007) in turkeys and by Ryu et al. (Reference Ryu, Rhee, Lee and Kim2005) and Castellini et al. (Reference Castellini, Dal Bosco, Mugnai and Pedrazzoli2006) in broiler. O2− and H2O2 are related to the lipid peroxidation in turkey meat (Ahn and Kim, Reference Ahn and Kim1998). However, the similar TBARS levels at 20 min and 48 h p.m. in this study, which was also presented by Zhu et al. (Reference Zhu, Lee, Mendonca and Ahn2004) in turkeys and by Ryu et al. (Reference Ryu, Rhee, Lee and Kim2005) and Jang et al. (Reference Jang, Liu, Shin, Lee, Lee, Lee and Jo2008) in broiler, are contradictory to these conclusions. It could be suggested that the higher antioxidative enzyme activities within the meat reduce the ROS production accompanied with a missing significant increase of the TBARS concentrations. Further investigations are necessary and under progress to clarify this suggestion.
The assortment of the present data with regard to the mean pH24 h p.m. of the MPS was done because results of El Rammouz et al. (Reference El Rammouz, Babile and Fernandez2004) in turkeys and Berri et al. (Reference Berri, Le Bihan-Duval, Debut, Sante-Lhoutellier, Baeza, Gigaud, Jego and Duclos2007) in broiler showed that this pH is negatively correlated to L*, and the drip loss values, which was also shown in this study. However, there is a controversial discussion about the impact of pH20 min p.m. in the literature, because this parameter is less related to poultry meat quality, whereas in pork pH is the most important factor for detecting PSE meat (Scheffler and Gerrard, Reference Scheffler and Gerrard2007; Petracci et al., Reference Petracci, Bianchi and Cavani2009). The pH influences the water-binding properties and the lightness by changing the myogenic protein network within the muscle fibres (Duclos et al., Reference Duclos, Berri and Le Bihan-Duval2007; Petracci et al., Reference Petracci, Bianchi and Cavani2009; Grashorn, Reference Grashorn2010). However, the pH effects on the drip loss and lightness are not related to a rapid pH decrease like in pork, as the pH20 min p.m. was comparable. The extension of the pH development, resulting in different final pH results, is more important in poultry meat (Fraqueza et al., Reference Fraqueza, Cardoso, Ferreira and Barreto2006; Berri et al., Reference Berri, Le Bihan-Duval, Debut, Sante-Lhoutellier, Baeza, Gigaud, Jego and Duclos2007). The tendentially reduced MRA in samples with a lower pH24 h p.m. indicates the impact of pH on these parameters, probably by changing proteins/enzymes within the ETC. As the ETC of the mitochondria is the main source of ROS, a reduced oxidative phosphorylation, because of the lower pH, increases the ROS production accompanied with the activation of the antioxidative enzymes like SOD, GPx and GR (Figueiredo et al., Reference Figueiredo, Mota, Appell and Duarte2008). This assumption might explain the higher activities of the SOD20 min p.m. in the samples with lower pH24 h p.m. However, increasing concentrations of ROS can damage the proteins of the ETC itself, thereby reducing the MRA (Figueiredo et al., Reference Figueiredo, Mota, Appell and Duarte2008), and Loh et al. (Reference Loh, Tsai, Tsai, Chen, Hong, Wei, Cheng and Lin2002) presented that peroxides decrease the pH values in the tissue (circulus vitiosus). It is quite difficult to clarify whether the mitochondria in the samples are primarily altered because of the effects of the ROS and pH or secondarily because of the differences in the pH reduction after slaughter of the animals. Therefore, muscle samples of living birds and the associated post-mortem meat samples should be investigated.
In conclusion, commercial turkey toms showed a reduction of the pH values in MPS and MG between 20 min and 24 h after slaughter, but only an increase of the EC values in the MPS. The pH values were generally higher in the MG. The lightness values of both investigated muscles increased during ageing of the meat, whereas the redness increased only between 20 min p.m. and 24 h p.m. However, the MG had at all determination times lower L* and higher a* values in comparison with the MPS. It can be concluded that all these results, and the higher MRA values of the MIL, are related to the structural differences between the leg muscles of MG and MIL and the MPS of the turkey toms with smaller muscle fibre diameter, the appearance of STO and FTO fibres and the accompanied higher Mb concentrations in the leg muscles. The presented increase of the antioxidative enzyme activities after slaughter marked by higher SOD and GPx enzyme activities at 48 h p.m. show that the oxidative processes after slaughter are very important. However, the missing changes in the TBARS concentrations indicate that the high antioxidative capacity of the tissue prevents a clear increase of the lipid oxidation. According to the results obtained by other authors, it could be suggested that a lower pH24 h p.m. of the MPS affects meat quality with higher drip loss and lightness values. The tendentially lower MRA and, in contrast, higher antioxidative capacity of the meat indicate the impact of pH on the (anti)oxidative status within the meat or vice versa, but further investigations are necessary to explain the assumptions.
Acknowledgements
The authors would like to thank the Ministry of Science and Culture of Lower Saxony and the Volkswagen Foundation for the financial support of the investigation.