I. INTRODUCTION
TiO2 is one of the most intensively studied semiconducting materials with many technical applications in photoelectrochemical solar energy conversion and environmental photocatalysis because of its high efficiency, low cost, and photostability.Reference Fujishima, Rao and Tryk1, Reference Fujishima and Honda2 Among the many solar energy-related applications, TiO2 has been used in dye-sensitized solar cells (DSSCs), which have achieved overall conversion efficiencies of over 11% and are expected to be a promising alternative to conventional monocrystalline silicon-based solar cells.Reference O’Regan and Grätzel3–Reference Chen, Huang, Cheng and Caruso7 With the development of nanotechnology, many studies have explored TiO2 in the nanoscale and have demonstrated that the photoactivity of TiO2 is strongly particle size-dependent.Reference Li, Li, Boerio-Goates and Woodfield8–Reference Jang, Kim and Kim11 Smaller particles have a better catalyst performance and conductive properties due to their larger surface area. However, there are both advantages and disadvantages associated with using smaller or larger TiO2 particles in DSSCs, which influence the performance of the solar cells, and therefore size control during synthesis is important.Reference Chou, Zhang, Russo, Fryxell and Cao12 The most efficient electrodes in DSSCs have been found to be 10-μm thick mesoporous TiO2 films with three-dimensional network of interconnected 20-nm nanocrystals.Reference Grätzel5 Besides the particle size, it was found that the crystallinity also needed to be optimized to improve the photoactivity of TiO2.Reference Simonsen, Jensen, Li and Søgaard13 Based on nanoparticles synthesized in a continuous flow supercritical reactor, we have recently achieved DSSC efficiencies of about 8.5%,Reference Li, Luo, Li, Mi, Sø, Hald, Meng and Iversen14 and also demonstrated that such particles are superior to the benchmark Evonik (previously known as Degussa)-produced P25 titania nanoparticles during photocatalytic degradation of organic dyes.Reference Fan, Chen, Li, Luo, Lock, Jensen, Mamakhel, Mi, Iversen, Meng and Iversen15
A variety of methods have been developed for the synthesis of anatase TiO2, including sol–gel,Reference Jagadale, Takale, Sonawane, Joshi, Patil, Kale and Ogale16–Reference Sauvage, Chen, Comte, Huang, Heiniger, Cheng, Caruso and Graetzel18 anodization,Reference Mor, Varghese, Paulose, Shankar and Grimes19 gas-phase synthesis,Reference Chin, Park, Kim, Bae and Jurng20 solvothermal synthesis,Reference Wahi, Liu, Falkner and Colvin21 and hydrothermal technique.Reference Kartini, Menzies, Blake, da Costa, Meredith, Riches and Lu22 However, these methods are always time-consuming and have high manufacturing cost, and thereby they are not attractive for commercial TiO2 nanoparticle production. Synthesis in supercritical or near-critical solutions is an efficient method for producing highly crystalline nanoparticles with a controllable size and a narrow size distribution.Reference Adschiri, Kanazawa and Arai23 Supercritical fluids have gas-like transport properties in diffusivity, viscosity and surface tension, while maintaining liquid-like properties such as high-solvation capability and density, and this makes them attractive solvents in chemical processes. Continuous supercritical flow synthesis has been developed for the production of different metal oxides and metal nanoparticles.Reference Hald, Becker, Bremholm, Pedersen, Chevallier, Iversen and Iversen24–Reference Kawasaki, Xiuyi, Sue, Hakuta, Suzuki and Arai27 Moreover, the manufacturing costs of continuous flow synthesis are relatively low and the production can easily be scaled up due to the quick synthesis, whenever feasibility for commercial production is established for any new metal oxide or metal nanoparticle. In an earlier study, we reported on continuous flow synthesis of TiO2, and demonstrated that highly crystalline particles with very narrow size distribution could be made.Reference Hald, Becker, Bremholm, Pedersen, Chevallier, Iversen and Iversen24 Subsequently, we examined the influence of the mixing geometry on the TiO2 nanoparticle properties.Reference Toft, Aarup, Bremholm, Hald and Iversen28 Recently, Kawasaki et al. also reported a study of continuous supercritical hydrothermal synthesis of TiO2 using KOH to control the particle size.Reference Kawasaki, Xiuyi, Sue, Hakuta, Suzuki and Arai27 For fully covering the parameter space, we have produced a broad range of new TiO2 synthesis results on our reactor. When accumulating these data together with previously published results, comprehensive and important information becomes available. One purpose of the present study is to provide short easy “cook book” recipes for preparation of large amounts of TiO2 nanocrystals with specific crystallite size and crystallinity. Although, several studies, as mentioned above, have reported on supercritical synthesis of titania nanocrystals, no studies have provided easy and reliable synthesis recipes for a full range of particles with controlled properties. We envision that if such size- and crystallinity-controlled particles become widely available, they can be used in numerous derived studies and applications. Such applications not only cover traditional physical and chemical applications (semiconductor, catalysis, DSSCs, etc.), but also derived studies using such nanoparticles in the context of toxicology or medical applications, where size control is an important parameter.
Another important area is to engineer the band gap of TiO2 nanoparticles to improve their photocatalytic efficiency. Many studies have focused, e.g., on metal doping.Reference Choi, Park and Hoffmann29, Reference Wang, Bahnemann and Dohrmann30 Some studies have shown that there was no effect of the dopants on the crystal structure,Reference Jeong, Borse, Jang, Lee, Jung, Chang, Jin, Won and Kim31 while others have suggested that the metal ions, such as Fe3+, Pt4+, Cr3+, and V3+, may occupy the titanium sites in the anatase TiO2 structure due to the comparable ionic radii with Ti4+.Reference Choi, Park and Hoffmann29, Reference Luu, Nguyen and Ho32, Reference Naeem and Ouyang33 However, this is not well established since there is no evident change of lattice parameters after doping. So far very few studies have focused on synthesis of metal-doped titania nanoparticles using supercritical flow methods. Herein, we also report on the synthesis and structure of iron-doped TiO2 nanocrystals.
II. EXPERIMENTAL SECTION
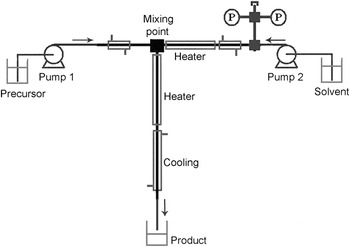
All chemical reagents used in the experiments were of analytical grade. The Ti precursor used in the present study was a titanium tetra isopropoxide (TTIP) isopropanol solution with different concentrations. Isopropanol–water mixtures with water percentages ranging from 2 to 100 mol% were used as solvents. The continuous flow synthesis was carried out in a custom-designed T-type reactor as shown in Fig. 1, which has been described in our recent study as well.Reference Mi, Jensen, Hald, Overgaard, Christensen and Iversen34 The setup is similar to our studiesReference Hald, Becker, Bremholm, Pedersen, Chevallier, Iversen and Iversen24 but with some further modification. All the experiments in the present study were performed under a pressure of 250 bar. The reactor was first pressurized with solvent and heated to working temperature. During the synthesis, a cold stream of precursor solution is injected from one side to meet a stream of preheated from the other side. The reaction takes place immediately upon mixing. Unless otherwise specified, the flow rates were 10 mL/min for both the Ti precursor and the solvent. The residence time in the heater after the mixing point was around 10 s. For samples with Fe doping, ferric nitrate [Fe(NO3)3]–isopropanol solution was pumped to the reactor using a third pump. The products were collected and washed with distilled water and ethanol by centrifugation and dried at 120 °C for 6 h. The products were then analyzed by powder x-ray diffraction (XRD) on a STOE powder diffractometer (STOE, Darmstadt, Germany) using Cu Kα radiation (λ = 1.5406 Å), and the morphology of the products was observed on a Philips CM20 transmission electron microscope (TEM; Philips, Eindhoven, Netherlands). The reflectance diffusion spectra were recorded by a UV-3600 UV-VIS-NIR spectrophotometer (SHIMADZU, Kyoto, Japan) with an ISR-3100 integrating sphere attachment to establish the optical band gap. Barium sulfate was used as a standard. Elemental composition determination was conducted by x-ray fluorescence (XRF) on a SPECTRO XEPOS (Kleve, Germany).
Sketch of the continuous flow setup for supercritical synthesis.

III. RESULTS AND DISCUSSION
A. Anatase TiO2
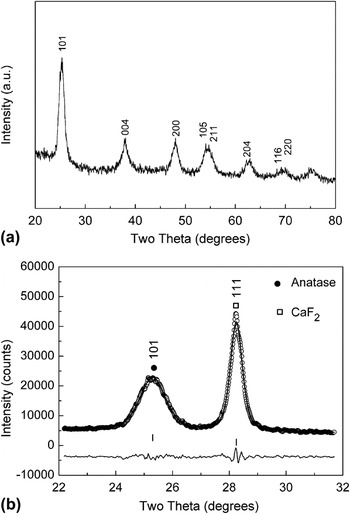
Figure 2(a) is a typical XRD pattern of the TiO2 powders prepared using 1 M TTIP as precursor and 100% water as solvent at a synthesis temperature of 350 °C. All the diffraction peaks can be indexed to anatase TiO2 [Joint Committee on Powder Diffraction Standards specifications, JCPDS 21-1272]. The average crystallite size was calculated from the most intense diffraction peak (101) using the Scherrer’s equation through fitting the peak by a Lorentzian function.Reference Fan, Chen, Li, Luo, Lock, Jensen, Mamakhel, Mi, Iversen, Meng and Iversen15 A silicon standard was used to correct for the instrumental broadening. For determining the crystallinity, the TiO2 sample was mixed with an internal standard 100% crystalline calcium fluoride (CaF2). Figure 2(b) is the XRD pattern of the mixture showing the (101) peak of TiO2 and (111) peak of CaF2. A pseudo-Voigt function was used to calculate the intensities of these two peaks. Based on the results and the mass fraction between TiO2 and CaF2, the crystallinity of TiO2 was then determined.Reference Fan, Chen, Li, Luo, Lock, Jensen, Mamakhel, Mi, Iversen, Meng and Iversen15 The calculated crystallite size and crystallinity are 8.2 nm and 86% respectively for the sample prepared using 1 M TTIP as precursor and 100% water as solvent at 350 °C. For investigating the morphology-related effect, the crystallite size of 6.9 nm was calculated from the diffraction peak of (200) of the above sample, indicating that the anisotropic growth is not evident for the TiO2 crystals in supercritical or near-critical conditions.
(a) PXRD pattern of the TiO2 nanopowders prepared using 1 M TTIP as precursor and 100% water as solvent at the synthesis temperature of 350 °C. (b) Observed and calculated XRD patterns and the difference profile of TiO2 mixed with CaF2 showing the (101) peak of TiO2 and (111) peak of CaF2.

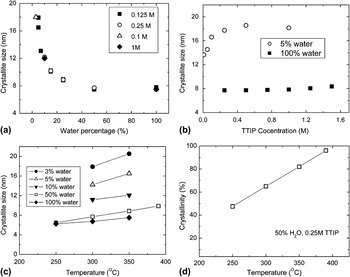
Figure 3(a) shows the crystallite sizes of TiO2 samples prepared using different TTIP concentrations at 350 °C as a function of water percentage in the solvent. It is found that the crystallite size can be controlled by varying the water percentage in the solvent, and almost identical sizes are obtained even when varying the TTIP concentration an order of magnitude from 0.1 to 1 M. Thus, the flow synthesis can be carried out with very high concentration making it fast to produce large amounts even in laboratory-scale reactors. The crystallite size increases with decreasing water percentage. The reaction that is taking place involves the hydrolysis of TTIP and a dehydration process to generate TiO2. The properties such as diffusivity of the supercritical/near-critical fluids should affect the crystal growth of TiO2, while the water fraction in the solvent TiO2 should affect the crystal formation. A larger fraction of water will result in quick hydrolysis reaction and more TiO2 crystals will be formed. Accordingly, the crystallite size will be smaller. The concentration of TTIP does not seem to affect the final crystallite size very much. Only when the precursor is much diluted and the water percentage is low, the concentration will play an important role on the crystallite size as shown in Fig. 3(b). The effect of the synthesis temperature on crystallite size is shown in Fig. 3(c). The crystallinity was found to be highly temperature-dependent. Figure 3(d) shows the temperature dependence of the crystallinity of TiO2 prepared using 0.25 M TTIP and 50% water in the solvent. It is found that an increase of the ratio between the flow rate of solvent and precursor will result in improved crystallinity as well. For meeting potential practical applications, the reproducibility of the synthesis was also tested. Several of the syntheses were repeated on different occasions and showed very good reproducibility. For example, the crystallite sizes are 8.2, 8.5, 8.1 nm for the different TiO2 samples prepared at the same condition using 0.5 M TTIP as precursor and 100% water as solvent at a synthesis temperature of 350 °C. Furthermore, the stability was verified in production runs, where several hundred of grams were produced.
(a) Crystallite size as a function of the water percentage in the solvent for TiO2 samples prepared at 350 °C using different TTIP concentrations from 0.1 to 1 M. (b) Crystallite sizes as a functions of TTIP concentration at a synthesis temperature of 350 °C. (c) The synthesis temperature dependence of the crystallite size. (d) Temperature dependence of the crystallinity of TiO2.

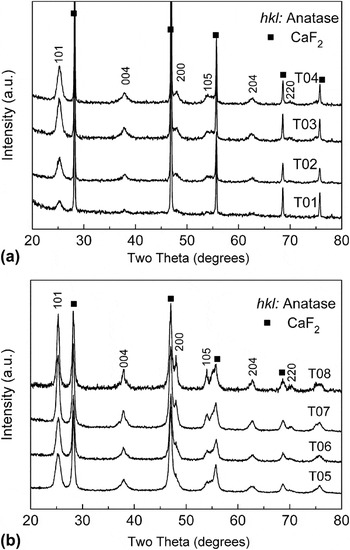
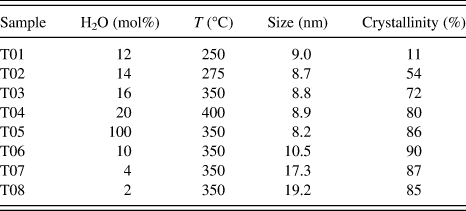
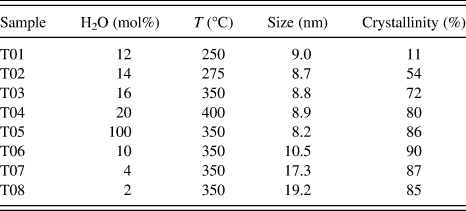
Figure 3 provides reaction conditions for synthesis of TiO2 nanoparticles at a given size and crystallinity in our reactor. As a proof of principle, we have synthesized two series anatase TiO2 nanoparticles using 1 M TTIP precursor by adjusting the synthesis parameters as shown in Table I. Samples T01–T04 have identical particle sizes with varied crystallinity, whereas samples T05–T08 have the same crystallinity with different particle sizes. For the improvement of crystallinity, the flow rates of samples T05–T08 were adjusted to 5 mL/min for the Ti precursor and 15 mL/min for the solvent, whereas the other experiments were performed at the flow rates of 10 mL/min for both precursor and solvent. Figure 4 shows the x-ray powder diffraction (PXRD) patterns of the TiO2 samples mixed with similar amount of CaF2. The differences of intensity and broadening of the diffraction peaks indicate that the crystallinity increases from T01 to T04 and the crystallite size increases from T05 to T08. The calculated crystallite sizes and crystallinities are listed in Table I. From the results of samples T05–T08, the factor of water percentage in the solvent does not seem to affect the crystallinity very much. An increase of the ratio between the flow rate of solvent and precursor will result in higher crystallinity. Samples T05–T08 prepared at 350 °C with higher solvent and precursor flow rates have higher crystallinity compared with that of sample T04 which was prepared at 400 °C. Note that, as shown in Fig. 4, it may be problematic to compare the crystallinities between T01–T04 and T05–T08 because the CaF2 powders used as standards are different in these two series. The standard used in T05–T08 is in nanoscale, and the standard used in T01–T04 is in microscale. However, both standards were well calcined and assumed to be 100% crystalline.
PXRD patterns of the TiO2 samples T01–T04 (a) and T05–T08 (b) mixed with CaF2.

Continuous flow synthesis parameters as well as crystallite sizes and crystallinities derived from PXRD data.
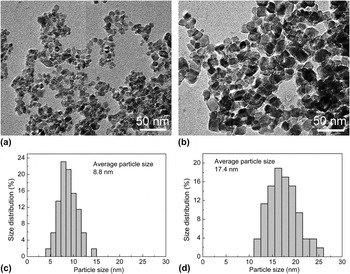
Figures 5(a) and 5(b) show the TEM images of samples T05 and T08 to visually demonstrate the typical particle morphologies and sizes. The particles of both samples are highly crystalline and the morphology and particle size are very uniform for each sample. The images directly illustrate the high homogeneities that can be obtained for products prepared by supercritical/near-critical synthesis. The average particle sizes are around 8.8 nm for T05 and 17.4 nm for T08, respectively, as obtained by estimating the sizes of 50 particles in the TEM images. This is in excellent agreement with the PXRD results. Figures 5(c) and 5(d) are the size distributions derived from the TEM images of Figs. 5(a) and 5(b), respectively, showing quite narrow size distributions for both samples.
TEM images of the TiO2 nanoparticles for sample T05 (a) and T08 (b). Size distributions of T05 (c) and T08 (d).

B. Fe-doped anatase TiO2
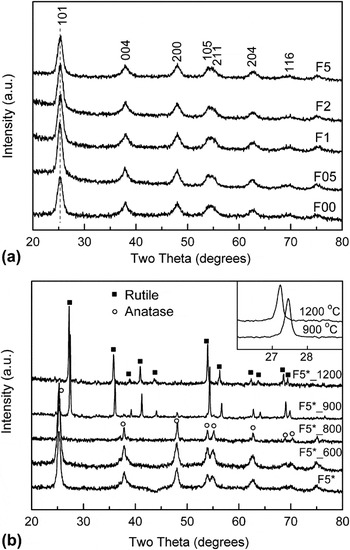
TiO2 with different concentration of Fe doping were prepared. F00, F05, F1, F2, and F5 are the samples with Fe content of 0, 0.5, 1, 2, and 5 mol% prepared by the same condition as sample T05 using 100 mol% water as solvent at the reaction temperature of 350 °C. Figure 6(a) is the XRD patterns showing that all the Fe-doped TiO2 samples are single anatase phase. The calculated crystallite sizes are 8.4, 8.7, 8.7, 8.5, and 8.3 nm for F00, F05, F1, F2, and F5, respectively, which are almost identical to each other. The positions of each diffraction peak of the Fe-doped samples F05, F1, F2, and F5 are identical to those of undoped sample F00. The result indicates that Fe probably has not replaced Ti in the crystal structure of TiO2. Another sample, F5*, with 20 nm crystallite size and 5% Fe doping, was prepared using the same conditions as for T08 at a reaction temperature of 350 °C and with isopropanol–water (2 mol% water) as solvent. Sample F5* allows us to do a refinement of the pattern, and the calculated cell parameters [a = 3.7891(3), c = 9.4987(7) Å] are comparable to those of undoped sample T08 [a = 3.7833(3) Å, c = 9.5037(8) Å]. Sample F5* was further heat-treated to different temperatures. Figure 6(b) shows the XRD patterns of sample F5* and samples after heat treatment at 600, 800, 900, and 1200 °C. Samples F5*_600 and F5*_800 treated at 600 and 800 °C remain anatase phases with almost unchanged room temperature cell parameters, a = 3.7890(2) Å, c = 9.5044(8) Å, and a = 3.7814(3) Å, c = 9.5028(8) Å, respectively. Rutile phase was formed for sample F5*_900, with cell parameters of a = 4.5917(6) Å, c = 2.9581(5) Å. When the temperature further increased to 1200 °C of sample F5*_1200, the peak positions of the rutile phase shifted to low 2θ angles and the cell parameters of a = 4.6255(5) Å, c = 2.9754(5) Å are much larger than those of the sample F5*_900. The above results further verify that the Fe3+ ions are not doped in the anatase TiO2 structure of the as-prepared powders. The Fe ions can only be inserted into the rutile structure when the sample is heated to high temperatures due to the large formation energy of the FexTi2−xO2 solid solution. Other Fe-doped samples show similar characteristics as F5*. The XRF results show that the Fe concentrations are 0.4(1), 0.8(1), 1.2(2), 4.2(4), 5.1(4) mol% for F05, F1, F2, F5, and F5*, respectively, which confirms the presence of Fe in the products. As a result, Fe must exist in a secondary phase which is undetermined by the XRD even for the samples with Fe concentrations of 5 mol%.
(a) PXRD patterns of Fe-doped samples F00, F05, F1, F2, and F5 with Fe content of 0%, 0.5%, 1%, 2%, and 5%, respectively. (b) PXRD patterns of sample F5* and samples that after heat treatment at 600, 800, 900, and 1200 °C, respectively.

A modified Kubelka–Munk function was used for determining the band gap energy (Eg) of the Fe-doped samples from the diffuse reflectance spectraReference Valencia, Marín and Restrepo35, Reference López and Gómez36:
 $${\rm{(F(}}R{\rm{)}} * hv{\rm{)}}^{{\rm{1/n}}} \,{\rm{ = }}\,B(hv - Eg{\rm{),}}$$
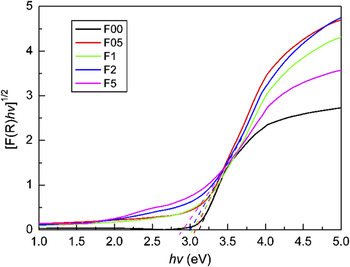
where h is the Planck’s constant, v is the light frequency, B is a constant, F(R) = (1 − R)2/2R, R is the reflectance. n can take different values depending on the type of electronic transition, where n = 2 for an indirect allowed transition and n = 1/2 for a direct allowed transition. Anatase TiO2 has been suggested to follow an indirect transition,Reference Choi, Park and Hoffmann29 thus n = 1/2 is used in this study. Figure 7 plots the (F(R) × hv)1/2 versus hv curve. The value of the band gap energy (E g) can be obtained by extrapolating the linear part of the curve to the horizontal axis (hv axis). The indirect type transition show band gap values of 3.15, 3.12, 3.09, 3.01, and 2.87 eV for samples F00, F05, F1, F2, and F5, respectively, suggesting that the band gap decreases with increasing Fe content even though Fe3+ ions are not likely to replace the Ti4+ sites in the crystal structure of the as-prepared nanoparticles. However, the absorbance spectra could suggest two phases are present because of the increased absorbance at sub TiO2 band gap energies with increasing Fe concentration. The apparent decrease in the band gap could then arise because of the overlap in the absorption between the TiO2 phase and the undetermined Fe phase.
Absorbance spectra for the indirect transition [F(R)hv]1/2 versus hv of the Fe-doped samples F00, F05, F1, F2, and F5.

IV. CONCLUSIONS
Anatase TiO2 nanocrystals were prepared by a continuous flow supercritical synthesis method, which is a quick method easily scalable to commercial production. The average crystallite size can be well controlled by adjusting the ratio between isopropanol and water in the solvent, whereas crystallinity is mainly controlled by the reaction temperature. The present data provide a recipe for synthesis of anatase nanocrystals covering a wide range in size and crystallinity. As proof of concept two series of particles with constant size and varying crystallinity as well as constant crystallinity and varying size were synthesized and characterized. The present synthesis method allows the use of quite high TTIP precursor concentration making it easy to prepare large batches of particles for derived studies. For Fe-doped TiO2, the iron atoms do not appear to be included in the anatase crystal structure, although the band gap decreases with increasing of Fe content.
ACKNOWLEDGMENTS
This work was supported by the Danish National Research Foundation (Center for Materials Crystallography), the Danish Strategic Research Council (Center for Energy Materials), and the Danish Research Council for Nature and Universe (Danscatt).