1 Introduction
In Mandarin Chinese, the high front vowel [i] does not appear after the dental and retroflex sibilants. Instead of the sequences [si
tsi
ts
h
i ʂi
tʂi
tʂhi], the consonantal gesture continues throughout the following voiced period, creating a sequence of a sibilant followed by a homorganic voiced segment. Despite a few articulatory and acoustic studies, debate about the phonetic and phonological aspects of the segments following these sibilants has not been settled. The controversies can be partly seen in the variety of names given to those segments by different scholars: syllabic fricatives (Wiese Reference Wiese, Wang and Smith1997, Duanmu Reference Duanmu2000), apical vowels (Karlgren Reference Karlgren1915–16), fricative vowels (Ladefoged & Maddieson Reference Ladefoged and Maddieson1996, Ao Reference Ao1997), and syllabic approximants (Lee & Zee Reference Lee and Zee2003). The current study discusses some problems with the two dominant proposals, namely the syllabic fricative and apical vowel argument, by examining the articulatory and acoustic aspects of these segments. It will be shown that the results are most compatible with the analysis that these segments are corresponding syllabic approximants [
 ] and [ɻ] of the dental and retroflex sibilants, respectively.
1.1 Phonetics and phonology of Mandarin ‘apical vowels’
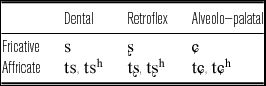
Mandarin Chinese has an unusually rich inventory of sibilant sounds: a three-way contrast in place of articulation for fricatives, and aspirated and unaspirated affricates. This is summarized in Table 1. Note that this paper retains the traditional retroflex transcriptions [ʂ tʂ tʂh (ɻ)] instead of apical post-alveolars [
 t
t
h (
 )] provided by Lee & Zee (Reference Lee and Zee2003).Footnote
1
Mandarin Chinese sibilant system.

It is generally assumed that Mandarin has five underlying vowels /i y u ə a/ (Duanmu Reference Duanmu2000, Reference Duanmu2007). While all the sibilants can freely co-occur with the vowels [a] and [əu] (Duanmu Reference Duanmu2007: 326–327; Li Reference Li2008: 17),Footnote 2 there is an interesting co-occurrence restriction between dental and retroflex sibilants and the high front vowel [i]. The pattern summarized with an example of fricatives in (1) holds true for the affricates.
-
(1)


Those two sibilants are instead followed by nuclei which are known to be made with the tongue tip/blade. As shown in Figure 1, X-ray images taken by Zhou & Wu (Reference Zhou and Wu1963) demonstrate that the tongue tip/blade gesture inherited from the preceding dental and retroflex consonants remains nearly unchanged for the following voiced period. Since the constriction of the tongue tip/blade is more front for the segment after the dentals than after retroflexes, Zhou & Wu (Reference Zhou and Wu1963) described the former as ‘apical front vowel’ and the latter as ‘apical back vowel’.
X-ray images of one Bejing speaker for the articulation of the high front vowel [i] (left), ‘apical front vowel’ (middle), and ‘apical back vowel’ (right) in Mandarin Chinese. These images are reproduced from Figures 27, 31, and 32, respectively, in Zhou & Wu (Reference Zhou and Wu1963: 34–35). The solid line indicates the midsagittal images of the tongue from X–rays, and the lighter line indicates the positions of the sides of the tongue from palatograms.

1.2 Previous analyses: Syllabic fricatives vs. apical vowels
Despite a general agreement on the articulation of the apical segments, phonological analyses are extremely diverse and contentious. Abstracting away from the details of each theory, two dominant arguments on the status of these segments emerge: syllabic fricatives vs. apical vowels. The proponents of the syllabic fricatives argued that these segments are voiced counterparts of the corresponding sibilants, transcribing them as [z] and [ʐ] (Chao Reference Chao1934, Reference Chao1968; Hartman Reference Hartman1944; Pulleyblank Reference Pulleyblank1984; Ramsey Reference Ramsey1987; Lin Reference Lin1989; Wiese Reference Wiese, Wang and Smith1997; Duanmu Reference Duanmu2000, Reference Duanmu2007). Since the segments in question function as the nucleus of each syllable, they have long been called ‘syllabic fricatives’ among those scholars. Acknowledging that it is not phonologically preferable to posit independent phonemes for those voiced fricatives, some scholars have proposed a formal analysis utilizing feature spreading (Wiese Reference Wiese, Wang and Smith1997; Duanmu Reference Duanmu2000, Reference Duanmu2007), as shown in (2). Specifically, the coronal feature of the onset consonant is spread into the rhyme which was empty for featural specification.
-
(2)

It is worth pointing out that this feature spreading approach departs from the view that these segments are derived from the underlying high front vowel [i]. There are mainly two arguments for not deriving the apical segments from /i/. First, the unique apical gesture of these segments is radically different from the typical vowel articulation which uses the tongue body as a main articulator. Second, it is particularly unnatural to derive voiced fricatives ([z] and [ʐ]) from the underlying high front vowel /i/ through featural changes. This process, if possible, would be as arbitrary as a change from an underlying /i/ to [f] or [k], as noted in Wiese (Reference Wiese, Wang and Smith1997).
Now we consider another competing argument in the field: the apical vowel argument. Despite the apicality characteristic of the consonantal articulation, there has been a long tradition of analyzing these segments as vowels particularly in Chinese linguistics (Karlgren 1915–16, R. Cheng Reference Cheng1966, C. Cheng Reference Cheng1973, Howie Reference Howie1976, Hsueh Reference Hsueh1986, Wu Reference Wu1994, Zee & Lee Reference Zee and Lee2001). The phonetic grounding of this approach includes (i) the presence of clear formant structures, (ii) raised tongue back as for vowel articulation. A strong phonological advantage comes from the consideration of the distribution of these segments; they are in complementary distribution with the high front vowel, and they occur exclusively in these specific environments. Analyses assuming that the segments following dental and retroflex sibilants are vowels differ in their exact implementation. For example, R. Cheng (Reference Cheng1966) assumes that the two apical segments are derived from the underlying high front vowel whereas C. Cheng (Reference Cheng1973), who noticed the retracted tongue body posture, posits an abstract underlying segment [ɨ], independent from [i].
1.3 Current proposal: ‘Apical vowels’ as syllabic approximants [
] and [ɻ]
The present study discusses problems with both approaches and provides evidence for analyzing these segments as approximants. To begin with, the syllabic fricative approach is not quite right considering the absence or at least the tenuous presence of frication noise during the voiced segments. Although having argued for the ‘fricative vowel’ notation (Ladefoged & Maddieson Reference Ladefoged and Maddieson1996: 365), Ladefoged himself admits that ‘it is certainly true that the fricative noise carries over into the beginning of the vowel. But the greater part of each of these vowels does not have any fricative turbulence’, as seen in the UCLA phonetics lab data (http://www.phonetics.ucla.edu/appendix/languages/chinese/chinese.html). As much as it is not accurate phonetically, the syllabic fricative analysis is also not preferable from a phonological perspective. Although a feature spreading analysis can get away with positing independent phonemes for those unique segments, it is a stipulation that the rhymes of [s] and [ʂ] are empty in the first place whereas the rhyme of [ɕ] is filled with the high front vowel. Secondly, it does not address the more fundamental question of why the co-occurrence restriction exists only between dental/retroflex sibilants and the high front vowel.
Although it correctly captures the distributional property, the apical vowel argument creates an obvious conflict between articulation and acoustics of these segments. Based on their relative tongue tip/blade position in the alveolar region, Zhou & Wu (Reference Zhou and Wu1963) described the dental segment as an ‘apical front vowel’ and the retroflex segment as an ‘apical back vowel’. Along the same vein, Wu (Reference Wu1994) transcribed the former as a ‘high central vowel [ɨ]’, and the latter as a ‘high back vowel [ɯ]’. Both approaches attempt to distinguish the anterior alveolar from the posterior one by borrowing the notion of ‘backness’ that is used for the vowel system. However, this necessarily makes a wrong prediction about the acoustics of the nuclei. If they are indeed vowels, the front vowel, i.e. the dental segment, should exhibit higher F2 values than the back vowel, i.e. the retroflex segment. Some formant measures (Howie Reference Howie1976, Zee & Lee Reference Zee and Lee2001), however, demonstrated that the opposite is the case: the retroflex segment has consistently higher F2 than the dental one. This mismatch in the articulatory–acoustic relation presents a puzzle for the apical vowel argument. Second, as will be shown later, the articulation of these segments is homorganic with the preceding sibilants, and therefore the consonantal gestures involved in these segments are radically different from the standard vowel articulation. Consequently, this makes it hard to find appropriate IPA vowel symbols. Although Sinologists traditionally used [ɿ] and [ʅ] symbols, these are now obsolete in the IPA and not informative for non-Chinese linguists. One might use the regular vowel symbols with diacritics considering their relative F2 values, e.g. a dentalized [
 ] and retroflexed [ɨ], but the articulation of these segments are sufficiently different from the possible tongue gesture of [ɯ] or [ɨ]. Moreover, the vowel notations [ɯ] or [ɨ] do not capture the homorganicity of the consonants and voiced segments. That is, there is no necessary connection between [s] and [ɯ] or between [ʂ] and [ɨ].
Departing from these two dominant views, this paper argues that the segments in question are corresponding approximants of the preceding sibilants, as shown in (3).
-
(3)

While the dental approximant is not a rhotic sound, the retroflex approximant is. Because the International Phonetic Alphabet does not have an appropriate dental approximant symbol, the transcriptions below are intended to reflect the homorganicity of these approximants with their corresponding sibilants. Phonologically, these segments are syllabic since they serve as nuclei of a syllable. The syllabic diacritic (e.g. [
 ]), however, is not used for the sake of simplicity.
While Lee & Zee (Reference Lee and Zee2003) used the symbol [
 ] for the transcription of both apical segments in the IPA Illustration of Beijing Mandarin, this paper proposes independent IPA symbols for each approximant. To provide evidence for the current proposal, ultrasound imaging is employed, tracking the tongue movement during the articulation of the entire apical syllable for one female Beijing speaker. Ultrasound imaging, when used along with statistical techniques, is particularly useful to examine the relative tongue shape of the segments in question in relation to other segments. While Zhou & Wu's (Reference Zhou and Wu1963) X-ray images present unanalyzed data (Figure 1), the current paper presents an extensive study of the articulation of these approximants in comparison with the preceding consonants and to other point vowels.
Subsequently, an investigation of the acoustic properties of the apical segments is conducted on the recordings of a number of speakers. The acoustic study focuses mainly on two aspects. First, the presence of the alleged frication during the dental and retroflex sequences is closely examined via visual inspection on the waveform and spectrograms. Despite the simplicity of this technique, this process is important, since the presence of frication noise has served as primary evidence for the syllabic fricative argument. Second, formant measures provide the basis for an explicit acoustic model that explains the articulatory-acoustic mechanism involved in the production of the apical segments. Note that simply taking the vowel-like property as evidence for the apical vowel analysis has created a conflict between articulation and acoustics. A correct acoustic model not only provides a proper acoustic model without any conflict with articulation but it also sheds light on the phonetic nature of these segments as approximants.
Finally, this paper provides a possible phonological explanation for the co-occurrence restriction between the dental and retroflex sibilants and the high front vowel. The advantage of the approximants over the high front vowel is discussed in terms of the preservation of phonological contrast.
2 Experiment I: An ultrasound study
2.1 Participants
One female (WY) graduate student of New York University was recruited for the ultrasound imaging. She was a native speaker of Mandarin Chinese who was born and raised in Beijing in China until she moved to the United States for graduate school. She spoke standard northern Mandarin which retains the distinction between the retroflex and dental sibilants. She reported no history of speech or hearing disorders. The participant was paid for her time.
2.2 Materials
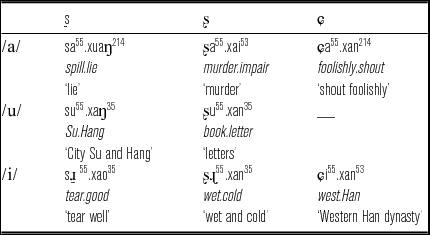
The stimuli for the ultrasound study included eight disyllabic sequences with ten filler words. The target was the first syllable composed of three fricatives [s ʂ ɕ] in three different vowel contexts [i(
ɻ) a u]. Since [ɕ] cannot be followed by the vowel [u] in Mandarin Chinese, this vowel was preceded only by [s] and [ʂ]. The tone of the target syllable was fixed with a high level tone (X55).Footnote
3
The second non-target syllable started with a sequence [xa] except for one ([saxuaŋ] ‘lie’), so the entire sequence was mostly of the form of CV
55.xaC/V (where underline marks the target syllable). Table 2 includes the stimuli used in experiment.
Target stimuli used in experiment.

In order to maximally control the phonetic environments, the target disyllabic words were different in their grammatical units and the internal morphological structures. Despite the non-uniform grammatical status of each sequence, the prosodic parsing was expected to be comparable to one another, since in Chinese any words or phrases can function as a single noun phrase when embedded in a carrier phrase.
2.3 Procedure
Before the recording started, the participant was familiarized with the target and filler words written in Chinese, and she found all the stimuli sequences natural. The participant was first asked to swallow water for the palate image to be extracted later (Epstein & Stone Reference Epstein and Stone2005). A list of eight target words and ten fillers were presented five times in random order, and the participant was asked to read the target words in a carrier phrase wo shuo zhe ge ci [wo ʂuo __ tʂɤ-kə ts
h
] ‘I say __ this word’.
During the recording session, the participant was seated in a comfortable chair and instructed to find the most comfortable pose for herself. The participant's head was then fit into a moldable head stabilizer on the wall and the head was further stabilized with Velcro (Davidson Reference Davidson2006). This method, when used along with the ultrasound transducer fixed with a Bogen–Manfrotto Magic Arm, ensures that the same slice of tongue is imaged (Davidson & De Decker Reference Davidson and De Decker2005). The transducer was placed under the speaker's chin and adjusted until clear midsagittal images were obtained.
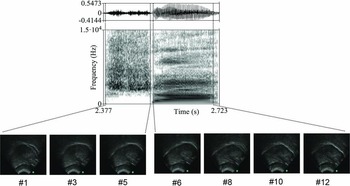
The ultrasound images were recorded using a Sonosite Titan portable ultrasound in a sound-attenuated booth at New York University. A 5–8 MHz Sonosite C-11 transducer with a 90º field of view was set at a depth of 8.2 cm. The audio was collected using an Audio Technica AT-813 microphone, and was synchronized in an avi movie file with the video signal from the ultrasound machine using a Canopus ADVC-1394 capture card and Adobe Premiere. The wave files were then extracted from the movie file, and submitted to PRAAT 5.2.19 (Boersma & Weenink Reference Boersma and Weenink2011) in order to segment the target sequences. Following previous studies (e.g. Iskarous, Shadle & Proctor Reference Iskarous, Shadle and Proctor2011), four acoustic events were identified using PRAAT: onset and offset of both frication and the following vocalic period. The boundaries of fricatives were identified at the beginning and ending of aperiodic noise in the waveform. The presence of F1 and F2 were used to approximate the onset and offset of the vocalic segments. A significantly long lag between the offset of the fricatives and the onset of the following vowels [a] and [u] was often observed, as shown in Figure 2.Footnote 4
A sample waveform and spectrogram of [ʂa]. Five ultrasound frames (Frames 1–5) were obtained during the acoustic consonant period, and seven frames (Frames 6–12) were obtained during the acoustic vocalic period. The frame rate acquired by the ultrasound machine is approximately 30 frames/s. The tongue root is on the left, and the tongue front is on the right.

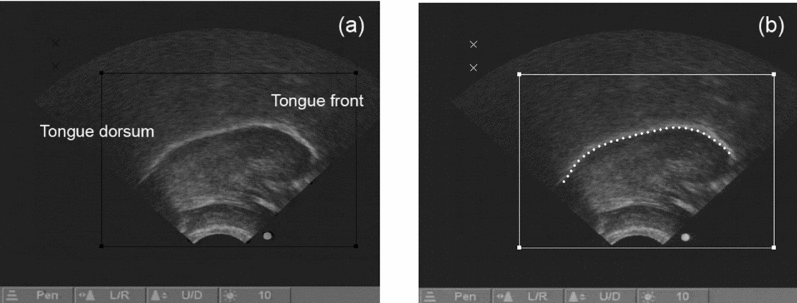
Among the frames corresponding to the voiced period, the middle frame was selected for further analysis, assuming that this frame represented the most genuine tongue shape for vocalic segments. When there was an even number of frames, the first frame after the middle was selected. Those selected frames were then submitted to EdgeTrak (Li, Kambhamettu & Stone Reference Li, Kambhamettu and Stone2005) which automated the tracking of tongue contours by extracting x–y coordinates of the target region from the lower edge of the tongue. One hundred individual values were extracted for the statistical analysis in the next step. Screenshots of the ultrasound image and tongue curve tracking in EdgeTrak are shown in Figures 3a and 3b, respectively.
(a) A screenshot of the ultrasound image of the 3rd frame among five frames extracted during the articulation of the retroflex approximant [ɻ] following the retroflex [ʂ]. It illustrates the tongue image when the vocalic articulation reached its maximal constriction. (b) A screenshot of EdgeTrak. The grey dots are the edge of the tongue created by the automated edge-tracking algorithm. The tongue tip is on the right and the tongue root is on the left.

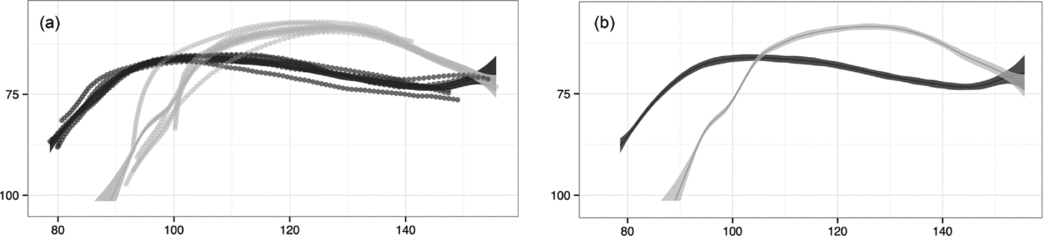
To assess the tongue shape of the apical segments relative to other vowels, a smoothing spline (SS) ANOVA was employed. SS ANOVA is a statistical procedure for investigating similarities and differences of curve shapes (Gu Reference Gu2002, Davidson Reference Davidson2006, Wang Reference Wang2011). Using this method, smoothing splines which best fit the five repetitions for the stimuli were obtained. Sample smoothing splines of two vocalic segments in [s
] vs. [ɕi] are presented in Figure 4b along with the raw data points of five repetitions in Figure 4a.
(a) Raw data points from five repetitions and the smoothing spline estimate (solid lines) for comparison of the tongue shape for [s
] (in black) and [ɕi] (in grey). (b) Smoothing spline estimate and 95% Bayesian confidence interval. As in the ultrasound images, the tongue tip is on the right and the tongue root is on the left. The axes are in millimeters, corresponding to the boxed-in region shown in Figure 3b above.

2.4 Results
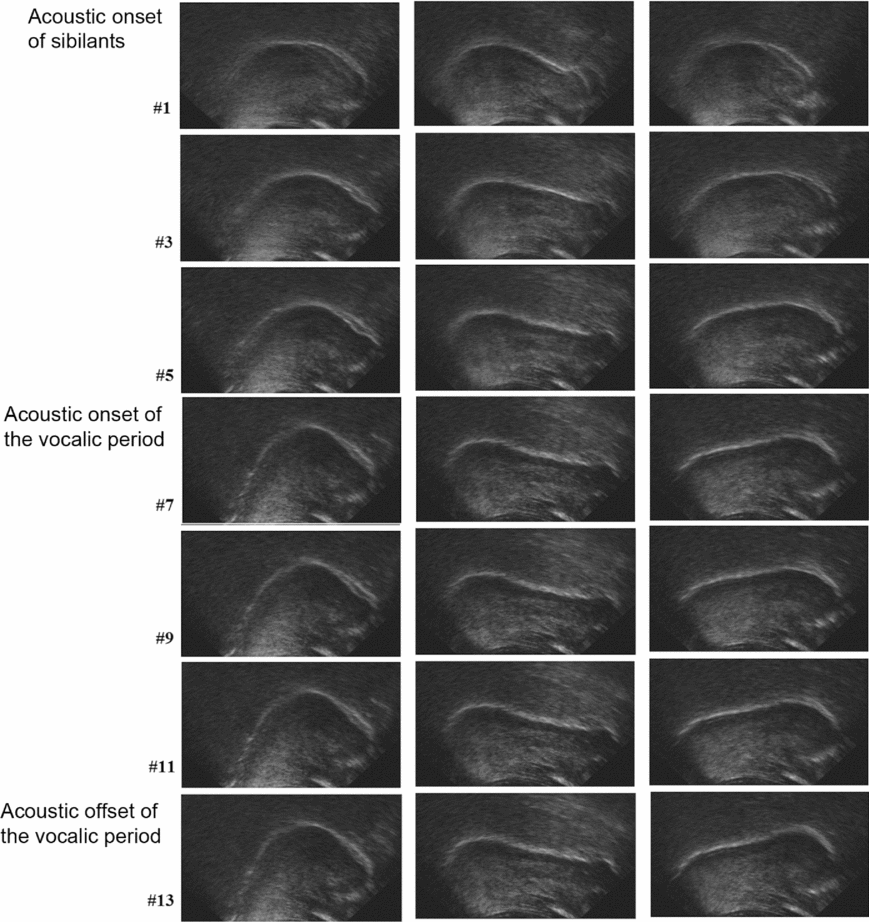
Figure 5 illustrates how the tongue shape proceeds over time during the acoustic realization of each syllable [ɕi], [s
] and [ʂɻ]. The dental and retroflex sequences lasted approximately the same amount of time, and slightly less for the palatal sequence; between five and seven frames were obtained during the consonantal articulation, and five or six frames were obtained during the vocalic articulation.
Ultrasound images of [ɕi], [s
] and [ʂɻ] of the female speaker WY. The tongue tip is on the right and tongue body is on the left. Frame 1 is the acoustic onset of each consonant, and Frame 7 is approximately the acoustic onset of each vocalic period. Frame 13 is the last frame of each syllable.

The images on the leftmost panel present the articulation of the palatal sibilant [ɕ] and the high front vowel [i]. The fronting of the tongue body is evident in the middle of the consonantal articulation (Frames 3–5), and it reaches maximal constriction toward the end of the acoustic [ɕ] (Frames 5–7). As the acoustic vocalic period begins, the tongue root continues to move forward and the highest point of the tongue becomes higher (Frames 9–11). However, the basic tongue shape stays nearly the same until the end of the acoustic [i] due to the homorganic property of the consonant and the vowel.
The two syllables containing apical segments proceed very differently. The main articulator of the dental [s], the tongue tip, is approaching its target at around Frame 5 indicated by the little bump in the tongue front. At the same time, the tongue body and root retract and stay far back. More interestingly, both the tongue tip raising and tongue back retraction are maintained throughout the entire syllable (Frames 7–13). Likewise, the tongue back is not fronted for the articulation of the retroflex and the following segment, but rather it retracts and stays far back. In accordance with the previous literature (Ladefoged & Wu Reference Ladefoged and Wu1984, Lee & Zee Reference Lee and Zee2003), the retroflex consonant of this speaker is not produced with the tongue tip curled back, but a larger chunk of the tongue blade makes a constriction far behind the dental constriction (Frames 5–7). As with the other apical segment, [
], the tongue shape of the consonant does not change significantly during the articulation of [ɻ]. Rather, the raised tongue blade and the retracted tongue back are maintained throughout the entire syllable (Frames 9–13). Interestingly, raising of the tongue blade is more evident toward the end of the syllable, so the final frame (Frame 13) shows the most raised tongue front gesture.
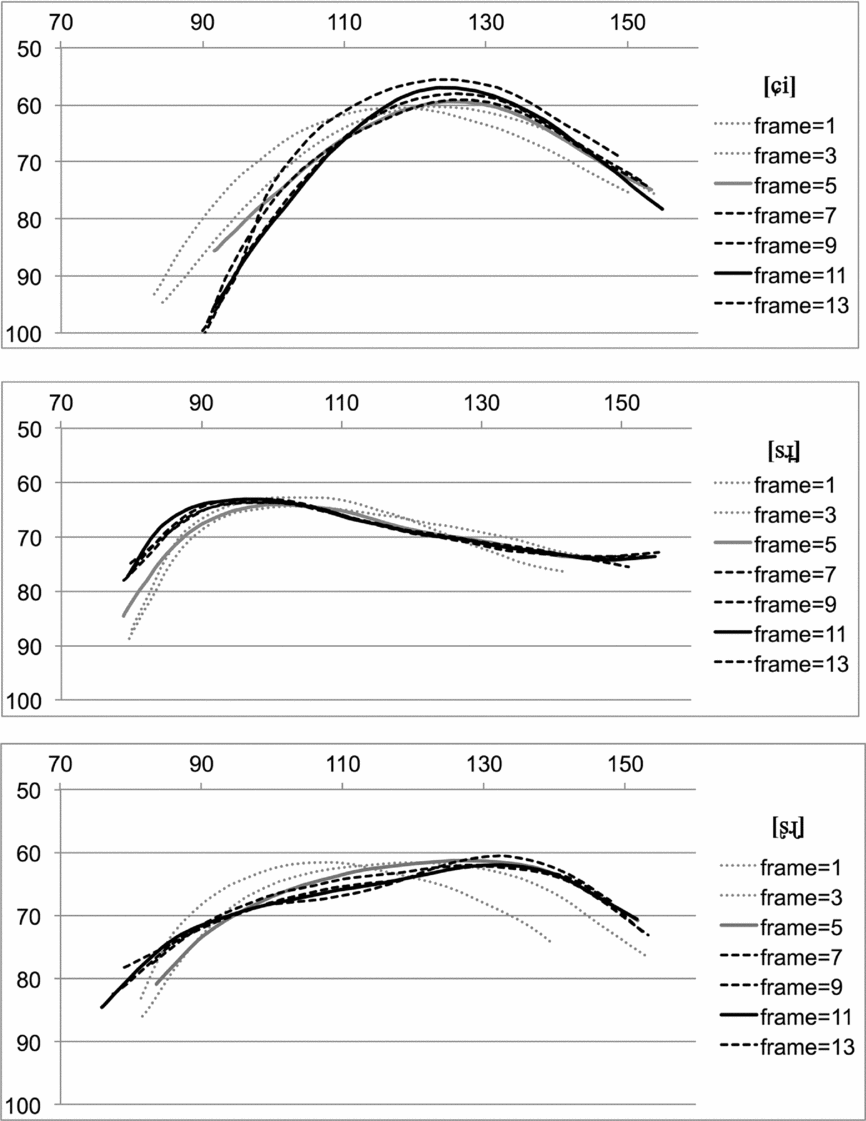
Figure 6 shows the time course of the change in articulation throughout the entire syllable. The edge of the tongue shape in Figure 5 was extracted using EdgeTrack, and was placed in one plot. Although the very fine details such as the little tongue tip gesture found in [s
] were omitted, these figures enable a thorough examination of the relative tongue position between consonants and the following vocalic gestures.
Time course of the articulation of [ɕi], [s
] and [ʂɻ] based on the ultrasound images in Figure 5 above. The consonantal gestures are represented in grey and the vocalic gestures are represented in black.

Overall, it is observed that the tongue gestures do not change significantly once it reaches the consonantal target (represented in solid grey), confirming the homorganic property between consonantal and vocalic gestures. However, it is noteworthy that there are still some changes between the consonantal (in solid grey) and vocalic (in solid black) target gestures for all three sequences. The tongue root continues to move forward and the tongue body moves upward for [i], whereas the tongue root continues to retract for the dental and retroflex segments. In addition, the tongue body continues to lower slightly for the retroflex segment, presumably to make the tongue tip/blade more raised. It seems that these continuing gestures are to achieve their maximal articulatory targets of each homorganic sequence due to a relatively long timespan allotted for each place of articulation.
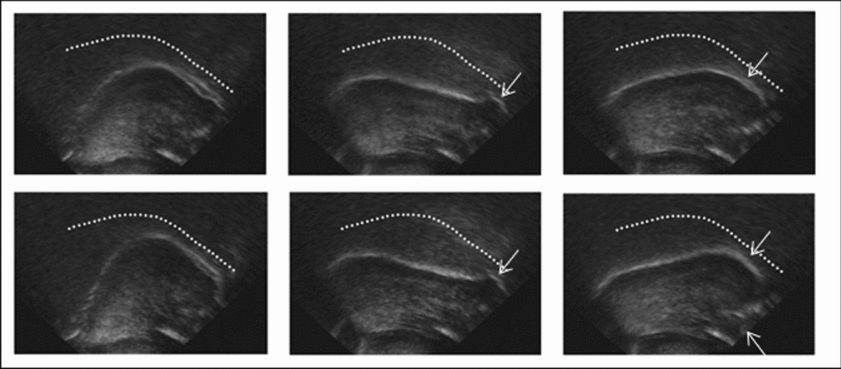
Figure 7 reproduces the tongue shapes at Frame 5 and Frame 11 in Figure 5, which represent the typical consonant and the following apical segments of each syllable. The palate image taken separately was loaded on top of each figure to indicate better the relative position of the tongue.
The tongue shapes of Frame 5 (top row) and Frame 11 (bottom row) are reproduced with the palate trace loaded (shown by the dotted line) on top of each figure. The figures in the top row represent the tongue shape of consonants [ɕ], [s] and [ʂ], respectively, whereas those in the bottom row represent the tongue shape of the corresponding high front vowel [i] and approximants [
] and [ɻ]. The dental and retroflex constrictions are maintained in the voiced period as indicated by an arrow. A sublingual cavity for [ʂ] and [ɻ] is indicated by a dotted arrow.

Again, despite some differences, for each sibilant, the tongue configuration appears to be nearly the same for the sibilant and the following vocalic segments, confirming that the apical segments are homorganic with the preceding consonants. Specifically, the tongue tip/blade gesture indicated by an arrow is prominent for the apical segments, and the raised tongue blade for the retroflex becomes even more evident. In contrast with the general description of the retroflex (Hamann Reference Hamann2003), the tongue middle of the Mandarin retroflex is not convex, but it is rather flat. However, it shares a common property with retroflexes in other languages as it has a relatively large sublingual cavity indicated by a dotted arrow.
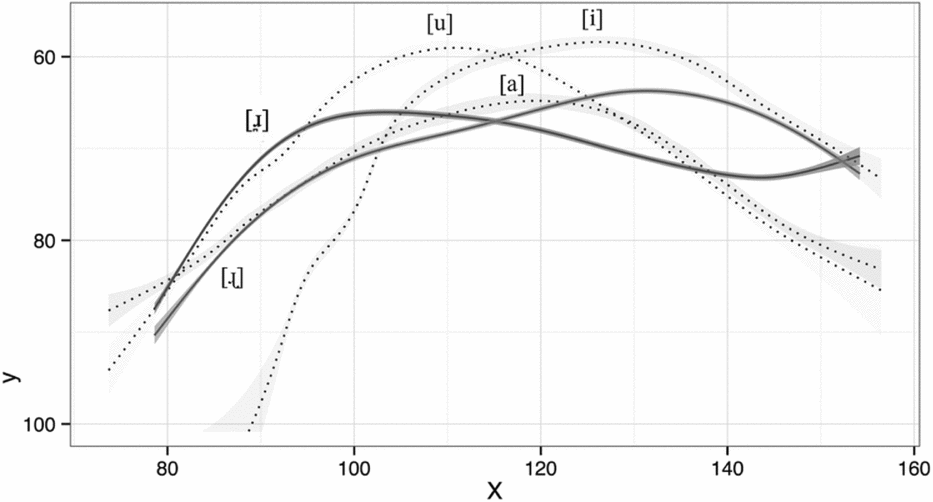
Figure 8 presents the smoothing splines based on five repetitions of the two apical segments, [
] and [ɻ] (dark lines) with 95% Bayesian confidence intervals marked by the grey shading that is superimposed on the smoothing spline. Three point vowels [i], [a] and [u] (light lines) are also plotted to illustrate better the relative tongue position of the two approximants in the vocal tract.Footnote
5
Smoothing spline estimates and 95% Bayesian confidence intervals for comparison of the mean curves of three point vowels [a], [i] and [u] (in light grey) and two approximants [
] and [ɻ] (in dark grey). As in the ultrasound images, the tongue tip is on the right and the tongue root is on the left.

While the highest points of the vowels [a], [i] and [u] form a typical triangle shape, the approximants form very different configurations. Specifically, the dental segment [
] is as low as the vowel [a] in terms of the tongue body,Footnote
6
but it is considerably more retracted. It might be that retraction of the tongue back for the dental segment makes a narrow constriction against the upper pharynx, although in the absence of information about the pharyngeal wall, this is not conclusive. In comparison, the tongue body of the retroflex segment [ɻ] is less prominent; it is lower and less retracted than that of the dental segment.
2.5 Articulatory findings and acoustic implications
The current ultrasound study is consistent with the previous X-ray images (Zhou & Wu Reference Zhou and Wu1963) in that the dental and retroflex segments have tongue configurations similar to the preceding sibilants. However, it is important to note that the tongue body postures of the two apical segments seen in Figure 8 are inherent to the preceding sibilants; the dental and retroflex sibilants have retracted tongue body with the relative degree of raising (see Figure 7 above). Crucially, this argues against the apical vowel analysis wherein the raised tongue body is taken to be evidence for the vowel property of these segments (C. Cheng Reference Cheng1973). In fact, there is a discussion in the literature about the association between dental consonants and a retracted tongue body. For example, in Malayalam, F2 in the surrounding vowels is significantly lower for dentals than for plain alveolars, implying a more retracted tongue body for the dentals (Stevens, Keyser & Kawasaki Reference Stevens, Keyser, Kawasaki, Perkell and Klatt1986). Stevens et al. conjecture that the dental constriction, which requires a flat tongue front, can be achieved more easily when the tongue back is retracted.
The association between retroflexes and a retracted tongue back is also well documented (Spencer Reference Spencer1984, Hamann Reference Hamann2003). The articulatory basis of this correlation is that the tongue body should be stretched and pulled backward in order to displace the tongue front upward and back toward the post-alveolar region. Spencer (Reference Spencer1984) thus proposed the phonological feature [+back] along with other features to properly specify the retroflex consonant. The results of the current study do not refute this proposal, but in this data, retraction of the tongue body is in fact more evident for the dental consonant in Mandarin.
The tongue configuration in the back is of trivial acoustic importance for the sibilant consonants, considering the noise source mechanism whereby the spectral properties of the turbulence noise are mainly shaped by the front cavity (Stevens Reference Stevens1998). However, it can be influential when the apical constriction is open and the back cavity starts to create an acoustic signal as a legitimate resonator. Alwan, Narayanan & Haker (Reference Alwan, Narayanan and Haker1997) proposed a possible three-cavity acoustic model for the American English [ɹ] based on the fact that it often has a pharyngeal constriction. In this case, the F2 can be attributed to the Helmholtz resonator formed by a narrow pharyngeal constriction and the cavity behind it. Given the prominent tongue back gesture in the Mandarin dental approximant, it might be worth considering this possibility as well as the simple two-cavity model. In the following section, the general acoustic properties of the apical segments are investigated, and the results are discussed in relation to the articulatory findings.
3 Experiment II: An acoustic study
The acoustic study focused on a few aspects of the apical segments. Given the persistent assumption of frication noise during the voiced period, the presence or absence of frication was examined by close visual inspection on the waveform and spectrogram. The formant values were measured and the results were interpreted under an acoustic model of a sonorant consonant that accounts for both articulatory and acoustic aspects of the apical segments.
3.1 Participants
Three female and three male speakers were recruited for the acoustic recordings. The female speaker who participated in the ultrasound imaging was one of the female speakers of this acoustic study. Participants were college or graduate students of the Chinese University of Hong Kong and New York University. They were all native speakers of Mandarin Chinese who were born and raised in mainland China until they started college or graduate school in Hong Kong or the United States. All the female and two of the male speakers were from Beijing in China, and one male speaker was from Harbin, northeast China. None of them reported a history of speech or hearing disorders. The participants were paid for their time.
3.2 Procedure
The stimuli for the acoustic recording were the same as in the ultrasound study (see Table 2 above). The recording procedure also remained mostly the same, except that a list of target words and fillers was presented 10 times in random order, and the subjects were asked to read the target words in a carrier phrase wo shuo __ zhe ge ci [wo ʂuo __ tʂɤ-kə ts
h
] ‘I say __ this word’. The acoustic recordings were made using an Audio Technica AT 2010 cardioid condenser vocal microphone with a sampling rate of 44.1 kHz in a sound-attenuated booth at the Chinese University of Hong Kong and New York University. The speech signal was submitted to PRAAT 5.2.19 (Boersma & Weenink Reference Boersma and Weenink2011) and segmented using the same criteria as in the ultrasound study. The first three formant values of the following vocalic period were measured by creating a 25 ms PRAAT-default Gaussian window centered at the midpoint of the vocalic intervals. The maximum frequency for formant calculation was set to 5 kHz for male speakers and 5.5 kHz for female speakers.
3.3 Acoustic results
3.3.1 Sample illustration of spectrograms: Investigation of frication noise
Since it has been controversial whether or not the apical segments contain frication noise, this paper closely examines the presence or absence of frication by visual inspection of the waveforms and spectrograms of all speakers.
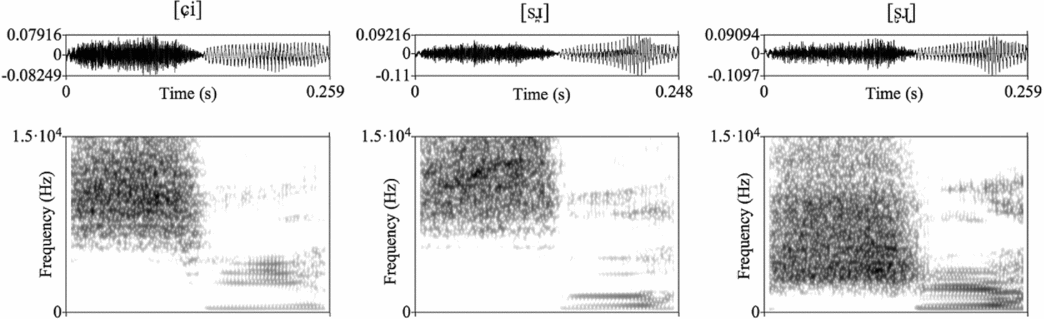
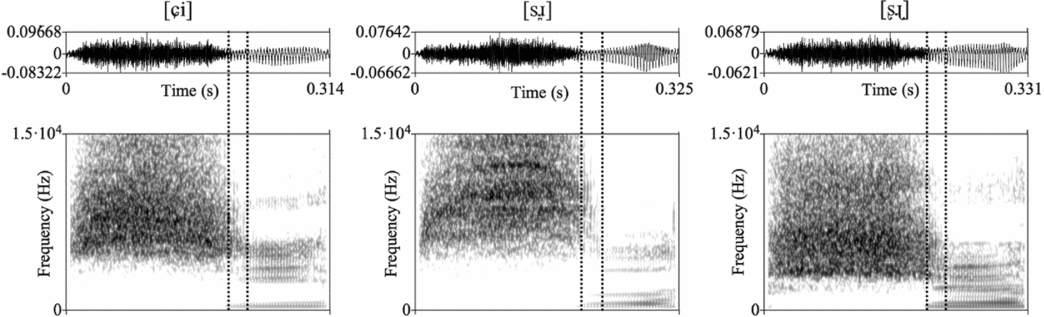
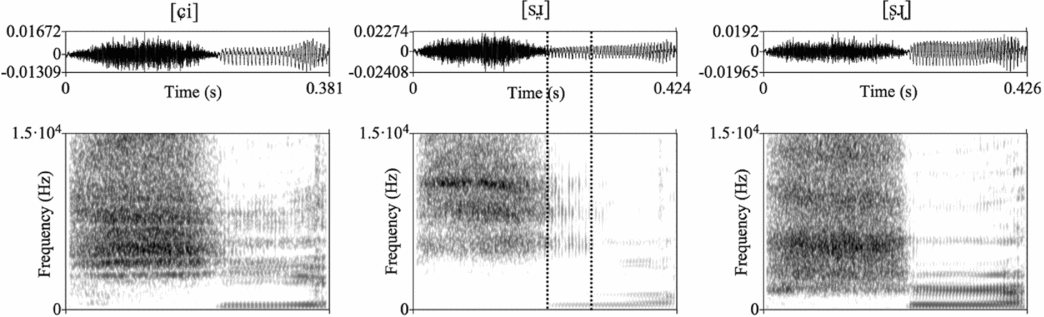
Figures 9–11 show representative spectrograms of the relevant syllables produced by three different speakers. The upper limit of the spectrogram was set to 15 kHz to show frication noise at higher frequencies. To begin with, Figure 9 illustrates the majority pattern demonstrated by three speakers (RJ, PY and HZ). In the speech signal of these speakers, the apical segments behaved similarly to other vowels, presenting a periodic waveform and a nearly clear separation of the frication noise from the following vocalic period.
Spectrograms of [ɕi], [s
] and [ʂɻ] of a female speaker (RJ). There is no frication noise in the following periodic segments for all three syllables.

Spectrograms of [ɕi], [s
] and [ʂɻ] of a female speaker (WY). There is a short period of frication noise indicated with dotted vertical lines in the following periodic segments for all three sequences. Frication in the vocalic period is represented with dotted vertical lines.

Spectrograms of [ɕi], [s
] and [ʂɻ] of a male speaker (HW). There is some frication noise into the following vocalic segment for [s
] (indicated with dotted vertical lines).

By contrast, in two female speakers’ (WY, ZD) speech, a small portion at the beginning of the vocalic period (around 20 ms, indicated with dotted vertical lines in Figures 10–11) was consistently affected by frication noise, so that formant frequencies higher than the third were not visible. However, this was not only limited to the apical segments, but also holds true for the sequence of the alveolo-palatal sibilant and the high front vowel (see the leftmost part of Figure 10). Unlike the low vowel [a], where there is often a significant gap between the sibilant and the following vowel (see the spectrogram in Figure 2 above), the high vowel tends to show some frication carried over from the preceding consonant, presumably due to its homorganic property. Thus, frication noise of 20 ms observed in apical segments can be considered to be a mere gestural overlap with the preceding homorganic sibilants.
Finally, one male speaker, HW, showed a unique pattern with respect to frication noise. The vocalic segment following the dental sibilant in the middle part of Figure 11 was fricated up to one-third or one-half of the vocalic period (indicated with dotted vertical lines) depending on individual tokens. In contrast, the vocalic segment after the retroflex sibilant was never fricated, as seen in Figure 11 (rightmost part). The vowel after the alveolo-palatal sibilant of this speaker, however, was a bit noisy. However, the pattern is distinct from the frication seen in Figure 11 (middle): the noise in the leftmost part of Figure 11 seems to be attributed to the energy in higher frequencies being more intense, whereas the noise in the middle part of this figure is an extension of the preceding frication noise. This suggests that frication, if any, is not limited to the apical segments, but can occur as a result of variable phonetic implementation of a vowel that has relatively narrow constriction with the palate.
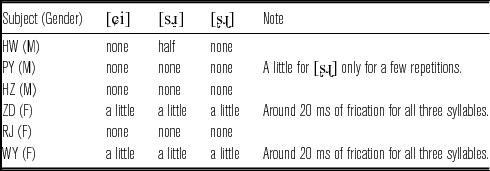
The presence of frication noise in the vocalic period for all six speakers is summarized in Table 3. Overall, frication noise of the preceding fricatives never spread through the ‘entire’ periodic segments as it would if they were truly voiced fricatives. Rather, frication noise, if any, was found at the very beginning of the following segments only for some speakers for a very short period. Moreover, this carryover frication noise was also regularly found for the plain alveolo-palatal sequence for those speakers, suggesting that frication noise is likely to be a mere gestural overlap between sibilants and the homorganic apical segments consistent within a speaker. This finding provides evidence against syllabic fricative analyses, which have overestimated the significance of occasional frication noise.
The presence of the frication noise.

3.3.2 Formant measures
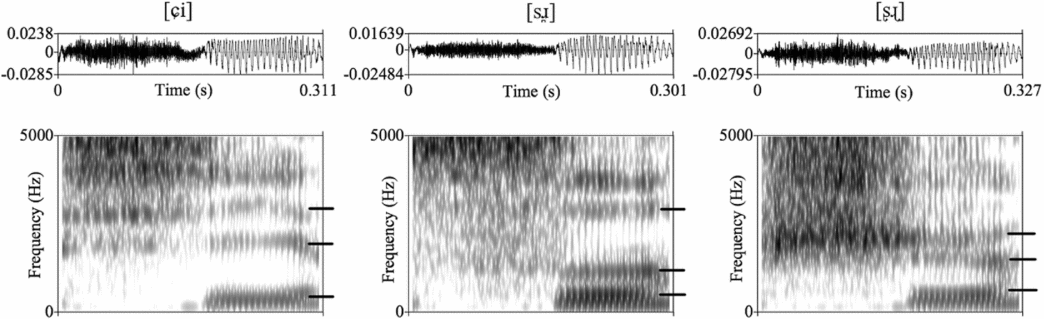
Figure 12 illustrates the waveform and spectrogram of a male speaker, PY. Again, the vocalic segments show a regular periodic waveform and clear formant structures as in the plain high front vowel [i]. Two interesting aspects of the apical segments stand out most clearly. First, the second formant of the apical segments is much lower than that of the high front vowel. Moreover, F2 of the dental segment is still lower than that of the retroflex. Second, F3 of the retroflex segment is quite low, nearly merging with the second formant.
Spectrograms and formants of [ɕi], [s
] and [ʂɻ] of a male speaker (PY, first repetition). The first three formants are indicated with bars on each figure. The second formant values show a hierarchical order among three vowels: the high front vowel is the highest (on the leftmost), the approximant after retroflex is intermediate (on the rightmost), followed by the approximant after the dental sibilant (in the middle). The third formant of the retroflex segment is considerably lowered, nearly merging with the second formant.

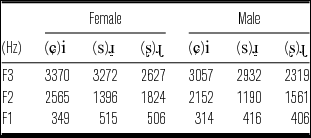
The pattern was confirmed with several speakers. Table 4 presents the average formant values of female and male speakers, respectively. One-way analysis of variance verified its statistical significance. The F2 values averaged over female and male speakers were significantly different depending on the type of the following segment (i, ɻ,
) (F(2,174) = 434.9, p < .001); Student–Newman–Keuls post-hoc tests indicated this was due to the following pattern: F2(i) = 2362 Hz > F2(ɻ) = 1694 Hz > F2(
) = 1295 Hz. The F3 values were also significantly different (i, ɻ,
) (F(2,174) = 71.4, p < .001); Student–Newman–Keuls post-hoc tests indicated this was due to the following pattern: F3(i) = 3216 Hz, F3(
) = 3105 Hz > F3(ɻ) = 2476 Hz.
Mean formant values of three female and three male speakers. For both groups, the dental segment shows the lowest F2 value, the retroflex shows the intermediate and the high front vowel the highest. F3 of the retroflex segment is much lower than other segments.

The results of the formant measures are consistent with the previous studies; the dental segment is characterized by low F2 and high F3, whereas the retroflex segment is characterized by mid F2 and low F3 (Howie Reference Howie1976, Zee & Lee Reference Zee and Lee2001). The striking difference in F3 values seems to lie in the distinct rhotic property: the retroflex approximant [ɻ] is a rhotic sound, whereas the dental approximant [
] is not. Impressionistically, this is consistent with the percept of two sounds: the former gives an r-colored percept, whereas the latter does not. Although the symbol [ɹ] is generally used to represent a rhotic sound, this paper distinguishes between a dental approximant notated by [
] and a retroflex approximant [ɻ] on the basis of the articulatory-acoustic differences of these sounds. That is, the low F3, a general acoustic characteristic of rhotic sounds, results from a large front cavity (Narayanan, Byrd & Kaun Reference Narayanan, Byrd and Kaun1999). The rhotic property of the retroflex [ɻ], i.e. the low F3, can thus be attributed to the large sublingual cavity formed by raising of the tongue blade, whereas the absence of this cavity gives rise to the non-rhotic property, i.e. the high F3, for the dental approximant [
].
3.4 Acoustic models for apical segments
An examination of the spectrogram and waveform has shown that the alleged frication noise is illusory, presenting evidence against the syllabic fricative analysis. There is no frication noise inherent in the following voiced period, and occasional frication noise is a mere gestural overlap that is often found between consonants and homorganic voiced segments. These vowel-like acoustic properties lead to a conclusion that the narrow constriction for the sibilant is slightly released and the source mechanism has changed from a turbulent jet to a sonorant sound. This implies that the back cavity starts to resonate, generating a formant structure of its own. Considering an interaction between different cavities, it is worth investigating the source of each acoustic signal in relation to the specific vocal tract configuration.
To begin with, Stevens (Reference Stevens1998: 535–539) provides an acoustic model that explains the association between the low F3 and the retroflex gesture. The space under the tongue blade, i.e. sublingual cavity, created by the raising of the tongue front introduces a pair of acoustic pole and zero. The pole makes a high-amplitude resonance frequency, while the zero dampens the amplitude of the higher frequency energy. These events are interleaved with the pairs of resonant frequencies generated by the back cavity. Due to the relative length difference, the back cavity typically resonates at a slightly lower frequency than the acoustic pole. As a result, the whole acoustic event gives rise to the characteristic formant structure of retroflexes: low F3 near F2 and weak higher formants. In fact, this is precisely what we observe for the Mandarin retroflex approximant [ɻ]. It has the raised tongue blade accompanied by a large sublingual cavity, and this introduces an acoustic pole that finally appears as a low third formant in the spectrogram.
Without the addition of a sublingual cavity, the front cavity of a dental segment which is inherently short is unlikely to generate any visible formant values. Instead, the long back cavity behind the dental constriction is predicted to create a low F2, which is consistent with the current acoustic study. Moreover, the observed relative F2 values between the dental and retroflex segments receive a straightforward explanation. That is, the dental segment has a longer back cavity than the retroflex, resulting in a lower F2 for the former than the latter.
It is worth noting though that the F2 value of the dental approximant might be attributed to the Helmholtz resonator formed between the pharyngeal constriction and the cavity behind it. Recall that [
] has a prominent tongue back gesture making a pharyngeal constriction (Figure 8 above). Alwan et al. (Reference Alwan, Narayanan and Haker1997) proposed two possibilities for the origin of the second formant in the production of American English [ɹ]. For one thing, when the pharyngeal constriction is not prominent and the entire back cavity forms a relatively uniform tube, the second formant arises from the resonance of the back cavity behind the alveolar constriction. However, in the case of a narrow pharyngeal constriction, the second formant is projected from the Helmholtz resonator formed between the pharyngeal constriction and the cavity behind it. It is not clear whether the pharyngeal constriction of the Mandarin dental approximant is narrow enough to form a Helmholtz resonator. Assuming there is relatively wide inter-speaker variation, it might be more accurate to say that either case is possible, but is subject to a specific articulation of a speaker. In any case, F2 is consistently attributable to the back cavity.
Having established the relationship between the vocal tract configuration and the acoustics, it becomes clear that the vowel analysis is less tempting. Under the general acoustic model for vowels, F2 is attributed to the front cavity due to the articulatory characteristics of vowels: constriction made by the tongue body creates a long front cavity. When the main articulator is tongue tip/blade as in apical segments, however, F2 is necessarily associated with the back cavity due to the inherent lack of a long front cavity. Whereas the vowel analysis is incompatible with the general acoustic model for vowels, the current approximant analysis correctly accounts for the observed formant pattern of both apical segments in relation to their articulatory properties.
4. General discussion
The present study has shown that the apical segments that occur after the dental and retroflex sibilants in Mandarin Chinese are a ‘dental approximant [
]’ and a ‘retroflex approximant [ɻ]’, respectively. Evidence comes from both articulatory and acoustic properties of these segments. Ultrasound images showed that these segments are indeed homorganic with the preceding consonants. However, the acoustic study revealed that the alleged frication noise is not evident, suggesting that these segments are not ‘voiced fricatives’. Despite the vowel-like formant structure, it has been shown that the observed F2 pattern can be best explained with an acoustic model of a sonorant consonant wherein the F2 is attributed to the back cavity behind the apical constriction. This analysis correctly predicts the relative F2 values between two apical segments; the dental segment has a longer back cavity than the retroflex, resulting in the lower F2 values for the former than the latter. Based on the articulatory and acoustic findings that refute both the voiced fricative and the apical vowel analyses, it is proposed that they can be best seen as a dental approximant [
] and a retroflex approximant [ɻ].
However, acknowledging the complementary distribution of the approximants with the high front vowel remains a puzzle,Footnote 7 since they are quite different from each other phonetically and phonologically. The next section thus continues an in-depth discussion about the challenge that the current data brings up. To begin with, we consider first why the high front vowel [i] is prohibited specifically after the dental and retroflex sibilants in Mandarin, while other vowels are allowed. An account based on perceptual reasons is considered (Flemming Reference Flemming1995, Steriade Reference Steriade1999). The high front vowel, which often triggers palatalization of preceding consonants, may obscure the contrastive place distinctions by making the frication noise of sibilants less distinct. Once it is understood why the high front vowel [i] is not possible after all three sibilants, the second part of the puzzle is why Mandarin has approximants in place of [i], given that there are other possible scenarios that would maintain a contrast in sibilant place before [i]. The advantage of the approximants is discussed in terms of contrast maximization: they provide additional cues to the place contrast between sibilants.
4.1 Neutralization of the phonological contrast by the high front vowel
The logic behind the Mandarin pattern becomes clear if we consider a system where all three sibilants are followed by the high front vowel: [si ʂi ɕi]. A potential problem with this system lies in palatalization of the anterior coronals triggered by [i]. Palatalization, the superimposition of an [i]-like gesture on a primary gesture is known to interfere with non-labial consonants (Ladefoged & Maddieson Reference Ladefoged and Maddieson1996: 363–365). Labials are unaffected by a following high vowel since the movement of the tongue body toward the palate can be made independently from the labial gesture. In contrast, the articulation of coronal or dorsal consonants is necessarily affected by palatalization due to the interdependency of the tongue. For the coronal consonants, for instance, it is hard to make a constriction with the tongue front around the alveolar region while the tongue middle moves forward. Therefore, palatalization often results in changes in the primary articulation of coronals.
In Korean, for example, a palato-alveolar sibilant [ʃ] occurs as an allophone of the alveolar sibilant [s] before the high front vowel [i] (Martin Reference Martin1992). For languages like Korean, where there is only one coronal sibilant, the change in place by palatalization does not affect the phonological system. However, palatalization can cause phonological neutralization in languages where consonantal places are contrastive. In Acoma, retroflex consonants change to alveolo-palatals before front vowels, reducing the three-way contrast [s ʂ ɕ] to a two-way contrast [s ɕ] (Miller Reference Miller1985). In Telugu, the alveolar [s] is often realized as [ɕ] before front vowels in casual speech, reducing the three-way contrast [s ʂ ɕ] to a two-way contrast [ʂ ɕ] (Lisker Reference Lisker1963).
The cases of Acoma and Telugu show that languages may neutralize a sibilant place contrast when the cues to the contrast are weak. Specifically, palatalization of the coronal consonants obscures the contrast in sibilant places by reducing the distinction in frication noise. However, Mandarin presents an interesting case that languages can choose to maintain the place contrast by eliminating the environment that may jeopardize the phonological contrast: the high front vowel is replaced with approximants. As the current articulatory study shows, they are homorganic approximants of the corresponding sibilants, and the tongue body of the two segments is particularly retracted. In the absence of the extreme forward movement of the tongue body of a following [i], the three sibilants [s ʂ ɕ] can maintain their primary places when followed by the approximants, creating distinct acoustic signals in frication noise.
The current discussion can thus be summarized as follows: the high front vowel is avoided to eliminate a potential chance of palatalization of the preceding coronals, which may obscure distinct cues in frication noise. However, employing approximants is not the only way to achieve this goal. An alternative to this would be to simply employ some back vowels such as [ɨ] or [ɯ], resulting in a system of [sɨ ʂɨ ɕi], for example. Being back vowels, they do not interfere with the coronal constrictions of the preceding sibilants, making the frication noises distinct from each other. Thus, the next section further discusses the potential advantage of the approximants over the simple back vowels.
4.2 Maximization of the perceptual distance via cue enhancement
The difference between approximants and back vowels is one of constriction, so the question is whether there are articulatory reasons to prefer approximant constriction to the vocalic constriction. Although the approximants are articulatorily more complicated than the simple back vowels, they might be an articulatory compromise given the environment they occur in. That is, they are corresponding approximants of the preceding sibilants, so they can be made by slightly releasing the apical constriction until the turbulence noise ceases. However, it is not clear if this is indeed articulatorily easier than the complete release of the apical constriction to back vowels. Note that the tongue body is already retracted for these segments due to the inherent preference of dental and retroflex consonants for a retracted tongue body.
In comparison, a possible advantage based on perceptual reasons appears to be more straightforward. That is, those apical segments contain additional cues to the place of the preceding dental and retroflex consonants. Recall that the dental approximant is characterized by low F2 and the retroflex approximant itself is strongly retroflexed, presenting low F3. Since the additional information on the places of articulation of the preceding consonants is present throughout the voiced period, the perceptual distinction cued by inherent frication noise can be further enhanced. In contrast, the simple back vowels are limited as a source of additional perceptual cues to the place of preceding consonants. That is, the low F2 of the back vowels are distinct from the high F2 of [i], signaling the preceding non-palatal consonants, but crucially they do not provide further cues to distinguish two non-palatal consonants: [s] and [ʂ].Footnote 8
In summary, the advantage of the approximants seems to be two-fold. First, they do not interfere with the articulation of the preceding sibilants while the high front vowel may cause palatalization of the sibilants. This gives rise to an effect of preservation of the distinction in frication noise. Second, the additional cues to the sibilant places in the vocalic period further enlarge the perceptual distance between the three sibilant pairs. The simple back vowels do not create palatalization, but they are less preferable in that they do not carry any enhancing place cues to the sibilants. Table 5 summarizes the perceptual advantage of the approximants over the high front vowel and the simple back vowel.
Perceptual cues to the sibilant places. The hyphen represents the cues are not present.

4.3 The approximant account in summary
Despite the neat phonological account under the approximant analysis, it is worth noting potentially undesirable aspects of this account. First, this analysis introduces a very unique sound, the dental approximant [
] (note that [ɻ] occurs as an independent phoneme in Mandarin), presumably unattested in any other language. This may seem undesirable at first, but the pursuit of phonetic precision has ultimately led us to consider further phonological support for the approximant analysis. As discussed in the previous section, the presence of these approximants enables us to address the more fundamental question of why Mandarin has developed these unique sounds when other languages simply neutralize the phonological contrast between sibilants before the high front vowel. Although the syllabic fricative account could also be motivated by contrast maintenance, while not introducing new segments into the inventory, it rests on the assumption that frication noise in voiced segments enhances the percept of the preceding sibilants. However, there is no observable frication in the following apical segments.
Another potential objection to the approximant account is that it creates an unusual syllable type where an approximant serves as the nucleus of a syllable for Mandarin, which typically only has vowels as the nucleus of a syllable. While the vowel account completely avoids this issue, the approximant account only creates an ‘unusual’ syllable type, not an unattested one. That is, there is nothing phonologically unnatural in having both syllabic vowels and approximants; this scenario is consistent with the cross-linguistic universal that less sonorous nuclei imply more sonorous nuclei. An unnatural scenario would be one where fricatives or stops may serve as a syllable nucleus but approximants do not. Rather, the presence of these unique segments in Mandarin bears on a bigger phonological question, ultimately contributing to our understanding of phonology.
The approximant account is not only preferable for a phonological perspective, but it is also superior to the apical vowel account in terms of articulation and acoustics. Articulatorily, the notations [
] and [ɻ] capture their places of articulation straightforwardly, so the connection with the preceding sibilants [s] and [ʂ] becomes immediately available. Acoustically, the approximant analysis does not create an atypical association between the resonance cavity and formants, unlike the vowel analysis, falling within the general acoustics of rhotic and liquid sounds in other languages.
5 Conclusion
This study proposes that the apical segments exclusively occurring after the dental and retroflex sibilants in Mandarin Chinese can be best analyzed as corresponding approximants [
] and [ɻ]. The goal of introducing these unique segments to the system seems to be two-fold. First, as homorganic consonants, these segments do not affect the primary places of the preceding consonants. This results in preservation of the frication internal cue, frication noise, for the phonological contrast among three sibilants. The high front vowel, however, may jeopardize the place contrast, since it often triggers palatalization of anterior coronals which leads to neutralization of distinct places. Second, specific formant values of each approximant provide additional cues to the distinct sibilant places. Along with the frication internal cue, the external cues in the surrounding approximants appear to contribute to maximize the perceptual distance among three sibilants.
Acknowledgements
I would like to thank Lisa Davidson, Gillian Gallagher, Christine Shadle, Carina Bauman, the NYU PEP Lab and audiences at the Acoustical Society of America for their helpful discussion. I also thank the participants in this study and Peggy Mok for allowing me to use the recording facilities at the Chinese University of Hong Kong. Finally, I thank the editor of JIPA and the anonymous reviewers for the careful and thorough reviews of this manuscript.