Introduction
For the past 15 years, the majority of soybean [Glycine max (L.) Merr], corn (Zea mays L.), and cotton (Gossypium hirsutum L.) acreage planted in the United States has been glyphosate-tolerant (USDA ERS 2017). Most recently, discoveries resulted in the engineering of crops that are tolerant to POST applications of 2,4-D (Wright et al. Reference Wright2010). This technology permits the use of an additional mode of action to manage weeds, including species resistant to glyphosate.
As a systemic and selective herbicide, 2,4-D was the first active ingredient to be widely used to control broadleaf weeds in grass crops (Peterson Reference Peterson1967). Many forms of 2,4-D have been commercialized, but the most prevalent are amine salts or esters of 2,4-D (Peterson et al. Reference Peterson, McMaster, Riechers, Skelton and Stahlman2016). Although application technology improvements have been made that reduce spray particle drift and/or volatility, auxinic herbicides such as 2,4-D and dicamba are consistently ranked at or near the top of herbicide active ingredients implicated in crop injury complaints (Egan et al. Reference Egan, Barlow and Mortensen2014).
Recent research in formulation technology has resulted in the development of novel emulsion-forming formulations of 2,4-D (Shao et al. Reference Shao, Li, Tank, Qin, Wilson and Liu2013), including the pre-mixture formulation of 2,4-D choline (2-hydroxy-N,N,N-trimethylethanaminium) salt and glyphosate dimethylamine salt tested in this study. The formulation also offers an additional attribute of reduced volatility potential compared to other formulations of 2,4-D, exhibiting up to 96% and 88% lower emissions in laboratory experiments than ester and dimethylamine salt formulations, respectively (Hillger et al. Reference Hillger, Qin, Simpson and Havens2012).
Extensive academic, government, and commercial research have been performed to characterize the factors affecting spray drift potential as well as operational practices to mitigate it. In the United States, seminal work was carried out by the Spray Drift Task Force (SDTF) in the 1990s that identified the major application practices, meteorological conditions, and tank composition factors affecting drift (Hewitt Reference Hewitt2000), with a primary focus on aerial applications. Similar efforts continue in several international research institutions, expanding into spray drift research with ground-based application equipment to educate and train users (OECD 2009) as well as to develop models to predict potential drift (Butler Ellis and Miller Reference Butler Ellis and Miller2010; Holterman Reference Holterman, Van de Zande, Porskamp and Huijsmans1997; Teske et al. Reference Teske, Miller, Thistle and Birchfield2009).
Within current registration and management practice frameworks, the regulatory, stewardship, and liability implications of spray drift for pesticide registrants and users clearly indicate the need for well-defined methods for the application of drift reduction technologies (DRT). In several countries, such as Australia (APVMA 2008), the United Kingdom (CRD 2001), Germany (Julius Kühn-Institut 2013), and the Netherlands (Van de Zande et al. Reference Van de Zande, Porskamp, Michielsen, Holterman and Huijsmans2000), regulatory guidelines and testing methods for DRT have been implemented, although they are primarily related to application equipment and their operating conditions. The US EPA (2013) DRT program builds on some of these. Evaluation protocols for characterizing atomization profiles of equipment-based DRT in low- and high-speed wind tunnels have been proposed, based on American Society of Testing Materials (ASTM 2012) and SDTF experience. Additional protocols for field evaluations based on ISO (2006) and ASABE (2004) standards have permitted more complete testing of equipment and tank composition interactions, including drift reduction formulations.
Through a field experiment based on the international standards cited above and the EPA DRT standard test protocol, we aimed to characterize the physical particle drift potential of a newly developed pre-mixture formulation of 2,4-D and glyphosate, and compare it to an in-tank mixture of a commercially available 2,4-D dimethylamine salt and glyphosate potassium salt. The objective was to determine if pre-mixture formulations would result in less physical particle drift compared to tank mixtures currently on the market.
Materials and Methods
Field Site and Application Conditions
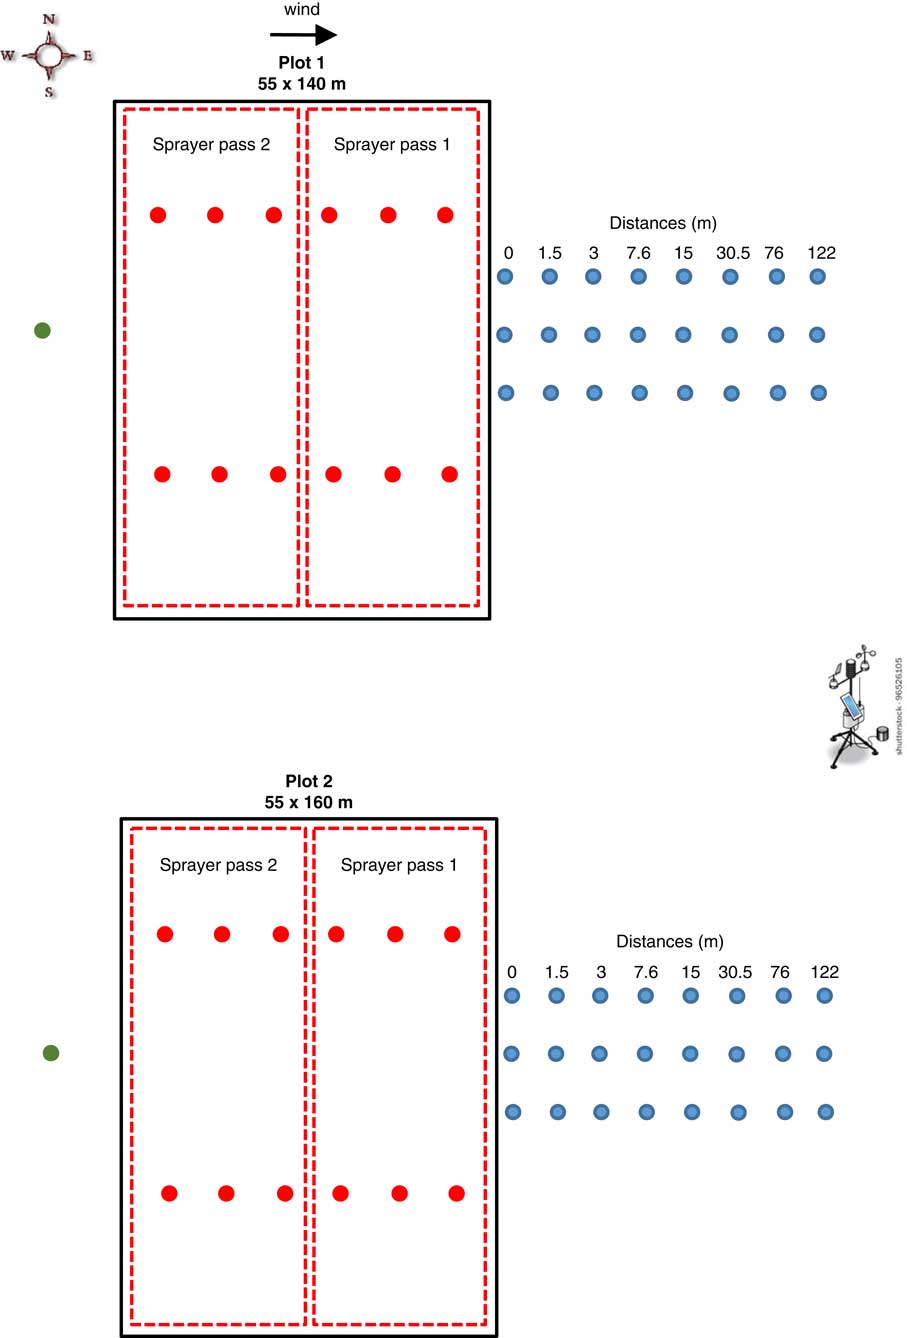
The study was conducted in a 13-ha field located on privately owned land approximately 3.2 km north of McCook, NE (40.239632 ˚N, –100.608416 13 ˚W). The field contained winter wheat stubble from the previous growing season, with rows oriented north–south. Two-swath herbicide applications, oriented perpendicular to the prevailing wind direction were made to two plots (Plot 1, 55 by 140 m; Plot 2, 55 by 160 m; Figure 1), using two self-propelled agricultural sprayers (John Deere model 4730). The systems had 3,000-L stainless-steel tanks and 27-m spray booms, segmented into seven sections controlled with a GPS-enabled rate control system. Each sprayer boom carried 54 five-position nozzle turrets spaced 51 cm apart. Boom height was 127 cm above the soil surface.
Field site layout. Dashed area indicates the treatment areas (sprayer passes 1 and 2), whereas colored points indicate the location of the samplers (green, upwind; red, in-swath; blue, downwind). Figure not to scale.

Each plot was divided into two equidistant downwind transects, which were used as a reference line to place two lines of six in-swath samplers, placed at 9-m intervals, beginning 5 m from the eastern plot boundary (Figure 1); the lines were approximately 70 m apart. One upwind sampler was placed 8 m from the western edge of each plot. Starting from the eastern edge, three downwind sampling lines were constructed. Spray deposition was collected with custom-made collectors, constructed with uncovered polyethylene Petri dishes (150 by15 mm) placed on sheet metal plates attached to wooden stakes that were used to position the collectors at the top of the wheat stubble (averaging 36 cm above ground level). Corners of the collectors were secured to the ground with flags. The sampling distances were 0, 1.5, 3, 7.6, 15, 30.5, 76, and 122 m from the last nozzle tip of the sprayer boom. The sampling lines were centered on each plot, and the distance between lines was 15 m (Figure 1).
Weather conditions were monitored with a Hobo MicroStation, model H21-002 logger system (Onset Computer Corp., Bourne, MA) mounted on a 3-m-tall tripod, located approximately 85 m from the downwind edges of the treatment area (Figure 1). Integrated wind speed/direction (model S-WCA-M003) and temperature/relative humidity sensors (model S-THB-M008) were installed. Data were continuously logged at 30-s intervals during the experiment.
Field Study Design
The field study was performed with two spray solutions: formulated 2,4-D choline plus glyphosate at a rate of 2.9% (vol/vol) (Enlist Duo Herbicide™; Dow AgroSciences, Indianapolis, IN), and an in-tank mixture containing 1.25% (vol/vol) of formulated 2,4-D dimethylamine salt (DMA4 IVM; Dow AgroSciences, Indianapolis, IN) and 1.11% (vol/vol) of formulated glyphosate (Roundup PowerMax; Monsanto, St. Louis, MO) to ensure the herbicide equivalency for both 2,4-D and glyphosate. The fluorescent dye rhodamine WT (Keystone Aniline Corp., Chicago, IL) was added to the tanks at rate of 0.2% (vol/vol) as a tracer.
Each spray solution was tested with three nozzles: an Extended-Range XRC11004VP, an Air Induction Extended-Range AIXR11004VP, and a Turbo TeeJet Induction TTI11004VP (Spraying Systems, Wheaton, IL). At the operating conditions used in this study, nozzles were classified according to the TeeJet catalog 51A to deliver medium, extremely coarse, and ultra coarse spray qualities, respectively. Herbicide applications were performed at a nominal rate of 168 L ha–1 at 13.2 km h–1 forward speed. The system pressure was controlled by rate controllers on the sprayers and maintained at 275 kPa, with 7- to 14-kPa fluctuations. The sprayer operating conditions (relatively low driving speed and moderate pressures) are not atypical for commercial applications (Wolf Reference Wolf2000).
The study consisted of a two- by three-factor design, consisting of two herbicide treatments and three nozzle types with at least five replications per herbicide–nozzle combination. A total of 36 runs (one run=one application) were executed, with 18 runs performed with 2,4-D plus glyphosate in-tank mixture and 18 with 2,4-D plus glyphosate pre-mixture. The study was conducted over 3 d (September 21 to 23, 2011). Ten runs were performed on day 1, 13 on day 2, and 13 on day 3.
Approximately 5 min after the application was performed, the downwind samples were capped and collected, beginning at the farthest downwind sample point. Upon collection, samples were placed in plastic sleeves and stored in dark containers. Applications alternated between plots, with applications of the in-tank mixture and the pre-mixture to Plot 1 and Plot 2, respectively. At the end of each day, containers were transported to the University of Nebraska–Lincoln West Central Research and Extension Center and kept in a cold chamber for later processing.
Wind Direction Deviation Tolerance
Under the ASABE standard 561.1 field drift trials guidance (ASABE 2004) and the Draft Generic Verification Protocol from the US EPA for evaluation of DRTs (EPA 2013), the treated area for a field drift study should be at least 100 m long. For ideal collection of downwind samples, the wind direction should be perpendicular to the application swaths; in practice, however, this will only rarely occur, so the standards provide guidance for the maximum wind direction deviation from perpendicular for collection of valid deposition data. For the dimensions of the experimental plots and downwind samplers used here, the allowable deviation was approximately 25 to 30 degrees. The deviation will have the most effect upon the samplers farthest downwind. Because minimal deposition was observed beyond 100 m downwind, the cutoff criterion was slightly relaxed to 33 degrees from perpendicular.
Analytical Procedures
Due to the high solubility of rhodamine WT dye in aqueous systems, it was hypothesized that dye quantification via fluorimeter could serve as a surrogate to determine the fractional deposition of the herbicide. Field-collected samplers were triple-rinsed with 16.7 ml of 1:1 (vol:vol) methanol:distilled-water solution to extract the deposited herbicide and dye. After extraction, a 0.73-ml aliquot from each sample was transferred into methacrylate cuvettes for fluorescence measurement using a fluorometer (Trilogy Lab Fluorometer; Turner Designs, Sunnyvale, CA). The instrument is equipped with a rhodamine WT application module (limit detection of 0.01 ppb of rhodamine) and was run in raw fluorescence mode using an empty cuvette to establish a “zero” baseline. Measurement of blank extraction solution was approximately 75 relative fluorescence units (RFU), and dye saturation was approximately 1,500,000 RFU. Dye deposition was calculated as fraction of applied deposition relative to the mean measurements from in-swath samplers.
Rhodamine WT dye stability in the sunlight was verified to ensure that sample handling in the field and subsequent analysis did not interfere with the results. Approximately 25 μl from three replicate tank samples were exposed to sunlight for 15 and 30 min and subsequently stored in the dark for 24 h, whereas controls were stored without sunlight exposure. Solutions were extracted and assayed as described previously. Samples exposed to sunlight averaged 99% and 96% of the unexposed controls for 15 and 30 min of exposure, respectively, indicating that rhodamine dye stability was adequate to provide reliable measurements for deposition.
To confirm the reliability of rhodamine WT dye to estimate herbicide deposition, analytical procedures were also conducted to quantify the 2,4-D deposition in the samplers. Chemical analyses of the extracted solutions were performed at the Product Safety Laboratories in Dayton, NJ. Aliquots of solutions were further diluted with acidified (0.1% acetic acid) 50:50 (vol:vol) methanol:water, vortexed and centrifuged in a 96-well plate, and analyzed by liquid chromatography tandem mass spectrometry (Perkin Elmer series 200 HPLC interfaced to an Applied Bio-Systems/Sciex 4000 Tandem Mass Spectrometer). The method limit of detection and quantitation for 2,4-D were 0.075 ng ml–1 and 0.125 ng ml–1, respectively. In terms of the nominal application rate, these values respectively correspond to 0.0004 and 0.0006% of 800 g 2,4-D ae ha–1. The actual deposition was calculated based on the collector dimensions and applied flow rate.
Field Study Data Analysis
To ensure that variations in wind speed had no impact in the measured deposition, PROC REG (SAS Institute, Cary, NC) was used to test whether there was a significant regression relationship between deposition and wind speed in each run. Because the regression slopes were not consistently different from zero (in some cases, wind speed was negatively correlated with deposition), an ANOVA was appropriate for this study. Dye and chemical analysis data were imported in the JMP Professional (v. 12.2, SAS Institute, Cary, NC) statistical software package. An ANOVA (assuming unequal variance) was performed in JMP to examine the relationship among tank compositions, nozzles, and wind speed. For each treatment, measurements from the 12 in-swath samplers were averaged as representative of the actual application; downwind samples were then expressed as a fraction of this value (i.e., fraction of applied).
As a model of deposition with distance, a two-parameter power-law expression with distance (i.e., fractional deposition=a*distanceb) was fitted to the analytical data, employing nonlinear fitting techniques in JMP. This functional form is mathematically identical to the log-log transformed linear-fit methods previously used by Agriculture and Agri-Food Canada (PMRA 2005; Wolf and Caldwell Reference Wolf and Caldwell2001).
To allow the estimation of percentile levels of deposition from the data, a quantile regression approach (Koenker and Hallock Reference Koenker and Hallock2001) was applied to the data. Quantile regression performs fitting upon a defined quantile (e.g., 90th percentile) of the data, rather than yielding a fit upon the mean of the response variable. Quantile regressions were calculated in the quantreg (version 4.76) package in the R statistical programming environment (R Development Core Team 2005) to yield parameters for 50th and 90th percentile fits. Only downwind distances greater than 3 m were included in the regression analysis because of the high variability in the close-to-field measurements. A similar approach was taken by the SDTF in their development of generic ground-based deposition curves (Teske et al. Reference Teske, Bird, Esterly, Ray and Perry1997).
Results and Discussion
Weather Observations
Skies were clear to partly cloudy (0 to 3/4 cloud cover) throughout the 3 d of applications. On the first day, air temperature ranged from 15 to 21 C, relative humidity averaged 36%, and wind speeds were 2.0 to 4.5 m s–1, whereas the same weather parameters on the second day were 22 to 27 C, 25%, and 2.7 to 5.0 m s–1, respectively. On the third day, air temperature ranged from 21 to 28 C and wind speeds ranged from 1.0 to 3.0 m s–1 (humidity data were not logged). Although occasional deviations occurred, applications were carried out when the prevailing wind direction was from the west. When deviation was greater than 33 degrees, data from the treatment were excluded from the analysis.
Deposition
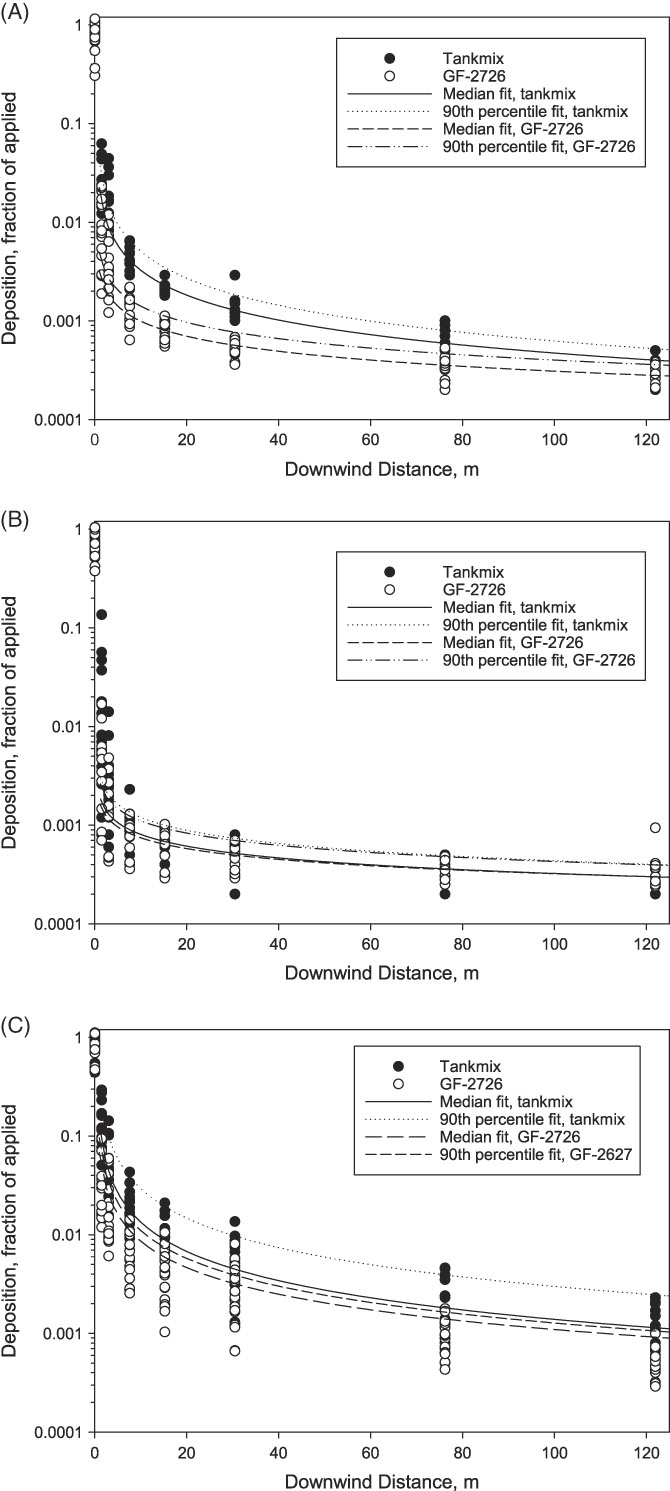
The complete fractional dye deposition results are shown in Figure 2A to C, for the AIXR, TTI, and XR nozzle applications, respectively. The XR nozzle, as expected, exhibited the highest deposition with distance, followed by the AIXR and TTI nozzles. For the Enlist Duo treatments, the deposition pattern was very similar for the AIXR and TTI nozzles.
Deposition of tank mix (2,4-D and glyphosate) and Enlist Duo (GF-2726) sprayed with (A) TeeJet AIXR11004, (B) TTI1104, and (C) XRC11004 nozzles at different downwind distances. Fraction of applied deposition (measured with rhodamine dye tracer) relative to the average in-swath deposition for the respective treatments.

Spray drift is intuitively a strong function of wind speed for a particular application technology, as winds serve as the primary horizontal transport driving force for droplets. The wind speeds in the current study spanned a relatively narrow range from 2.0 to 4.8 m s–1, and no consistent correlation with wind speed could be determined for a given nozzle/herbicide combination. Employing paired comparisons of the dye depositions at 30 and 76 m downwind, the AIXR showed a reduction in deposition between the in-tank mixture and pre-mixture [average reduction of 65% (P=0.0001) at 30 m; 47% (P<0.0001) at 76 m]. The XR nozzle also exhibited an average reduction of 48% (P=0.012) at 30 m and 45% (P=0.008) at 76 m, whereas the use of the pre-mixture (Enlist Duo) exhibited no advantage when applied through the TTI nozzle (P=0.611 at 30 m; P=0.552 at 76 m). In fact, the delivery of the pre-mixture (Enlist Duo) through the AIXR nozzle performed almost identically to the TTI nozzle (P=0.699 at 30 m; P=0.840 at 76 m). Further trials at a wider range of wind speeds or mechanistic modeling could yield further insights upon the relationship of drift to wind speed for these herbicides formulations.
Comparison of Dye and Chemical Assay Results
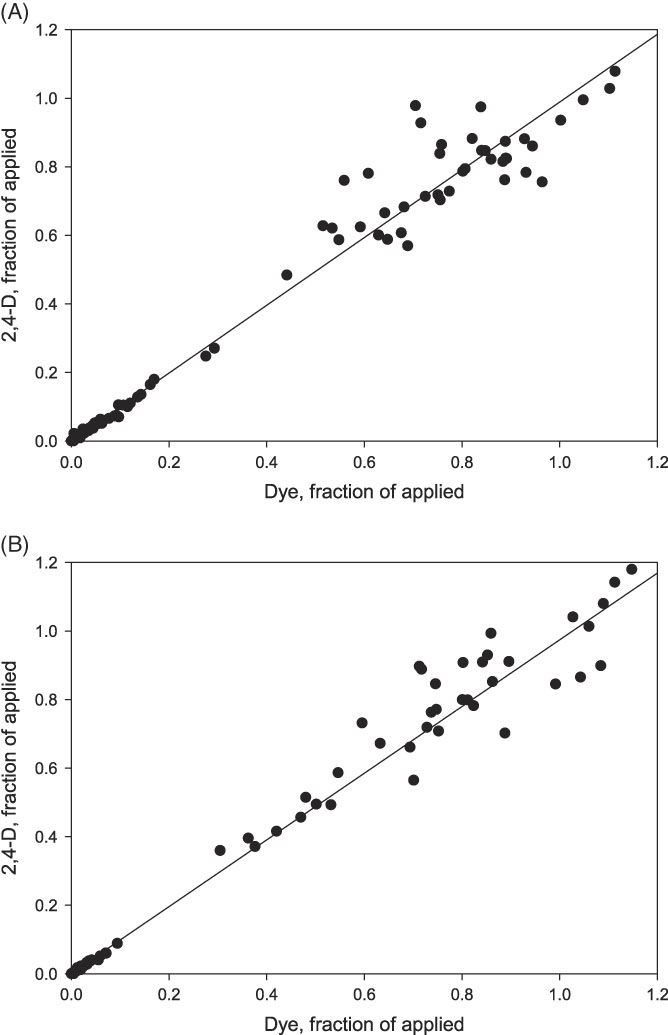
To reveal the potential relationship between the analysis performed via fluorometer (rhodamine dye) and HPLC (2,4-D quantification), simple one-to-one plots for the pre-mixture (Enlist Duo) and the in-tank mixture treatments were constructed. Both plots yield a clearly linear relationship, with slopes of nearly one (Figure 3; Enlist Duo P=0.541; in-tank mixture P=0.803) and a high degree of correlation (R2>0.98). The presence of scattered data at the higher concentrations is possibly reflecting the near-saturation with the dye measurements in the fluorometer; however, the high degree of linearity indicates that the use of rhodamine WT dye as a surrogate for herbicide to determine deposition on a fractional basis was appropriate. For that reason, the results reported herein are based on rhodamine WT dye measurements.
Correlation between deposition in fraction of applied measured via rhodamine dye (fluorometer) and 2,4-D quantification (HPLC). (A) Tank mix: y=5.24e–4 + 0.98x; R2=0.983; P=0.803; (B) Enlist Duo: y=1.34e–3 + 0.973x; R2=0.983; P=0.541.

Fitting of Deposition Curves
For both solutions, the magnitude of the multiplicative a parameter follows the general order of XR>AIXR>TTI, the same trend as the field data (Table 1). The resulting deposition curves are shown in Figure 2A to C for the AIXR, TTI and, XR nozzles, respectively. Based on these curves, the relative drift reduction at a given distance was calculated relative to the deposition delivered through the medium droplet quality flat-fan XR nozzle from the 2,4-D plus glyphosate in-tank mixture.
Quantile regression parameters ± SEM obtained from a nonlinear fitting-curve technique to estimate the percentile levels of deposition (fraction of applied deposition=a*distanceb) for an in-tank mixture of 2,4-D plus glyphosate and a pre-mixture of 2,4-D plus glyphosate (Enlist Duo) sprayed with three different nozzles evaluated in a field drift study.

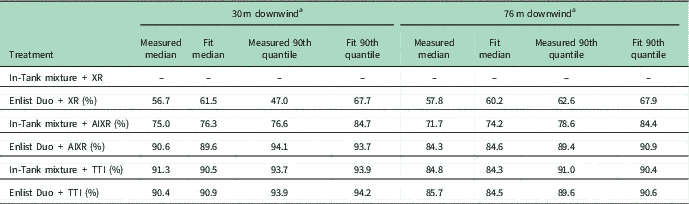
A comparison of the fit and measured reductions at 30 and 76 m is shown in Table 2. The fitted-curve results reflect the same trends as the measured data, with the most variation at the 90th quantile, as might be expected if there are outliers. Examining the fitted in-tank mixture results only, the AIXR nozzle provided a range of 75% to 85% reduction of deposition (median to 90th quantile), whereas pre-mixture formulation further mitigated the deposition by 8% to 15% versus the baseline. For the TTI nozzle, the nozzle-only and formulation effects are nearly identical and essentially equivalent to the reductions observed with the AIXR–pre-mixture combination.
Reduction in spray drift of a pre-mixture of 2,4-D plus glyphosate (Enlist Duo) relative to 2,4-D DMA plus glyphosate (Roundup PowerMax) tank mixture sprayed with XR nozzle.

a Calculations performed with In-Tank mixture + XR nozzle as baseline
The deposition curves reported here may also serve to compute no-spray distances required for protection of sensitive off-target organisms (such as an adjacent sensitive crop or desirable wild species). If, for example, an off-target organism endpoint for drift risk assessment was considered to be 0.1% of deposition, the median setback distance would be 185 m when considering 2,4-D plus glyphosate applied with the XR nozzle as a baseline treatment. Conversely, the corresponding distance for the pre-mixture (Enlist Duo), applied through an AIXR nozzle, would be approximately 10 m (a 95% reduction). Corresponding values at the more conservative 90th quantile level are greater than 400 m for the XR nozzle-in-tank mixture and 20 m for the AIXR-pre-mixture combination.
In comparison with mixtures of standard 2,4-D plus glyphosate, Enlist Duo provided substantial drift reduction for both XR and AIXR nozzles. Based upon the deposition of tracer dye at 30 m downwind, the relative deposition was reduced on average by 48% and 65% for the two nozzles, respectively. No differences were found between the herbicide mixtures sprayed with the TTI nozzle. In fact, based upon downwind deposition, the results for the pre-mixture (Enlist Duo) sprayed with AIXR nozzles were equivalent to the TTI nozzles. The overall droplet spectrum created by the TTI nozzle can reduce foliar coverage of these herbicides, potentially negatively affecting weed control (Ruen et al. Reference Ruen, Hillger, Love, Olson and Ellis2012). Thus, applying the pre-mixture with AIXR nozzles will generate substantially lower drift potential while providing acceptable weed control.
The release of 2,4-D–resistant crops (combined with glyphosate- and glufosinate-resistant traits) will provide an additional tool for managing difficult-to-control or herbicide-resistant weeds in cotton, corn, and soybeans, such as Palmer amaranth (Amaranthus palmeri S. Watson) and common waterhemp [Amaranthus tuberculatus (Moq.) Sauer]. As evidenced in this research, applications of the pre-mixture (Enlist Duo) applied with air-inclusion nozzle technology can reduce potential spray drift by 84% or more relative to a standard in-tank mixture of 2,4-D amine salt plus glyphosate when applied with a standard flat-fan nozzle, indicating the importance of identifying optimal application practices. Additional drift control strategies such as changes to carrier volume, optimal boom height, accounting for local environmental conditions, and appropriate drift control agents could further minimize 2,4-D off-target movement (Felsot et al. Reference Felsot, Unsworth, Linders, Roberts, Rautman, Harris and Carazo2010). Moreover, the low volatility of the pre-mixture (Enlist Duo) suggests minimized risk of vapor movement to sensitive crops when compared to 2,4-D ester and amine formulations (Hillger et al. Reference Hillger, Qin, Simpson and Havens2012; Sosnoskie et al. Reference Sosnoskie, Culpepper, Braxton and Richburg2015). Thus, the drift control features available in the pre-mixture (Enlist Duo) and the low vapor loss potential, combined with labeled and optimal application parameters could substantially reduce the risk of 2,4-D injury to nontarget crops.
Future studies should consider the effects of higher wind speeds upon drift, as well as exploring additional nozzle types and other operating parameters. The effect of adjuvants and other tank-mixture partners is also of interest, but given that nozzle and adjuvant effects are mostly on droplet size spectra, assessments of potential impacts on spray drift can effectively be characterized under controlled conditions in wind tunnels following US EPA, ISO, ASTM, and ASABE standards.
Acknowledgments
We thank R. Henry and A. Geyer (University of Nebraska–Lincoln), M. Ledebuhr (Application Insight LLC), J. Gesell (Dow AgroSciences LLC), and A. Xu (Product Safety Labs, Inc.) for laboratory and field support, as well as the Plains Equipment Group, McCook, NE, for the use of the spray equipment. The assistance of the faculty and administration of the University of Nebraska–Lincoln West Central Research and Extension Center for use of equipment and facilities is also greatly appreciated. This study was supported by Dow AgroSciences LLC (now Corteva Agriscience, Agricultural Division of DowDuPont). This project is based on research that was partially supported by the Nebraska Agricultural Experiment Station with funding from the Hatch Multistate Research capacity funding program from the USDA National Institute of Food and Agriculture. No conflicts of interest have been declared.