Introduction
Lambert Glacier (Fig. 1), which discharges into the floating Amery Ice Shelf in an embayment on the coast of Antarctica south of India, is the largest ice stream in East Antarctica with a width of about 90 km in its lower reaches, a length of about 400 km and a catchment area of 870000 to 902000 km2 (Reference Giovinetto and BentleyGiovinetto and Bentley, 1985; Reference McIntyreMcIntyre, 1985). The net mass balance of the entire catchment area up-slope from the Lambert Glacier system was estimated by Reference AllisonAllison (1979) and Reference Allison, Young and McdhurstAllison and others (1985), who found it to be positive, and by Reference McIntyreMcIntyre, (1985), who, inferring a smaller catchment area and lower accumulation rate, estimated a net mass balance with uncertainty range bracketing zero. A positive net mass balance for the Lambert Glacier system was estimated by Reference AllisonAllison (1979).
Previous satellite-radar altimeter studies of the Lambert Glacier-Amery Ice Shelf system have been carried out by Reference Brooks, Williams, Ferrigno, Krabill, Oliver, James and JagoBrooks and others (1983), Reference Partington, Cudlip, McIntyre and King-HelePartington and others (1987), Reference Zwally, Stephenson, Bindschadler and ThomasZwally and others (1987) and Reference Herzfeld, Lingle and LeeHerzfeld and others (1993). In a companion paper, Reference Herzfeld, Lingle and LeeHerzfeld and others (1994) have shown, from kriging of the Seasat and Geosat ERM altimetry, that the grounding line of Lambert Glacier advanced between 1978 and 1987–89.
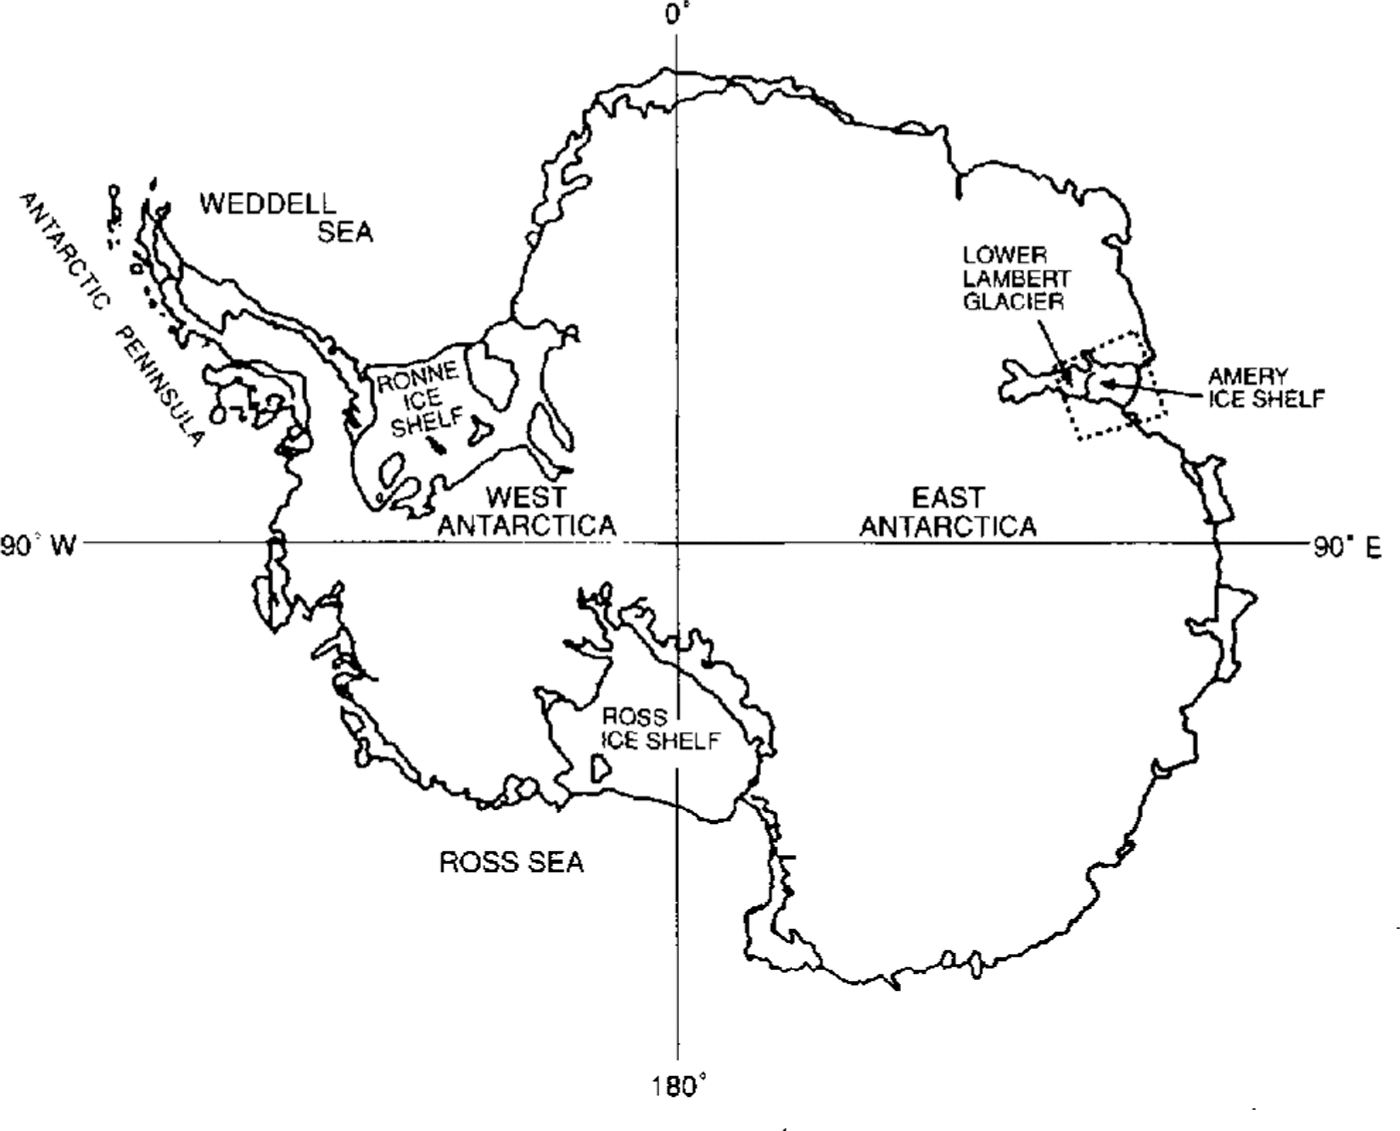
In this paper, altimetry from Geosat ERM, extending from austral late spring 1986 through austral late winter 1989, and Seasat, extending throughout austral late winter 1978 (3 months only), are employed to measure mean changes in elevation on Lambert Glacier north of 72.1˚ S, which is the maximum southern extent of orbital coverage for both satellites. The mean change in the surface elevation on lower Lambert Glacier is determined at the Geophysical Institute using orbit cross-over analysis, with random noise levels reduced by low-pass filtering of the along-track data, and with the inter-satellite orbit bias estimated from a cross-over analysis of altimetry from a region of sea ice seaward of the Amery Ice Shelf. The same cross-over analysis is also carried out using unfiltered altimetry. In addition, the cross-over analysis has been carried out independently at NASA-Goddard Space Flight Center (GSFC), using (i) altimetry with orbit bias minimized by adjusting the Geosat ERM and Seasat orbits into a common ocean surface; and (ii) using non-orbit-adjusted altimetry. (A description of the orbit-adjustment procedure has been given by Reference Zwally, Brenner, Major, Martin and BindschadlerZwally and others (1990). See also Reference Lingle, Brenner, Zwally, DiMarzio, Weller, Wilson and SeverinLingle and others (1991).)
Orbits And Preliminary Data Processing
The orbits for Geosat ERM were computed by Reference Haines, Born, Rosborough, Marsh and WilliamsonHaines and others (1990) and were recomputed for Seasat by Reference HainesHaines (1991), using the Goddard Earth Model (GEM) T2 gravitational potential field (Reference MarshMarsh and others, 1989). The Antarctic elevation measurements employed in this study, which were obtained by two different satellites, are therefore referenced to orbits computed from the same model of the gravity field. The radial precision of the GEM T2 orbits is estimated to be about 0.35 m rms. (Reference Haines, Born, Rosborough, Marsh and WilliamsonHaines and others (1990)). The Geosat ERM (1987-89) and Seasat (1978) altimeter data from the Antarctic ice sheet are retracked as described by Reference Martin, Zwally, Brenner and BindschadlerMartin and others (1983) and corrected for atmospheric effects and solid-earth tides as described by Reference Zwally, Bindschadler, Brenner, Martin and ThomasZwally and others (1983). The altimeter-derived elevations are not slope corrected. Constant correlation is assumed between the "altimeter surface" and the “real surface” at successive times, such that mean changes in elevation are measured accurately without correction for slope-induced errors.
Measurement Noise And Data Filtering
Ice-sheet satellite-radar altimeter data are characterized by high and spatially varying noise levels, primarily due to sloping surfaces and undulations which cause backscatter from points off-nadir. The noise levels are generally highest near the margins of ice sheets, where pronounced surface undulations are caused by the bottom topography, and in areas of rugged relief such as Lambert Glacier and the Amery Ice Shelf, where a fast-flowing ice-stream/ ice-shelf system is bounded by the relatively steep slopes and nunataks of the more sluggish inland ice sheet. Noise in the data is also likely to be attributable, in part, to seasonal variations in penetration depth due to temperature changes and, at low elevations, the presence of surface meltwater during the austral summers (Reference Ridley and PartingtonRidley and Partington, 1988).
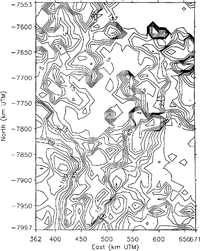
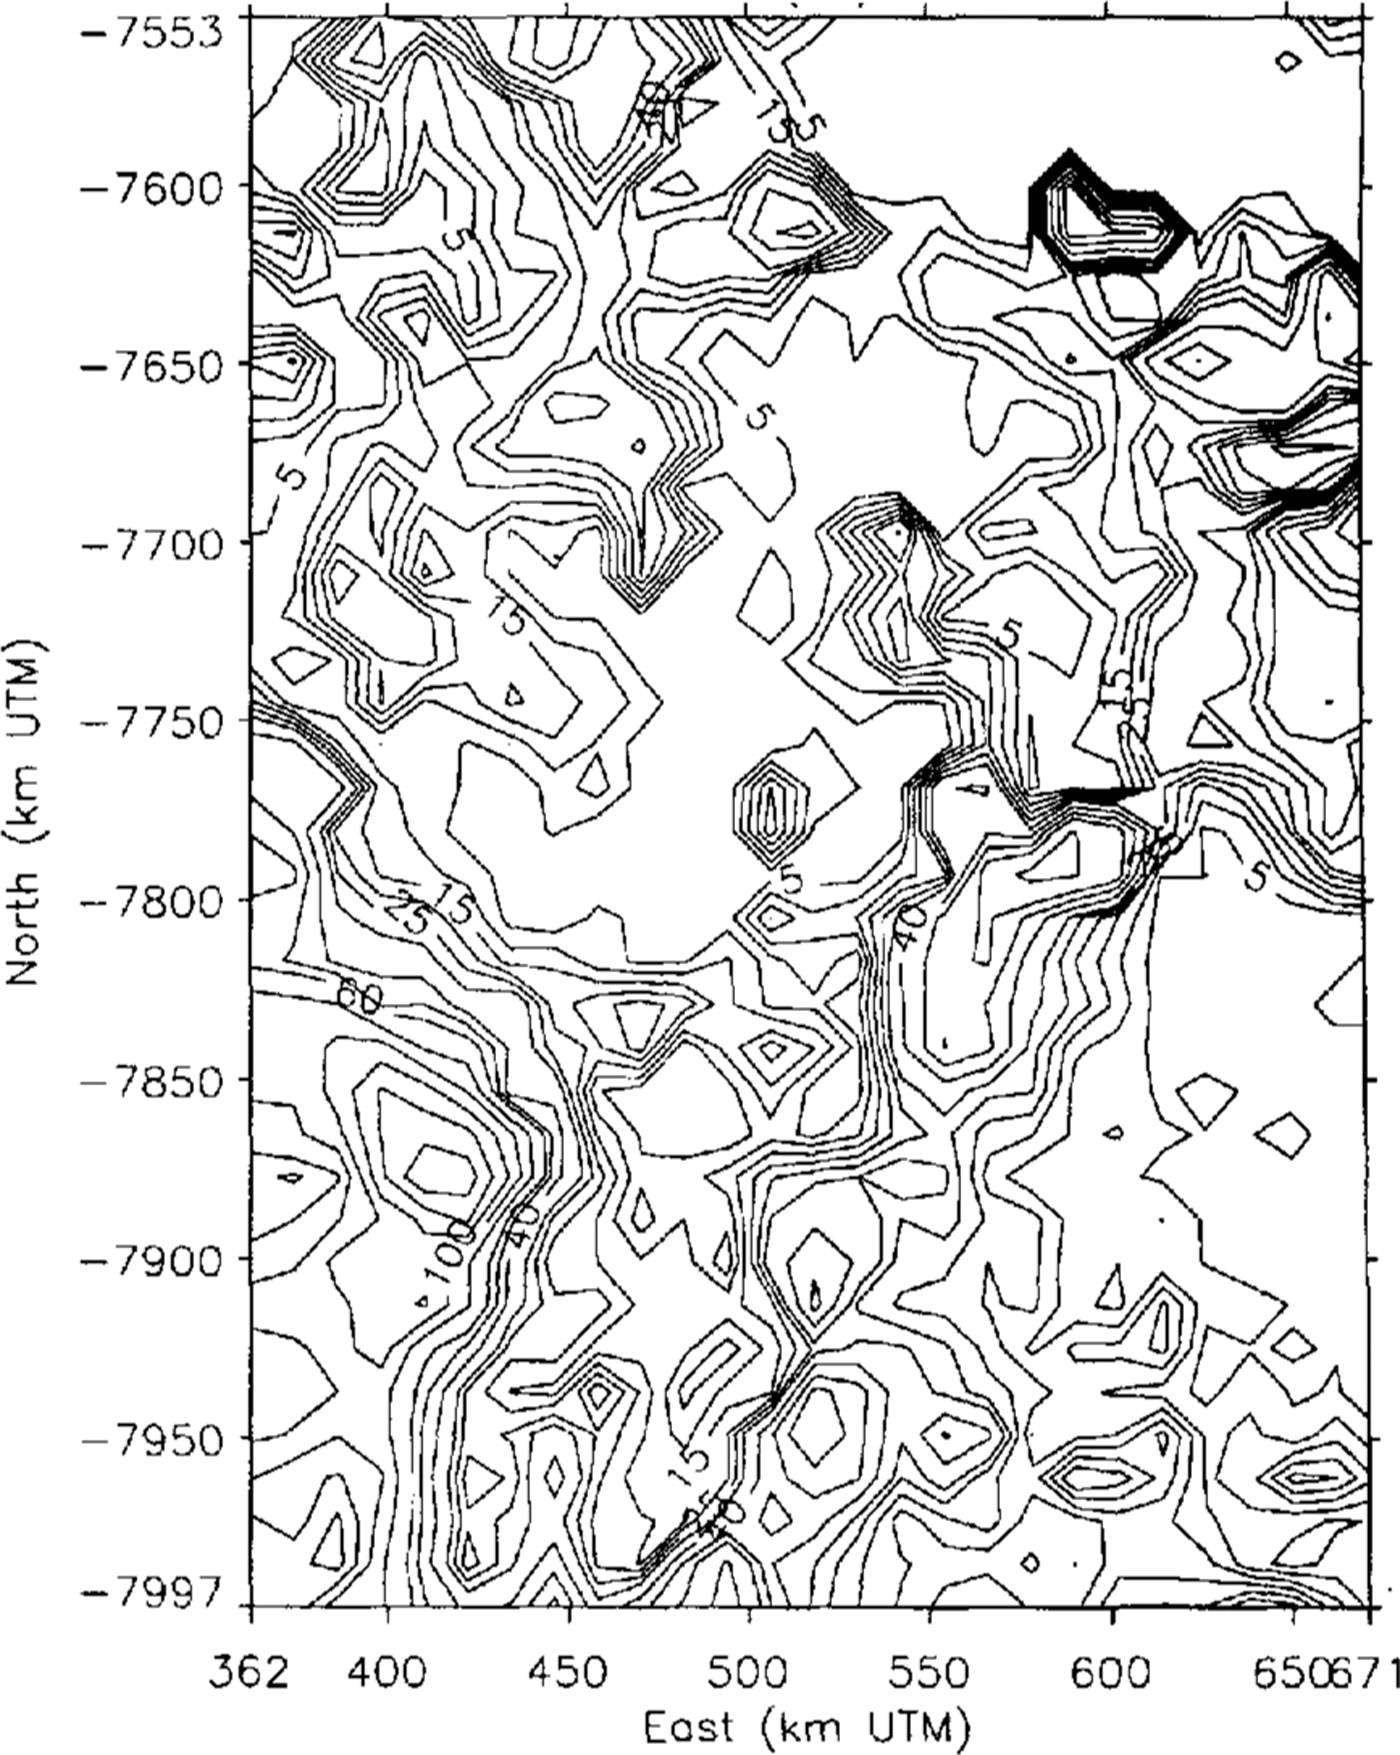
Geosat ERM unfiltered altimetry noise levels (in m) in the Lambert Glacier-Amery Ice Shelf area, estimated using the variogram method and mapped on a 12 km grid. The coordinate system is Universal Transverse Mercator (UTM) with 70˚E as the “central” meridian. The map area is 444 km north-south by 309 km east west.
Seasat-altimetry noise levels (in m) throughout the map area shown in Figure 2, estimated using unfiltered data.

The noise levels in the data are estimated as a function of position using variogram methods, as described by Reference Hillger and Vonder HaarHillger and Vonder Haar (1988), Reference Lingle, Brenner and ZwallyLingle and others (1990) and Reference Herzfeld, Lingle and LeeHerzfeld and others (1993), with a variogram computed from the data in the local neighborhood of each point of a 12km grid defined in a Universal Transverse Mercator (UTM) coordinate system. At a given grid point, the noise level so estimated is the standard error of a large number of repeated measurements at the same geographic location, within the local neighborhood of the point. The results, for the Geosat ERM data, are shown in Figure 2. Over the flat Amery Ice Shelf (center to top center of Figure 2), the noise levels are mostly below 5 m with peaks to 20‐25 m. Over the more undulating Lambert Glacier, the noise levels are mostly 5‐15 m, with peaks to about 40 m
Figure 3, which shows the similarly computed noise levels for the Seasat altimetry, does not bear a close resemblance to Figure 2, because of the great difference in the quantity and density of the two data sets. It was necessary to select Seasat data from a larger circular neighborhood around each grid point and to accept a smaller number of data for each variogram (500 points in the case of Seasat versus 1000 points for the case of Geosat). The apparent difference in the distribution of data noise for the two satellites is likely to be an artifact of these factors, because of the similarity in design of the two altimeters (see e.g. Reference MacArthur, Marth and WallMacArthur and others, 1987; Reference Sailor and LeSehackSailor and LeSchack, 1987).
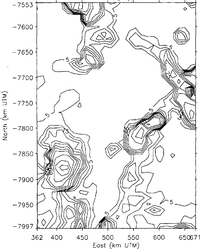
Low-pass frequency filtering of the along-track data is employed to reduce the random noise levels. Along each orbit track, only data segments consisting of at least five sequential data without a gap are accepted. Each segment is smoothed using the low-pass frequency-filtering algorithm of Press and others (1989, p. 495‐97). This method is employed because the high-frequency components which represent noise or features on the ice-sheet surface of such short spatial wavelength as to be of no interest in connection with the ice dynamics are cleanly removed, while the longer-wavelength components, which represent features of greater physical significance, are retained without modification. That is, spurious wavelengths are not introduced. Also, this method results in zero vertical displacement of the mean for each segment smoothed and hence for the entire surface. Smoothing is carried out over a horizontal scale of three data points, which is equivalent to roughly 2.5 ice thicknesses in the vicinity of the grounding zone of Lambert Glacier where the ice thickness is about 800 m (Reference Budd, Corry and JackaBudd and others, 1982). (The l0s-1 elevation measurements are spaced at 662 m along the sub-satellite ground tracks.) The noise levels for the filtered Geosat ERM data, computed using the same variogram method, are shown in Figure 4. The random noise levels are reduced, on average, by about 4045% by low-pass filtering of the along-track data. The Seasat data are similarly filtered.
Data noise levels (in m) computed from low-pass filtered Geosat ERM altimetry throughout the region shown in Figure 2.

Erm Seasons And Orbit Cross-Overs
The Geosat ERM data are subdivided into sequential 91 d “seasons”, with austral late winter defined to coincide with the Seasat time frame of 1978, which was 10 July to 9 October. This definition fixes the times of the other seasons. The mean changes in the surface height between Seasat and the sequential seasons of Geosat ERM are computed by “crossing” the ascending Seasat orbits with the descending orbits of each Geosat ERM season; the descending Seasat orbits are then “crossed” with the ascending orbits of each Geosat ERM season. The resulting cross-over differences are then combined using the unbiased weighted-averaging method described by Reference Lingle, Brenner and ZwallyLingle and others (1990, p.160-61, equations (4) - (6)). In principle, this method would result in cancellation of the ascending-descending orbit bias if the cross-over differences were between the orbits of only one satellite. Since the cross-over differences are between the orbits of two different satellites, however, additional means must be employed to estimate the inter-satellite orbit bias. This point is discussed further below.
Error Propagation
The standard error of the Geosat altimeter-derived elevation at a given orbit cross-over point is taken to be the noise level in the local vicinity of the point. For the case of the low-pass filtered data, the noise level is obtained from the grid shown contoured in Figure 4 by tranforming the latitude-longitude coordinates of the cross-over point to UTM (the coordinate system of the noise grid) and using bi-linear interpolation. The standard error of the Seasat altimeter-derived elevation at the same cross-over point is similarly obtained from the low-pass filtered version of the Seasat noise grid shown in Figure 3. The standard error of a cross-over difference is 1 then (e g 2 + e s 2)1/2, where e g and e s are the local Geosat and Seasat noise levels, respectively. The mean changes in the surface height are computed using unbiased weighted averaging of the cross-over differences (the weights sum to 1), with each cross-over difference weighted in proportion to the inverse square of its standard error. The influence of cross-over differences from areas characterized by exceptionally high noise levels is thereby suppressed. The errors associated with the random noise levels in the data (Fig. 4)are propagated through the computations of the cross-over analysis as described by Reference Lingle, Brenner and ZwallyLingle and others (1990, see equations (4) (8)).
Estimates Of Orbit Bias
The Geosat ERM and Seasat orbits are self-consistent in the sense that they are computed from the same GEM T2 gravitational model but it must be assumed that there may be a systematic, geographically correlated bias (i.e. vertical offset) between the two sets of orbits. This possibility is investigated by computing the apparent mean increase of the surface height throughout a region of sea ice seaward of the calving front of the Amery Ice Shelf. Although sea ice can be rough and irregular on a small scale, over large areas the austral winter sea ice can be considered an approximately “level” reference surface that is within a few tenths of a meter of sea level. It is assumed that the mean change in this surface, computed on a same-season basis between Seasat and the Geosat ERM, should be approximately zero.
The sea-ice data are selected from a set of adjacent “ocean rectangles” bounded by (i) 68.5°-69° S, 72.5°- 77.5° E; (ii) 68°-68.5° S, 70°77.5° E; (iii) 67.5°68° S, 70°-80° E; (iv) 67°-67.5° S, 60°-82° E; and (v) 63°-67° S, 60°-82° E. Only cross-over differences with absolute value ≤ 5m are accepted (which includes almost all of them).
The result, computed at the Geophysical Institute, using low-pass filtered data, is an apparent mean increase in the sea-ice surface of -32 ± 176mm between austral late winter 1978 and austral late winter 1987 (403 crossovers), 48 ± 20I mm between the same seasons of 1978 and 1988 (309 cross-overs) and -26 ± 267 mm between the same seasons of 1978 and 1989 (175 cross-overs). Taking an unbiased weighted average, with each height change weighted in proportion to the inverse square of its standard error, yields an apparent mean increase in the surface height of the sea ice between Seasat and Geosat ERM of 3.0 ± 120mm, which is negligible. We, therefore, apply no correction for inter-satellite orbit bias, in the case of the low-pass filtered data. See Figure 5, which does not suggest any systematic shift of the sea-ice surface during Geosat ERM relative to Seasat.
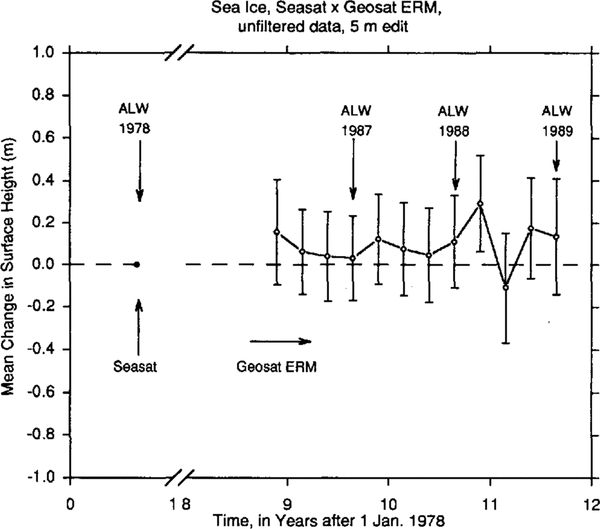
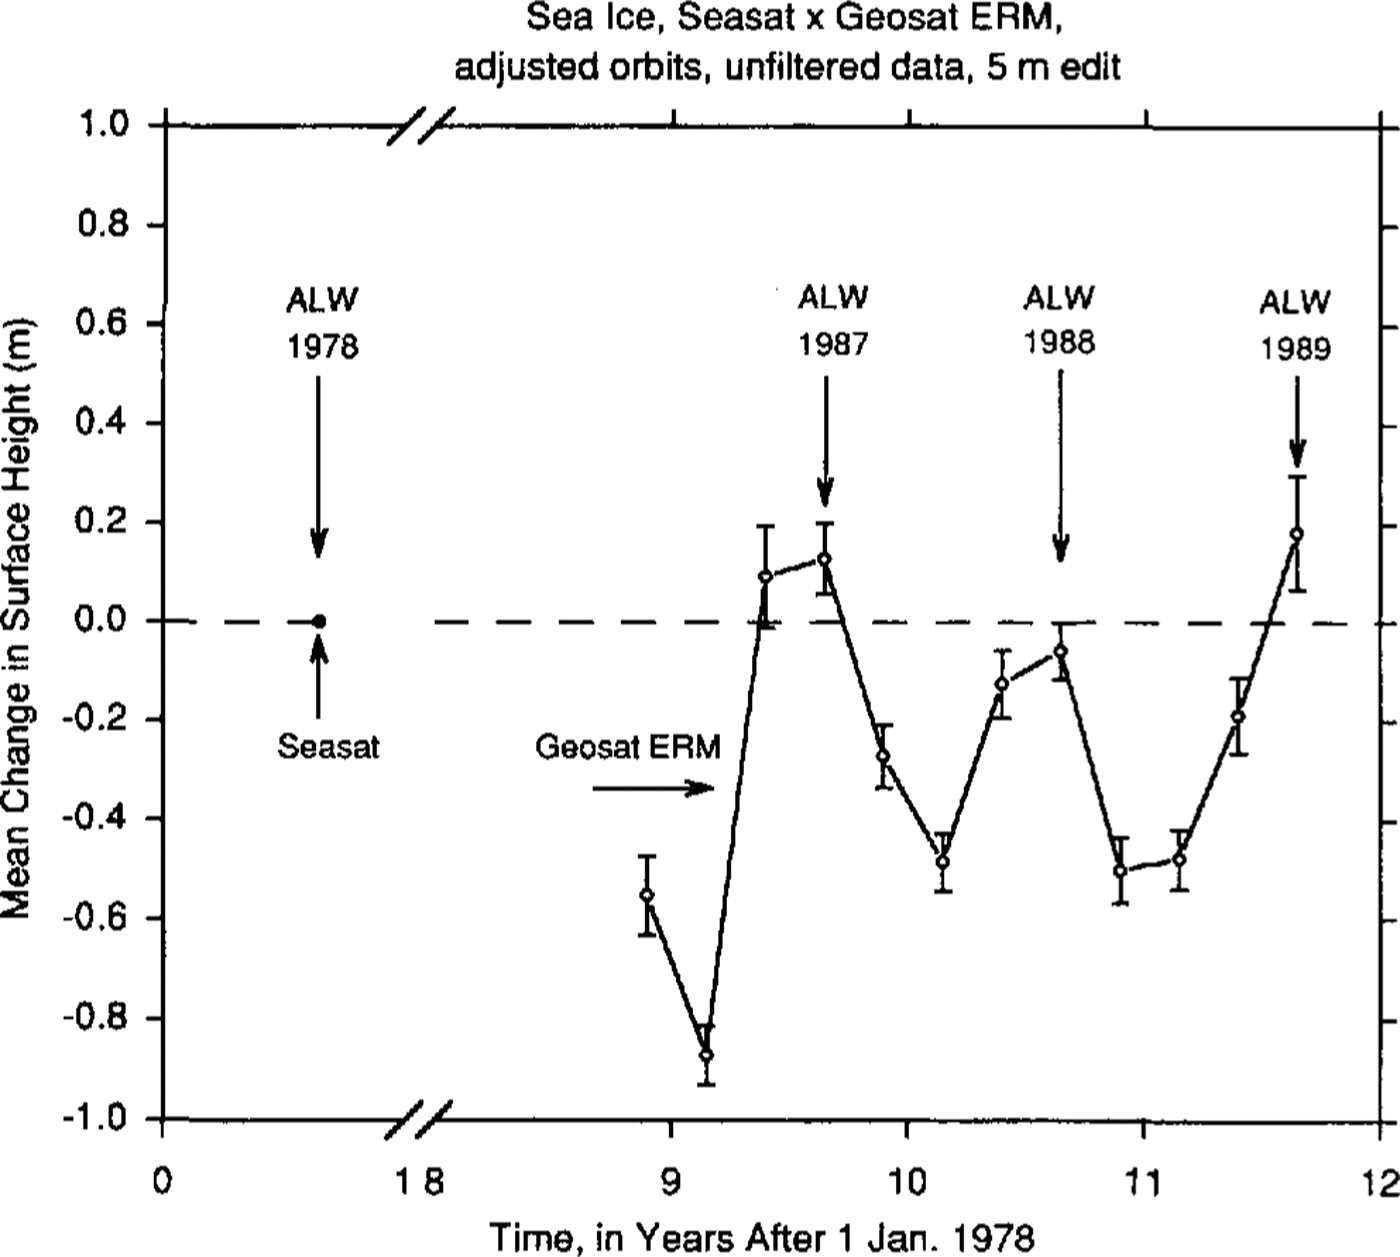
The same cross-over analysis is also carried out over this region using data that are not low-pass filtered. The result is an apparent mean increase in the sea-ice surface of 31 ±201 mm between austral late winter 1978 and austral late winter 1987 (792 cross-overs), 111±221mm between the same seasons of 1978 and 1988 (655 crossovers) and 136±276mm between the same seasons of 1978 and 1989 (421 cross-overs). Taking an unbiased weighted average, as above, yields an apparent mean increase of the sea-ice surface between Seasat and Geosat ERM of 83 ± 131mm. This value, although small and with uncertainty range overlapping zero, is taken as an estimate of the vertical inter-satellite bias in the case of the unfiltered data. See Figure 6, which suggests a small positive shift of the sea-ice surface during Geosat ERM relative to Seasat. (This is not a contradiction, because some of the data were eliminated during low-pass filtering, as described above, and by 5 m editing. Thus, in the case of the data not low-pass filtered, there are more acceptable cross-over differences.)
Mean changes in the surface height throughout a region of sea ice seaward of the calving front of Amery Ice Shelf, from austral late winter 1978 (Seasat, dot on datum at left) to 1986-89 (the Geosat ERM), computed using low-pass filtered altimetry

Mean changes in the surface height throughout the same region of sea ice as in Figure 5, computed using unfiltered altimetry.

In addition, the same cross-over analysis is carried out over the sea ice within the same five “ocean rectangles”, at GSFC, using the altimetry with orbits adjusted into a common ocean surface external to the ice sheet. The common ocean surface is derived from the Geosat ERM global ocean-data set. The results for all seasons are shown in Figure 7. There is an apparent mean increase in the surface height of 128 ± 72 mm between austral late winter 1978 and austral late winter 1987 (405 cross-overs), - 59 ± 58 mm between the same seasons of 1978 and 1988 (416 cross-overs) and 182 ± 115 mm between the same seasons of 1978 and 1989 (135 cross-overs). The unbiased weighted average is 37 ±42 mm. This small value-with uncertainty range overlapping zero, is taken as an estimate of the vertical bias between the two satellites for the case of the GSFC orbit-adjusted altimetry.
Mean changes in the surface height throughout the same region of sea ice as in Figure 5, from cross-over analysis of unfiltered altimetry with orbits adjusted into a common ocean surface.
Finally, the same cross-over analysis is carried out at GSFC, over the sea ice within the same five “ocean rectangles”, using unfiltered altimetry referenced to orbits not adjusted into a common ocean surface. The result (not shown) is an apparent mean increase in the surface height of 283 ±46 mm between austral late winter 1978 and austral late winter 1987 (685 cross-overs), 223 ± 44 mm between the same seasons of 1978 and 1988 (646 cross-overs) and 327 ± 58 mm between the same seasons of 1978 and 1989 (549 cross-overs). The unbiased weighted mean is 269 ± 28 mm. This value is taken as an estimate of the inter-satellite orbit bias for the case of the GSFC non-orbit-adjusted altimetry.
Elevation Changes On Lambert Glacier, 1978 To 1987-89
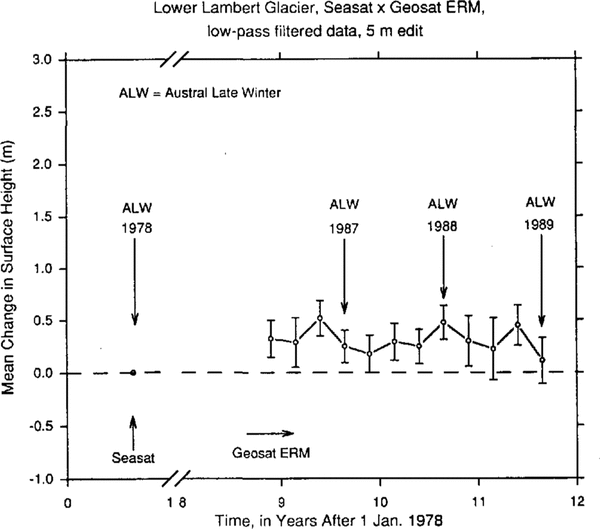
The mean elevation change on lower Lambert Glacier during the decade between austral late winter 1978 and the same season during 1987, 1988 and 1989 of Geosat ERM is determined as described above for estimation of orbit bias from the sea-ice cross-over differences. The Seasat orbits are “crossed” with the orbits from the sequential seasons of Geosat ERM, using the low-pass filtered data. Only cross-over differences with absolute value ≤ 5m are accepted. Figure 8 shows the results. For computation of the mean height change, only same season cross-over differences are considered in order to avoid spurious seasonal effects such as variations in penetration depth. The result is a mean increase in the surface height of 248 ± 154 mm between austral late winter 1978 and austral late winter 1987 (197 cross-overs), 477 ± 163 mm between the same seasons of 1978 and 1988 (145 cross-overs) and 109 ± 219 mm between the same seasons of 1978 and 1989 (65 cross-overs). Taking the unbiased weighted average of these values, with each height change weighted in proportion to the inverse square of its standard error, yields a mean increase in the surface height of 306 ± 100 mm between Seasat and Geosat ERM. No correction is applied for inter-satellite orbit bias. This corresponds to a mean rate of increase of the surface height of 31 ± 10mm year1 on lower Lambert Glacier during the decade from 1978 to 1987-89
Alean changes in the surface height on lower Lambert Glacier, from austral late winter 1978 (Seasat, dot on datum at left) to 1986-89 (Geosat ERM), computed using low-pass filtered altimetry. The error bars represent the propagated noise levels computed using the filtered Geosat ERM and Seasat data (cf. Fig. 4).

Mean changes in the surface height on lower Lambert Glacier, computed using unfiltered altimetry with Seasat and Geosat ERM orbits adjusted into a common ocean surface. The error bars represent the standard error of the mean for each seasonal change, for the accepted crossover differences (all ≤ 5 m).

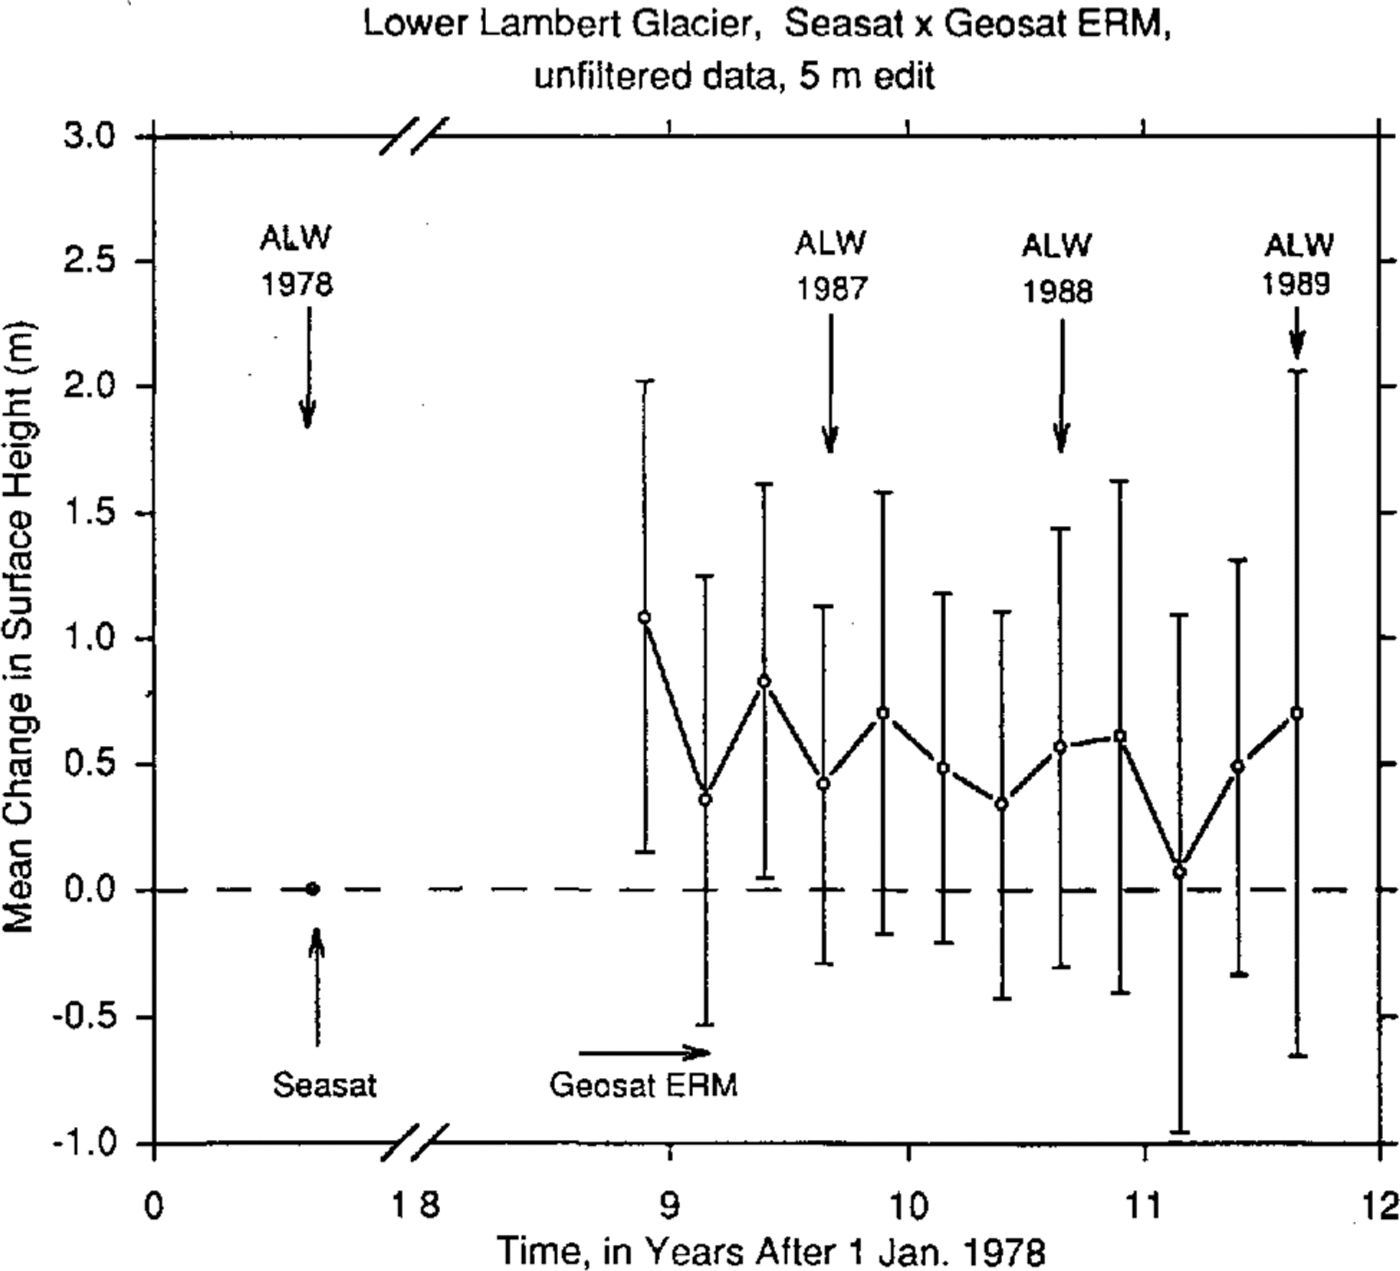
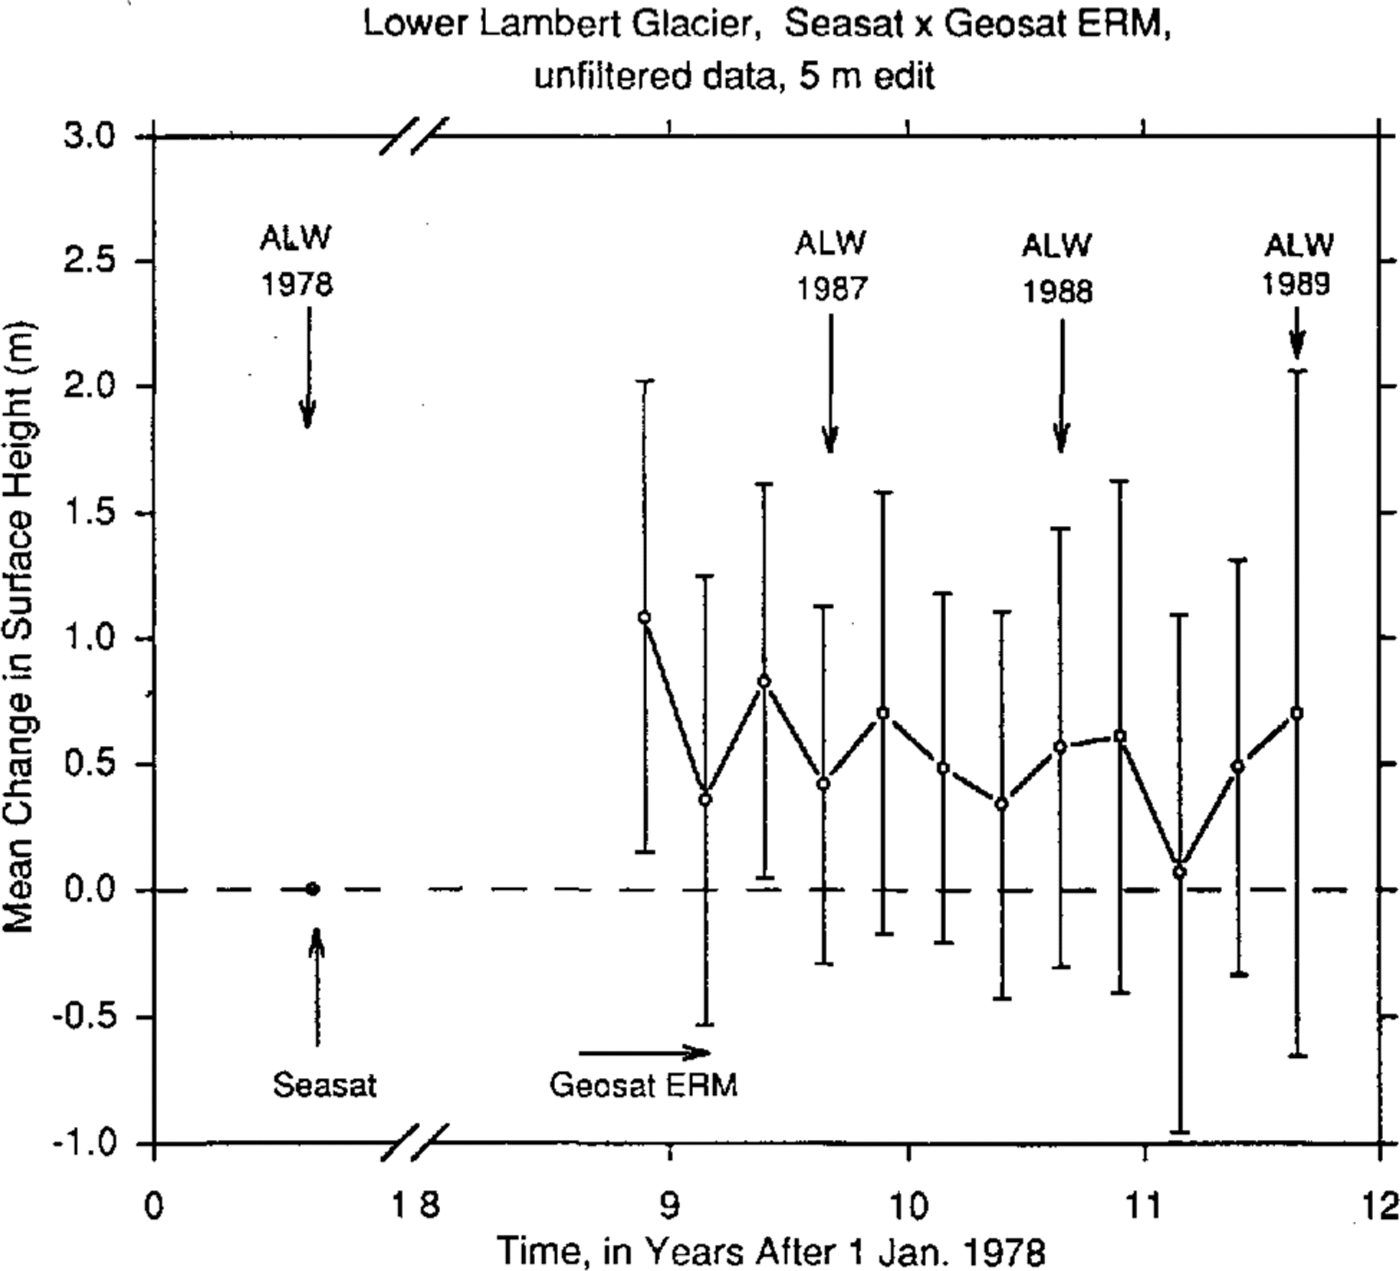
The same cross-over analysis is also carried out using the unfiltered data set. See Figure 9, which has larger error bars because of the higher noise levels in the data (Figure 2 versus Figure 4). A 5m edit level is again applied to the cross-over differences. The result is a mean increase in the surface height of 420 ± 710 mm between austral late winter 1978 and austral late winter 1987 (218 cross-overs), 568 ± 871 mm between the same seasons of 1978 and 1988 (152 cross-overs) and 701 ± 1357mm between the same seasons of 1978 and 1989 (71 crossovers). The unbiased weighted mean, calculated as described above, is 510±510mm. Subtracting the correction for inter-satellite bias estimated from the sea-ice cross-over differences (83 ± 131 mm) yields an adjusted mean increase in the surface height of 427 ± 527 mm, equivalent to a mean rate of increase of 43 ± 53 mm year -1. Although the error range is larger than the measured increase, this result is generally consistent with the rate of elevation increase computed using the low-pass filtered data.
An independent computation of mean elevation changes on lower Lambert Glacier is carried out at GSFC using altimetry with orbit bias minimized by adjusting the GEM T2 orbits from both Seasat and Geosat ER.M into the common ocean surface external to the ice sheet derived at GSFC from the Geosat ERM global ocean-data set. Since the Geosat ERM orbits “exactly repeat” the earlier Seasat orbits (to within a transverse accuracy of about 1km), the orbits from both satellites can be adjusted into this common ocean surface with similar accuracy. The along-track data used for this computation are not low-pass.-filtered.
The results are shown in Figure 10, which indicates a generally higher surface during Geosat ERM. The error bars are relatively small, because they represent the standard error of the mean for the cross-over differences accepted for the computation (all ≤ 5m), not the propagated data noise levels from Figures 2 and3 . In this treatment of the errors, the cross-over differences are assumed to be independent, i.e. not geographically correlated. The mean increase of the surface height between austral late winter 1978 (Seasat) and austral late winter 1987 (Geosat ERM) is 956± 108mm (from 226 cross-overs). The mean increase between the same seasons, 1978-88, is 747±120mm (from 159 crossovers). The mean increase between the same seasons, 1978-89, is 1453 ± 229 mm (from 33 cross-overs). Discarding the 1978-89 result, which is supported by an insufficient number of cross-over differences, and taking an unbiased weighted mean of the other two, with each change again weighted in proportion to the inverse square of its error, yields a mean increase in the surface height of 862 ± 80 mm. Subtracting the apparent mean increase in the surface height of the sea ice (computed using the orbit-adjusted data, i.e. 37±42mm) yields an adjusted mean increase in the surface height on lower Lambert Glacier of 825 ± 90 mm, equivalent to a mean rate of increase of 83 ± 9 mm year-1 during the decade from 1978 to 1987-89.
Finally, the cross-over analysis is also carried out at GSFC using unfiltered non-orbit adjusted altimetry (results not shown). The mean increase of the surface height between austral late winter 1978 and austral late winter 1987 is 951 ± 102mm (from 270 cross-overs), 1040 ± 118mm (tram 213 cross-overs) between the same seasons, 1978-88 and 1032±220 mm (from 144 cross-overs) between the same seasons, 1978-89. The weighted mean increase in the surface height is 994 ± 73 mm. Subtracting the weighted mean increase in the sea-ice surface computed using these data (269 ± 28 mm) yields an adjusted mean increase in the surface height of 725±78 mm, equivalent to a mean increase of 73±8 mm year-1 during the decade from 1978 to 1987- 89. This result is similar to that obtained using the GSFC orbit-adjusted altimetry.
Discussion
Increasing elevations on lower Lambert Glacier may be a consequence of positive net mass balance over the entire catchment area, as estimated by Reference AllisonAllison (1979) and Reference Allison, Young and McdhurstAllison and others (1985), sustained for sufficient time to force thickening of the Lambert Glacier system. This system was considered to be thickening at a mean rate of 210±290 mm year-1(ice equivalent) by Reference AllisonAllison (1979). (The large error range is a consequence of the relatively large uncertainty associated with the global mass-balance estimate.) An alternative possibility may be that Lambert Glacier is thickening down-glacier while thinning upstream, in a surge-like redistribution of mass analogous to that described for Ice Stream B, West Antarctica, by Reference Shabtaie, Bentley, Bindschadler and MacAyealShabtaie and others (1988). The Seasat and Geosat ERM altimetry do not extend far enough south to either confirm or rule out this possibility. More complete coverage of the Lambert Glacier catchment area will be provided by altimetry from ERS-l.
Summary
The results of this study show that the mean rate of increase of the surface height on lower Lambert Glacier, during the decade from 1978 to 1987-89 - within the area between 70.4˚ and 72.1˚ S - was 31± 10mm year 1, determined from orbit cross-over analysis of low-pass filtered altimetry, with Seasat Geosat ERM orbit bias estimated (and found to be negligible) from an analysis of cross-over differences over a region of sea ice seaward of the calving front of the Amery Ice Shelf. The mean rate of increase of the surface height is alternatively found to be 43 ± 53 mm year-1, using altimetry not low-pass filtered. The latter result is adjusted for an apparent inter-satellite orbit bias of 83 ± 131mm (Geosat surface higher), estimated from sea-ice cross-over differences using the unfiltered data set. These results were computed at the Geophysical Institute.
The cross-over analysis was carried out independently at NASA-Goddard Space Flight Center (GSFC), using altimetry with orbit bias minimized by adjusting the orbits into a common ocean surface. The mean rate of increase of the surface height throughout the same area on lower Lambert Glacier was found to be 83 ± 9 mm year-1 during the decade from 1978 to 1987-89. An alternative cross-over analysis, carried out at GSFC using altimetry with orbits not adjusted into a common ocean surface, yields a mean rate of increase of 73± 8 mm year 1. The latter result is adjusted for an apparent inter-satellite orbit bias of 269 ± 28 mm (Geosat surface higher), estimated from sea-ice cross-over differences using the non-orbit adjusted data set
All four cross-over analyses are consistent with the view that Lambert Glacier is thickening and provide a more tightly constrained estimate of the mean rate of increase of the surface height than previous estimates based on consideration of the global mass balance. These results are also generally consistent with Reference Herzfeld, Lingle and LeeHerzfeld and others (1994), who found, from geostatistical analysis of the unfiltered, non-orbit-adjusted altimetry, that the grounding line of Lambert Glacier advanced between Seasat and Geosat ERM. Taken together, the cross-over analyses indicate that the surface elevation on lower Lambert Glacier increased at a mean rate within the range 20-90 mm year-1 during the decade 1978 to 1987-89.
Acknowledgements
This work was supported by the NASA Polar Research Program, grants NAGW-2614 to C. Lingle and RTOP 5783219 to J. Zwally. We thank the University of Alaska-Fairbanks (UAF) Arctic Region Supercomputing Center for time on a Cray Y-MP M98, R. Guritz of the UAF Alaska SAR Facility for technical assistance with the IIAS computing system, and J. DiMarzio and A. Brenner of Hughes STX Corp., Lanham, Maryland, for valuable assistance with the data. This paper was improved as a result of discussions with, and a review by, I. Allison, and the comments of an anonymous reviewer