Introduction
Increased use of lightweight materials in automobiles can directly contribute to the goal of cutting greenhouse gas emissions by reducing fuel consumption. Magnesium alloys have received much attention in this context in the last decade because of their low densities and high specific strengths.Reference Kulekci1 However, joining of Mg alloys by conventional fusion welding methods is problematic, resulting in defects such as hot cracking and porosity from nonequilibrium solidification and segregation of impurity elements.Reference Sun, Lang, Sun and Li2,Reference Cao, Jahazi, Immarigeon and Wallace3 Many alternative joining methodologies such as adhesive bonding,Reference Liu4 brazing,Reference Watanabe, Komatu, Yanagisawa and Konuma5 riveting,Reference Li, Wei, Wang and Li6 and solid-state joiningReference Kohn, Antonsson, Munitz and Das7,Reference Patel, Bhole and Chen8 are being investigated for different applications.
Ultrasonic welding (UW)Reference Neppiras9 is a solid-state joining method that produces weld joints by localized high-frequency tangential vibration under moderate clamping pressure. In ultrasonic welding, a sonotrode is a tool that generates ultrasonic vibration and delivers energy to the workpiece. The welding cycle is typically short (<1 s) with no need for adhesive, brazing/transition material, or rivet. Interfacial friction, plastic deformation, and elastic hysteresis are the major heat sources,Reference Joshi10 but the temperature rise is generally not sufficient to melt the material. Instead, the high temperature and pressure at the interface induce rapid diffusion between the substrates to form the joint.Reference Hulst11,Reference Tsujino12
In the past, a broad range of studies related to the ultrasonic welding of magnesium alloys have been carried out, including investigating the bonding mechanism,Reference Hulst11–Reference Daniels13 characterizing the microstructure,Reference Huang, Chen, Lim, Hu, Cheng, Feng and Sun14 and optimizing the joint strength.Reference Patel, Bhole and Chen15 Recently, with the development and increasing use of various lightweight materials in automotive and other industry sectors, there have been many investigations on welding or joining of magnesium alloys with other lightweight material such as aluminumReference Panteli, Robson, Brough and Prangnell16 and titanium.Reference Ren, Zhao, Pan, Chang, Gang and Zhao17 This article focuses on the fundamental understanding of the joining mechanism during ultrasonic welding of magnesium alloys.
Previous investigationsReference Hulst11,Reference Daniels13 have suggested that there are two distinct stages during ultrasonic welding of metals. In the first stage, a reciprocating sliding motion occurs at the faying interface (contact surface of the joint between top and bottom Mg sheets). Surface oxides, asperities, and contamination can be dispersed and removed during this stage. Formation and destruction of localized microscale welds by means of a fretting mechanism (i.e., wear or damage at the contact surface asperities during relative surface motion) is the main phenomenon in this stage. In the second stage, the microscale welds grow and coalesce to prevent the materials on the two sides from sliding against each other, until the formation of a strong macroscale weld.
There have been several studies on the relative motion at the joint interface and heat generation during the UW process. Lee et al.Reference Lee, Kim, Hu, Cai and Abell18 and Sasaki et al.Reference Patel, Bhole and Chen15 used high-speed cameras to measure the displacement of the specimens. Growth of the bonded region associated with the vibrational motion of specimens was also discussed in Reference Reference Sasaki, Watanabe, Hosokawa and Yanagisawa19. Lu et al.Reference Lu, Song, Taber, Foster, Daehn and Zhang20 studied the relative motion between the sonotrode and the metal specimens using photonic Doppler velocimetry during ultrasonic welding of an aluminum alloy in a lap-joint configuration. Four distinct welding stages (slip, slip-stick transition, stick, and over-welding stages) were observed based on the relative maximum velocity of the top and bottom metal specimens. The first two stages were characterized by a large relative motion at the interface of the top and the bottom metal sheets. This interfacial motion diminished toward the end of slip-stick transition stage. The stick stage was the key stage for bond development. The peak bond strength was obtained when the sonotrode and the two foils vibrated with a similar velocity. Finally, over welding could take place if the welding energy were too high, which may break or damage the bond formed in the previous stick stage. De Leon and ShinReference de Leon and Shin21 measured the temperature distribution as a function of welding energy using an infrared (IR) camera. Despite these studies, the underlying fundamental mechanisms correlating the relative interfacial motions between the metal sheets at different stages of the joining process with heat generation and weld formation are still unclear.
In our recent research,Reference Chen, Lim, Huang and Feng22 in situ high-speed imaging and digital image correlation (DIC)Reference Sutton, Orteum and Schreier23 techniques were combined to directly observe the relative motion across the Mg–Mg and Mg–sonotrode interfaces during welding of two sheets of AZ31B magnesium alloy, one of the most widely used magnesium alloys in the automotive industry (refer to Table I for the chemical composition). Simultaneously, an IR camera was utilized to measure the temperature distribution across the interfaces. In addition, weld samples produced under varying welding time durations were nondestructively analyzed with the ultrasonic nondestructive evaluation (NDE) technique to study the evolution of weld formation. These investigations have revealed some of the fundamental bond formation mechanisms of the ultrasonic welding process for Mg alloys.
Chemical composition of AZ31B Mg alloy (in wt%).

Ultrasonic welding
Two sheets of AZ31B Mg were welded using a dual sonotrode ultrasonic welder, as illustrated in Figure 1. Details of the experimental setup can be found in References Reference Huang, Chen, Lim, Hu, Cheng, Feng and Sun14 and Reference Chen, Lim, Huang and Feng22. Weld samples were made using different welding times (0.01 s, 0.15 s, 0.20 s, 0.30 s 0.40 s, 0.50 s, and 0.55 s, respectively) at a constant power of 1000 W.
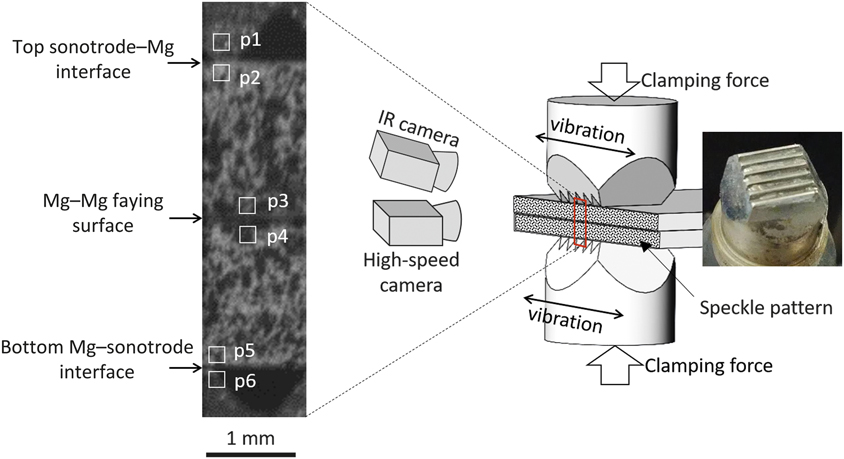
Schematic of experimental setup, (right) photograph of a sonotrode, and (left) a high-speed image frame showing part of the two AZ31B (∼3Al-1Zn in wt%) Mg sheets (coated with a speckle pattern) and the sonotrode teeth on the top and bottom of the Mg sheets. Six subsets of the image pixels within the small boxes in the image (p1–p6) were assigned to track the motion of sonotrodes and Mg sheets adjacent to three contact interfaces.Reference Chen, Lim, Huang and Feng22

In one of the welding experiments (0.55 s welding time), a monochrome high-speed camera was used to record the vibratory motion of both sonotrode tips and the Mg sheets at a speed of 50,000 frames/s. Meanwhile, an IR camera was used to measure the temperature evolution across the interfaces at a speed of 200 frames/s. A high-speed image frame is shown in Figure 1. Due to the limited field of view (1.2 mm in width and 4.6 mm in height), only the middle portion of the Mg–Mg stack was visualized, as illustrated by the red box in Figure 1.
Within the field of view, three contact interfaces could be visualized as shown in Figure 1. From top to bottom, they were (a) top sonotrode–Mg interface, (b) Mg–Mg faying surface, and (c) bottom Mg–sonotrode interface. By tracking the displacements of the six subsets of the image pixels (p1–p6 marked by the white boxes on the sonotrode teeth and the Mg surfaces adjacent to the contact interfaces in Figure 1) with an in-house DIC algorithm developed at Oak Ridge National Labratory,Reference Chen and Feng24 the tangential vibratory velocity of each material point across the contact interfaces was calculated. To better observe the vibratory motion, a high-contrast (in visible wavelength) speckle pattern capable of sustaining a temperature exposure up to 1100°C was coated on the edges of both Mg sheets. Another important reason for applying such a coating was its uniformly high emissivity (in the infrared range), which is typically required for accurate surface temperature measurement by the IR camera. As such, the influence of surface emissivity on temperature measurement by the IR camera was negligible. The calibration procedure of the surface emissivity can be found in Reference Reference Chen, Yu, Miller and Feng25.
To study the progressive weld formation, an ultrasonic NDE techniqueReference Thornton, Han and Shergold26 was utilized to analyze selected weld samples produced with varying welding time. The welded samples were submerged in a water tank and were scanned with a spherically focused ultrasonic transducer (20 Mhz, 25.4-mm focal distance and 6.35-mm diameter) in pulsed echo mode at a spatial resolution of 50 µm. The first echo was reflected from the top surface of the Mg stack (Mg–water interface). If a localized bond was formed at the Mg–Mg faying surface, the second echo would be reflected from the bottom surface of the Mg stack. If no localized bond was formed, the second echo would be reflected from the Mg–Mg contact surface. Considering the thickness of each Mg sheet (1.7 mm) and ultrasound’s travel speed in Mg (6310 m/s27), the time delay between the second and the first echo would be approximately 0.54 µs and 1.08 µs for unbonded and bonded cases, respectively.
In the ultrasonic NDE experiment, a data analysis window (0.4 µs behind the first echo and 0.2 µs wide) was set up on the ultrasonic echo signal to cover the range where the reflection from the Mg–Mg interface was expected. Within the gate, the intensity of the ultrasonic signal was recorded. A strong signal suggested a discontinuity at the Mg–Mg interface and hence no or only a weak localized bond was present. In contrast, a weak signal suggested a good localized bond. It was noted that the surface roughness (imprinted during the welding process), particularly on the side facing the transducer, could disturb the ultrasound signal. Thus, before the ultrasonic NDE analysis, this side of the Mg surface was carefully ground flat to remove the sonotrode imprints.
Welding of AZ31B magnesium alloys
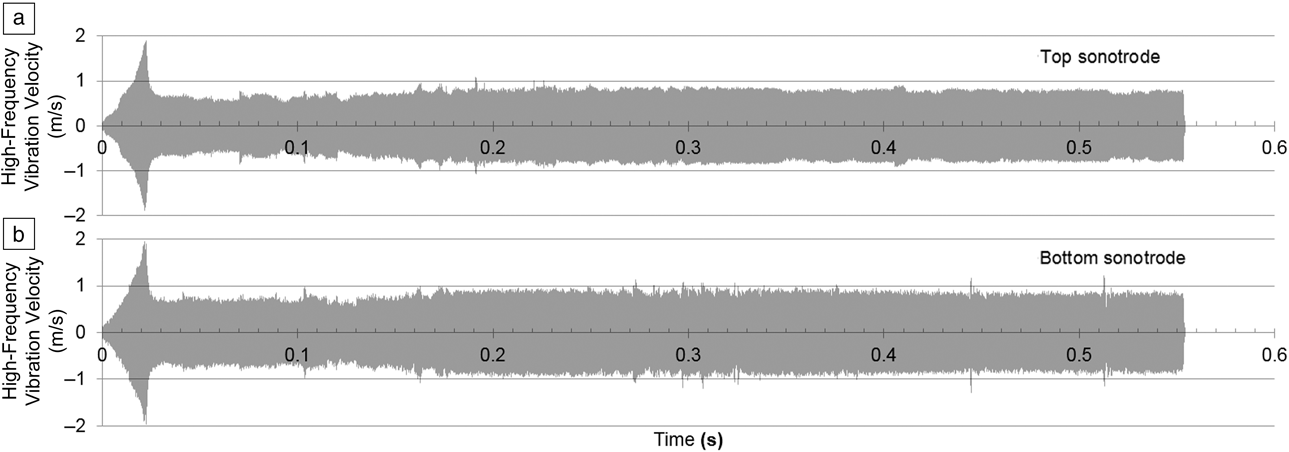
The high-frequency vibration speed of both sonotrodes measured by high-speed imaging and DIC techniques is plotted in Figure 2.Reference Chen, Lim, Huang and Feng22 The velocity amplitude of both sonotrodes (top sonotrode in Figure 2a and bottom sonotrode in Figure 2b) ramped up to 1.9 m/s within 22 ms and then quickly decayed and maintained a constant amplitude at approximately 0.6∼0.8 m/s throughout the rest of the welding process. The vibration velocity curves in Figure 2 suggest a relatively stable amplitude of vibrational excitation delivered from the sonotrodes to the Mg sheets through most of the welding process.
High-frequency vibration velocity of the (a) top and (b) bottom sonotrodes during the ultrasonic welding of the AZ31B Mg alloy (∼3Al-1Zn wt%) samples. The velocity amplitudes of top and bottom sonotrodes ramped up to 1.9 m/s within 22 ms and then decayed and maintained constant amplitude at 0.6∼0.8 m/s throughout the rest of the welding process. From the vibration velocity curves, a relatively stable amplitude of vibrational excitation is delivered from the sonotrodes to the Mg sheets through most of the welding process.Reference Chen, Lim, Huang and Feng22

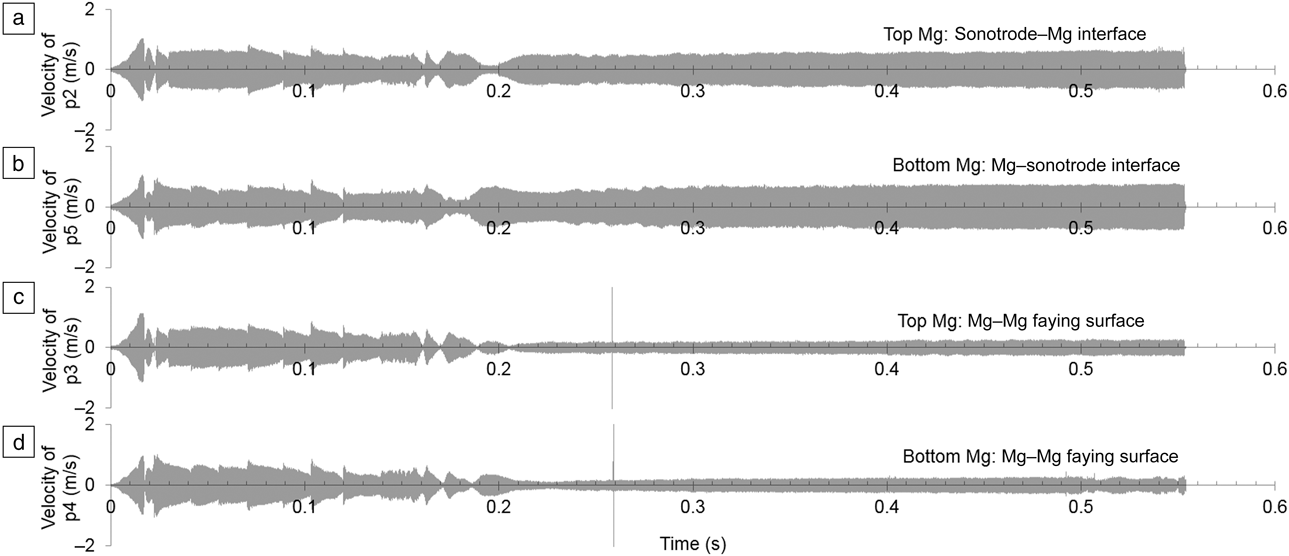
The vibration velocity of both Mg sheets at different locations adjacent to the Mg–Mg faying surface and Mg–sonotrode contact surfaces (p2–p5 as illustrated in Figure 1) was also calculated. These curves are plotted in Figure 3.Reference Chen, Lim, Huang and Feng22 Figure 3a, c plots the curves measured at two locations on the top Mg sheet. One is adjacent to the top sonotrode–Mg interface (p2) and the other is adjacent to the Mg–Mg faying interface (p3). Similarly, Figure 3b, d display the curves measured at two locations on the bottom Mg sheet. One is adjacent to the Mg–Mg faying interface (p4) and the other is adjacent to the bottom Mg–sonotrode interface (p5). Within the first 18 ms, all velocity curves ramped to a peak value of 1 m/s. Instead of maintaining a constant amplitude throughout the rest of the welding process as observed on the sonotrodes, the velocity amplitudes of the Mg sheets fluctuated between 0.018 s and 0.21s, followed by a relatively constant velocity after 0.21 s. From 0.21 s to 0.55 s, the velocity amplitudes on both Mg sheets adjacent to the top and the bottom Mg–sonotrode interfaces (locations p2 and p5, refer to Figure 1) were in the range of 0.5 m/s to 0.6 m/s. The velocity amplitudes on both Mg sheets adjacent to the Mg–Mg faying surface (locations p3 and p4, refer to Figure 1) were within 0.2–0.3 m/s. As can be seen, these velocity curves measured on the Mg sheets, shown in Figure 3a–d, were not as stable as those measured on the sonotrodes, shown in Figure 2a–b.
High-frequency vibratory velocity of the two AZ31B Mg sheets at different locations adjacent to the Mg–Mg faying surface and Mg–sonotrode contact surfaces (p2–p5, as illustrated in Figure 1). (a) Top Mg surface adjacent to the top sonotrode, (b) bottom Mg surface adjacent to the bottom sonotrode, (c) top Mg surface adjacent to the Mg–Mg joint interface, and (d) bottom Mg surface adjacent to the Mg–Mg joint interface. The spikes occurred at 0.26 s in (c) and (d) was the measurement noise caused by the flying metal chips scribed off the Mg surface during welding. All velocity curves ramped up to approximately 1 m/s within 18 ms, followed by relatively fluctuating amplitudes until approximately 0.2 s. After 0.2 s, all velocity curves became stable with large amplitudes (0.5–0.6 m/s) adjacent to the Mg–sonotrode interfaces (p2 and p5) and small amplitudes (0.2–0.3 m/s) adjacent to the Mg–Mg faying surfaces (p3 and p4). This was a result of the progressive joint formation at the Mg–Mg faying interface and the increased sonotrode indentation at the sonotrode–Mg interfaces.Reference Chen, Lim, Huang and Feng22

The difference in velocity amplitudes from the faying surface to the Mg–sonotrode interfaces was due to the shear motion delivered through the sonotrode. The closer the position to the sonotrode, the relatively higher was the amplitude of vibration velocity measured. The spikes that occurred at approximately 0.26 s on the velocity curves of both Mg sheets adjacent to the faying surface (locations p3 and p4, refer to Figure 1) were measurement noise caused by the tiny flying metal chips scribed off the Mg surface during the high-frequency vibration.
Interfacial motion during ultrasonic welding
To better understand the interfacial motion, the relative velocity across each interface was further calculated and studied.Reference Chen, Lim, Huang and Feng22 For instance, the relative velocity across the top sonotrode–Mg interface was calculated by subtracting the velocity curves between the top sonotrode (measured at p1, Figure 1) and the adjacent location on the top Mg sheet (measured at p2, Figure 1). The relative velocity curves across the Mg–Mg faying surface and the bottom Mg–sonotrode interface were derived in the same manner.
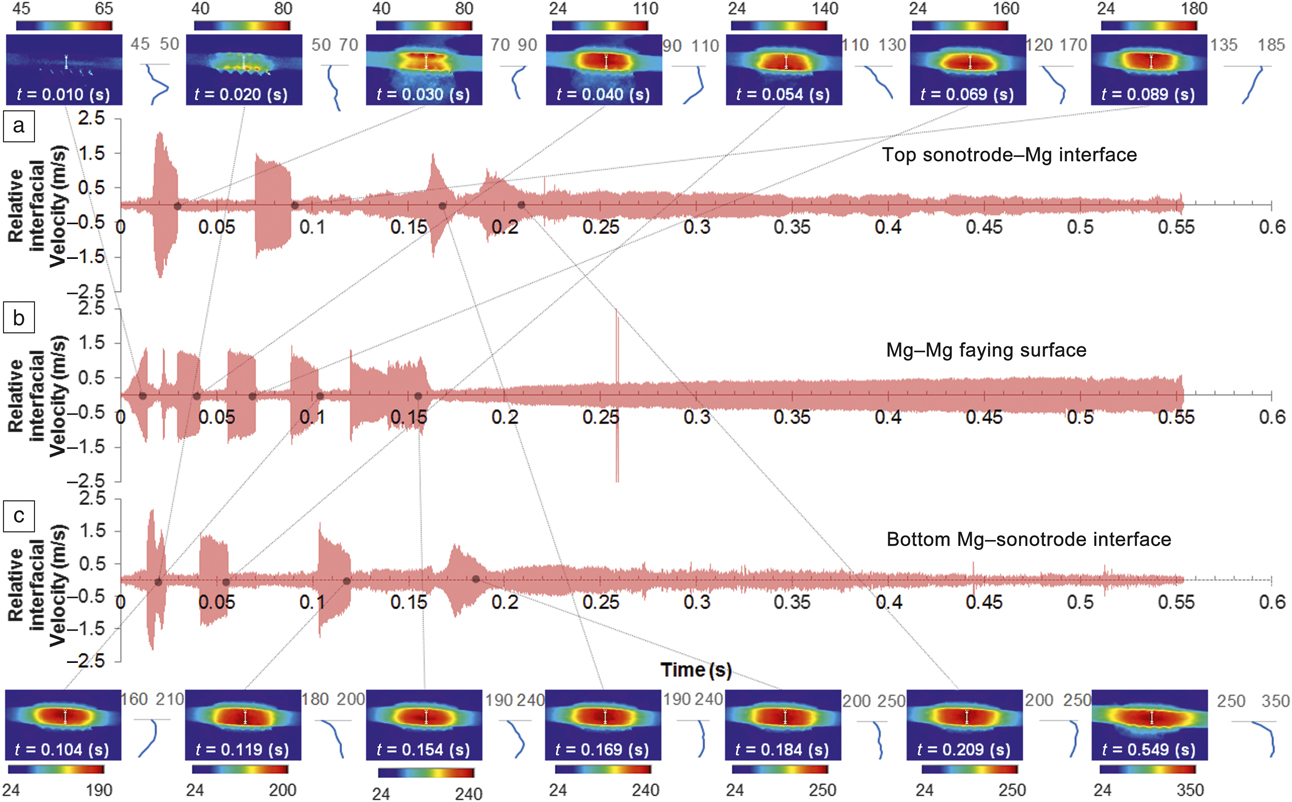
All relative velocity curves across those three interfaces are plotted in Figure 4.Reference Chen, Lim, Huang and Feng22 Figure 4a shows the measurement at the top sonotrode–Mg interface. Figure 4b shows the measurement at the Mg–Mg joint interface, and Figure 4c shows the measurement at the bottom Mg–sonotrode interface. By examining the high-speed image frames, the high relative velocity (above 0.5 m/s) regions in the curves appear to correspond to the moments in time when interfacial sliding was observed. In contrast, when the materials across the interface stuck or bonded together, the relative velocity amplitude was relatively low. It is worth noting that the relative velocity at the interface should be zero when two materials are stuck or joined, but the measured amplitude was nonzero. This is because the measurement was derived by tracking the motion of two subsets adjacent to each interface (refer to Figure 1), and the center of these subsets were about 0.2 mm apart from the interface. Thus, the relative velocity between the two subsets across each interface would not be zero even though there was no sliding at the interface during the shear motion of the two sonotrodes. The spike in Figure 4b was also caused by flying metal chips.
Relative velocity curves across each interface showing sliding (high amplitude) and sticking (low amplitude) motion, as well as the temperature distribution (the inserted color plots surrounding the velocity curves measured at different time frames, t) when sticking relative motion was observed. (a) Sonotrode–Mg interface, (b) Mg–Mg joint interface, and (c) Mg–sonotrode interface. The spikes occurring at 0.26 s in (b) were measurement noise caused by flying metal chips. The blue curves between the inserted infrared images are the line plots of temperature distribution along the cross-sectional centerline. The numbers on the color bars and the horizontal axis of the line plots represent the temperature distribution in Celsius. Interfacial heat generation was observed along with interfacial sliding where the large amplitudes of the relative interfacial velocity were measured. The lack of Mg–Mg interfacial sliding after 0.16 s suggests the formation of a macroscale weld joint.Reference Chen, Lim, Huang and Feng22

Further examination of the inserted IR images surrounding the velocity curves in Figure 4 revealed that the transient interfacial heat generation shifted from interface to interface, and it could be associated with the reciprocating interfacial sliding (relatively high amplitude of interfacial velocity) occurring at the corresponding interfaces. The color distribution represents the temperature distribution, and the numbers on the color bars is in unit of Celsius. As demonstrated in Figure 4, at t = 0.010 s, the first sliding occurred at the Mg–Mg faying surface. Correspondingly, the highest temperature rise was also observed at the same interface in the IR image. The line plot (the blue curves between the IR images in Figure 4) along the cross-sectional centerline shows that the peak temperature at the Mg–Mg faying surface was 50°C, and temperature near the two sonotrodes was approximately 46°C. At t = 0.020 s, the bottom Mg–sonotrode interface was sliding. The location of maximum temperature rise shifted to the bottom of the Mg sheet stack (from 46°C to 68°C). Between 0.028 s and 0.030 s, sliding was observed at the top Mg–sonotrode interface, and the temperature distribution measured at 0.030 s confirmed that the top Mg–sonotrode interface was experiencing faster heat generation. The peak temperature rose from 55°C to 90°C. Combining the measurements of the interfacial velocity and the temperature, one can conclude that the interfacial heat generation is closely associated with the relative motion of the interfaces.
Thus, the sliding phenomenon as well as the frictional heat generation occurred alternatively among the three contact interfaces from t = 0 s to t = 0.21 s. Such an alternation might be related to the following factors. (1) Dynamic change in friction coefficient at each interface-sliding occurred preferentially at the interface with the lowest friction. (2) The formation and destruction of localized microscale bonds at the Mg–Mg faying surface due to the fretting mechanism.Reference Hulst11,Reference Daniels13 After 0.16 s, no sliding occurred at the Mg–Mg interface, suggesting that a macroscale weld joint started to form. Further analysis of weld formation will be discussed subsequently. Sliding between Mg sheets and both sonotrodes still occurred after 0.16 s, but eventually after 0.21 s, no sliding was observed at any of the interfaces. This could be associated with the increasing surface indentation from the sonotrode teeth into the Mg surface as a result of the joining process. The elevated temperate softened Mg, leading to a deep indentation and interlocking between the sonotrode teeth (refer to Figure 1) and the deformed Mg surface, which prevented both Mg–sonotrode interfaces from sliding.
Progressive formation of weld joint
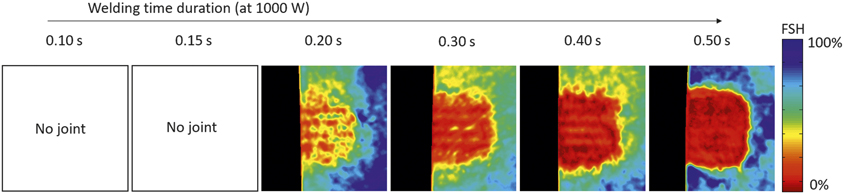
Weld samples produced with a shorter welding time duration (within 0.10 s and 0.50 s) were further studied to understand the progressive formation of the weld joint, as shown in Figure 5.Reference Chen, Lim, Huang and Feng22 Since no joints were formed in the first two samples that were welded with 0.10 s and 0.15 s time duration, no ultrasonic NDE measurements were performed on these two samples. Other welded samples were all nondestructively analyzed using the ultrasonic NDE technique with a 14 mm × 14 mm scan area. The results are also shown in Figure 5. The black area on the left side of the ultrasonic NDE images represents the off-sample scan region. The color map represents the reflection intensity measured within the gate as discussed previously, in which the reflection from the Mg–Mg interface was expected.
Ultrasonic nondestructive analysis of the weld samples (14 mm × 14 mm image area) as a function of welding time. Note: FSH, full screen height. Since joints did not form in the samples welded with 0.10 s and 0.15 s time durations, ultrasonic nondestructive evaluation (NDE) analysis was not performed on these two samples. The NDE analyses on other samples suggest progressive joint formation with increasing welding time from 0.2 s to 0.5 s.Reference Chen, Lim, Huang and Feng22

The unit of the reflection intensity is described as a percentage of full screen height (FSH).* High intensity of the reflection signal indicates a discontinuity or weak localized bond, and low intensity suggests a good localized bond. As can be seen in Figure 5, the progressive bond formation as a function of welding time was clearly visualized. Referring to the relative motion at the Mg–Mg faying surface in Figure 4, reciprocating sliding was observed from the beginning to 0.17 s. As suggested by previous research,Reference Hulst11,Reference Daniels13 the formation and destruction of localized microscale bonds were competing processes. Thus, no macroscale bond was formed in first two weld coupons (0.10 s and 0.15 s welding duration). After 0.17 s on the relative velocity curves (refer to Figure 4), no more sliding at the Mg–Mg interface was observed, suggesting a macroscale bond strong enough to survive under high-frequency vibration was formed.
Consistently, the ultrasonic NDE image of the weld samples with a 0.20 s welding time reveals isolated bonded spots (red color in Figure 5). Most of the bonded spots were located underneath the sonotrode teeth due to the nonuniform pressure distribution delivered through the teeth. By further increasing the welding time to 0.3 s, 0.4 s, and 0.5 s, a progressive increase in bonded area can be clearly visualized. At 0.5 s welding time, most of the area was bonded. These NDE images thus provide a clear view of the welding progression.
Summary
Ultrasonic spot welding experiments on Mg alloy sheets revealed two distinct stages during welding. In the first stage, reciprocating sliding occurred at the Mg–Mg joint interface, resulting in localized rapid temperature rise due to localized frictional heating. Localized microscale bonded spots between Mg sheets started to form in this stage, but the overall strength was low, and they could be easily broken by the subsequent high-frequency vibration. Formation and destruction of these microscale bonds by means of a fretting mechanism was the main phenomenon in this stage.
In the second stage, no relative motion was observed at the Mg–Mg joint interface. Localized bonded spots continued growing and coalesced into a macroscale joint that was strong enough to prevent the Mg–Mg faying surface from sliding or breakage. With increasing welding time, the bonded area of the Mg–Mg joint increased. The region underneath the sonotrode teeth where localized clamping pressure was high had a tendency to form a better localized bond.
Future research should focus on the investigation of the microstructure and mechanical properties of the ultrasonically welded Mg joints over various welding stages, as well as the influence of the welding conditions (i.e., ultrasonic power input, welding time, clamping pressure, and sonotrode teeth dimension). This can lead to a more comprehensive understanding of the bond formation and joint properties as a function of welding conditions.
Acknowledgments
The authors would like to thank J. Pryor for the assistance on the ultrasonic nondestructive analysis. This research was sponsored by the US Department of Energy (DOE), Office of Vehicle Technology, under a prime contract with Oak Ridge National Laboratory (ORNL). ORNL is managed by UT-Battelle, LLC for the DOE under Contract No. DE-AC05–000R22725.

Jian Chen is a R&D staff member in the Materials Joining Group at Oak Ridge National Laboratory. He received his doctoral degree in industrial engineering from The Ohio State University. He has significant experimental and analytical experience in developing advanced materials joining technologies and associated control and monitoring technologies. His expertise includes advanced sensing techniques to monitor and control welding processes and high-performance welding simulation techniques. Chen can be reached by email at chenj2@ornl.gov.

Yong-Chae Lim is a research staff member in the Materials Joining Group at Oak Ridge National Laboratory. He received his doctoral degree in industrial engineering from The Ohio State University. His current research focuses on multiscale manufacturing process development and characterization, and includes novel solid-state joining process development for automotive and hydrogen storage applications. He is a member of the American Welding Society and The Minerals, Metals & Materials Society. He has authored/co-authored more than 20 peer-reviewed articles and 50 presentations. Lim can be reached by email at limy@ornl.gov.

Hui Huang is a postdoctoral research associate at Oak Ridge National Laboratory. He earned his PhD degree from Osaka University, Japan, in 2016. He has more than 10 years of experience in high-performance finite element method development and commercial code (ABAQUS) applications for solving welding related thermomechanical problems. He has published 17 peer-reviewed papers and has given more than 25 talks on simulation and measurement of welding stress and distortion. His current research interests include ultrasonic welding simulation and additive manufacturing modeling. Huang can be reached by email at huangh@ornl.gov.

Zhili Feng is the group leader of the Materials Joining Group and a Distinguished R&D staff member at Oak Ridge National Laboratory. He received his PhD degree from The Ohio State University, and BS and MS degrees from Tsinghua University, China. He is a Fellow of the American Welding Society and the International Institute of Welding. His current research includes various aspects of thermal-mechanical-metallurgical behavior of materials in processing. He has published more than 200 peer-reviewed papers. Feng can be reached by email at fengz@ornl.gov.

Xin Sun is the director of the Energy and Transportation Science Division at Oak Ridge National Laboratory (ORNL). She received her PhD degree from the University of Michigan–Ann Arbor. Prior to joining ORNL, she was a laboratory fellow at Pacific Northwest National Laboratory. She is a Fellow of The American Society of Mechanical Engineers, and is well recognized for integrated computational materials engineering for lightweight energy materials. She has authored/co-authored more than 190 peer-reviewed journal articles and 10 books/book chapters. Sun can be reached by email at sunx1@ornl.gov.