





%20--%3e%3c!DOCTYPE%20svg%20PUBLIC%20'-//W3C//DTD%20SVG%201.0//EN'%20'http://www.w3.org/TR/2001/REC-SVG-20010904/DTD/svg10.dtd'%3e%3csvg%20version='1.0'%20id='Layer_1'%20xmlns='http://www.w3.org/2000/svg'%20xmlns:xlink='http://www.w3.org/1999/xlink'%20x='0px'%20y='0px'%20width='64px'%20height='64px'%20viewBox='5.5%20-3.5%2064%2064'%20enable-background='new%205.5%20-3.5%2064%2064'%20xml:space='preserve'%3e%3cg%3e%3ccircle%20fill='%23FFFFFF'%20fill-opacity='0'%20cx='37.785'%20cy='28.501'%20r='28.836'/%3e%3cpath%20fill='%23595959'%20d='M37.441-3.5c8.951,0,16.572,3.125,22.857,9.372c3.008,3.009,5.295,6.448,6.857,10.314%20c1.561,3.867,2.344,7.971,2.344,12.314c0,4.381-0.773,8.486-2.314,12.313c-1.543,3.828-3.82,7.21-6.828,10.143%20c-3.123,3.085-6.666,5.448-10.629,7.086c-3.961,1.638-8.057,2.457-12.285,2.457s-8.276-0.808-12.143-2.429%20c-3.866-1.618-7.333-3.961-10.4-7.027c-3.067-3.066-5.4-6.524-7-10.372S5.5,32.767,5.5,28.5c0-4.229,0.809-8.295,2.428-12.2%20c1.619-3.905,3.972-7.4,7.057-10.486C21.08-0.394,28.565-3.5,37.441-3.5z%20M37.557,2.272c-7.314,0-13.467,2.553-18.458,7.657%20c-2.515,2.553-4.448,5.419-5.8,8.6c-1.354,3.181-2.029,6.505-2.029,9.972c0,3.429,0.675,6.734,2.029,9.913%20c1.353,3.183,3.285,6.021,5.8,8.516c2.514,2.496,5.351,4.399,8.515,5.715c3.161,1.314,6.476,1.971,9.943,1.971%20c3.428,0,6.75-0.665,9.973-1.999c3.219-1.335,6.121-3.257,8.713-5.771c4.99-4.876,7.484-10.99,7.484-18.344%20c0-3.543-0.648-6.895-1.943-10.057c-1.293-3.162-3.18-5.98-5.654-8.458C50.984,4.844,44.795,2.272,37.557,2.272z%20M37.156,23.187%20l-4.287,2.229c-0.458-0.951-1.019-1.619-1.685-2c-0.667-0.38-1.286-0.571-1.858-0.571c-2.856,0-4.286,1.885-4.286,5.657%20c0,1.714,0.362,3.084,1.085,4.113c0.724,1.029,1.791,1.544,3.201,1.544c1.867,0,3.181-0.915,3.944-2.743l3.942,2%20c-0.838,1.563-2,2.791-3.486,3.686c-1.484,0.896-3.123,1.343-4.914,1.343c-2.857,0-5.163-0.875-6.915-2.629%20c-1.752-1.752-2.628-4.19-2.628-7.313c0-3.048,0.886-5.466,2.657-7.257c1.771-1.79,4.009-2.686,6.715-2.686%20C32.604,18.558,35.441,20.101,37.156,23.187z%20M55.613,23.187l-4.229,2.229c-0.457-0.951-1.02-1.619-1.686-2%20c-0.668-0.38-1.307-0.571-1.914-0.571c-2.857,0-4.287,1.885-4.287,5.657c0,1.714,0.363,3.084,1.086,4.113%20c0.723,1.029,1.789,1.544,3.201,1.544c1.865,0,3.18-0.915,3.941-2.743l4,2c-0.875,1.563-2.057,2.791-3.541,3.686%20c-1.486,0.896-3.105,1.343-4.857,1.343c-2.896,0-5.209-0.875-6.941-2.629c-1.736-1.752-2.602-4.19-2.602-7.313%20c0-3.048,0.885-5.466,2.658-7.257c1.77-1.79,4.008-2.686,6.713-2.686C51.117,18.558,53.938,20.101,55.613,23.187z'/%3e%3c/g%3e%3c/svg%3e)
%20--%3e%3c!DOCTYPE%20svg%20PUBLIC%20'-//W3C//DTD%20SVG%201.0//EN'%20'http://www.w3.org/TR/2001/REC-SVG-20010904/DTD/svg10.dtd'%3e%3csvg%20version='1.0'%20id='Layer_1'%20xmlns='http://www.w3.org/2000/svg'%20xmlns:xlink='http://www.w3.org/1999/xlink'%20x='0px'%20y='0px'%20width='64px'%20height='64px'%20viewBox='5.5%20-3.5%2064%2064'%20enable-background='new%205.5%20-3.5%2064%2064'%20xml:space='preserve'%3e%3cg%3e%3ccircle%20fill='%23FFFFFF'%20fill-opacity='0'%20cx='37.637'%20cy='28.806'%20r='28.276'/%3e%3cg%3e%3cpath%20fill='%23595959'%20d='M37.443-3.5c8.988,0,16.57,3.085,22.742,9.257C66.393,11.967,69.5,19.548,69.5,28.5c0,8.991-3.049,16.476-9.145,22.456%20C53.879,57.319,46.242,60.5,37.443,60.5c-8.649,0-16.153-3.144-22.514-9.43C8.644,44.784,5.5,37.262,5.5,28.5%20c0-8.761,3.144-16.342,9.429-22.742C21.101-0.415,28.604-3.5,37.443-3.5z%20M37.557,2.272c-7.276,0-13.428,2.553-18.457,7.657%20c-5.22,5.334-7.829,11.525-7.829,18.572c0,7.086,2.59,13.22,7.77,18.398c5.181,5.182,11.352,7.771,18.514,7.771%20c7.123,0,13.334-2.607,18.629-7.828c5.029-4.838,7.543-10.952,7.543-18.343c0-7.276-2.553-13.465-7.656-18.571%20C50.967,4.824,44.795,2.272,37.557,2.272z%20M46.129,20.557v13.085h-3.656v15.542h-9.944V33.643h-3.656V20.557%20c0-0.572,0.2-1.057,0.599-1.457c0.401-0.399,0.887-0.6,1.457-0.6h13.144c0.533,0,1.01,0.2,1.428,0.6%20C45.918,19.5,46.129,19.986,46.129,20.557z%20M33.042,12.329c0-3.008,1.485-4.514,4.458-4.514s4.457,1.504,4.457,4.514%20c0,2.971-1.486,4.457-4.457,4.457S33.042,15.3,33.042,12.329z'/%3e%3c/g%3e%3c/g%3e%3c/svg%3e)
1. Introduction
Turbulent rotating convection (Ecke & Shishkina Reference Ecke and Shishkina2023) is a fundamental mechanism that drives the heat and momentum transport in planets (Busse & Carrigan Reference Busse and Carrigan1976; Ahlers, Grossmann & Lohse Reference Ahlers, Grossmann and Lohse2009; Wicht & Sanchez Reference Wicht and Sanchez2019), as well as being the energy source for planetary and stellar magnetic fields (Jones Reference Jones2011; Aurnou et al. Reference Aurnou, Calkins, Cheng, Julien, King, Nieves, Soderlund and Stellmach2015; Guervilly, Cardin & Schaeffer Reference Guervilly, Cardin and Schaeffer2019). The parameters of the astrophysical and geophysical flows are too extreme to be realized nowadays in lab experiments and direct numerical simulations (DNS). For example, in the Earth's core, the Ekman number  $Ek\equiv \nu /(2\varOmega L^2)$, which is the inverse of the dimensionless rotating rate, can be as low as
 $10^{-15}$, and the Reynolds number
 $Re\equiv uL/\nu$, which is the dimensionless flow velocity, can be as high as
 $10^9$ (Aurnou et al. Reference Aurnou, Calkins, Cheng, Julien, King, Nieves, Soderlund and Stellmach2015; Plumley & Julien Reference Plumley and Julien2019). Here,
 $\nu$ is the kinematic viscosity,
 $\varOmega$ is the rotating angular velocity,
 $u$ is the characteristic velocity, and
 $L$ is the domain length scale. To estimate the heat and momentum transport in a particular geophysical or astrophysical system, one needs first, the scaling relations that hold in the corresponding flow regime, and second, measurements or simulations for a certain range of control parameters, which are not as extreme as in the considered geophysical or astrophysical system, but which anyway belong to the same scaling regime as the considered system. As soon as both objectives are achieved, the results from the labs and supercomputers can be upscaled to the geophysical and astrophysical conditions.
Rotating Rayleigh–Bénard convection (RRBC) (Kunnen Reference Kunnen2021; Ecke & Shishkina Reference Ecke and Shishkina2023) is the most studied set-up of rotating thermal convection. Here, a container of height  $L$ and temperature difference
 $\varDelta$ between its bottom and top is rotated with angular velocity
 $\varOmega$ about its centrally located vertical axis. The main control parameters of the system are
 $Ek$, the Rayleigh number
 $Ra\equiv \alpha _T g L^3 \varDelta /(\kappa \nu )$, which is the dimensionless temperature difference across the domain, and the Prandtl number
 $Pr\equiv \nu /\kappa$, a material property. Here,
 $\alpha _T$ is the thermal expansion coefficient,
 $g$ is the gravitational acceleration, and
 $\kappa$ is the thermal diffusivity. The main dimensionless response characteristics are
 $Re$ and the Nusselt number
 $Nu$, which is the total vertical heat flux normalized by the purely conductive counterpart.
The scaling relations for the heat ( $Nu$) and momentum (
 $Re$) transfer are usually sought as functions of
 $Ek$,
 $Ra$ and
 $Pr$, expressed in forms
 $\sim Ra^{\alpha }\,Ek^{\beta }\,Pr^{\gamma }$. For RRBC, under the assumption that the heat flux is independent of
 $\nu$ and
 $\kappa$, a diffusion-free heat transfer scaling law
 $Nu\sim Ra^{3/2}\,Ek^{2}\,Pr^{-1/2}$ can be derived (Stevenson Reference Stevenson1979; Gillet & Jones Reference Gillet and Jones2006; Julien et al. Reference Julien, Knobloch, Rubio and Vasil2012a,Reference Julien, Rubio, Grooms and Knoblochb; Gastine, Wicht & Aubert Reference Gastine, Wicht and Aubert2016; Plumley et al. Reference Plumley, Julien, Marti and Stellmach2017; Plumley & Julien Reference Plumley and Julien2019; Aurnou, Horn & Julien Reference Aurnou, Horn and Julien2020; Bouillaut et al. Reference Bouillaut, Miquel, Julien, Aumaître and Gallet2021). This relation is associated with the geostrophic turbulence regime, where not only the heat flux but also the whole system is independent of
 $\nu$ and
 $\kappa$ (Schmitz & Tilgner Reference Schmitz and Tilgner2009; Julien et al. Reference Julien, Knobloch, Rubio and Vasil2012a; Plumley et al. Reference Plumley, Julien, Marti and Stellmach2017; Guervilly et al. Reference Guervilly, Cardin and Schaeffer2019; Bouillaut et al. Reference Bouillaut, Miquel, Julien, Aumaître and Gallet2021; Wang et al. Reference Wang, Santelli, Lohse, Verzicco and Stevens2021), following the Kolmogorov energy cascade picture (Ahlers et al. Reference Ahlers, Grossmann and Lohse2009). Worldwide efforts over the past decade have been devoted to achieving and verifying this diffusion-free
 $Nu$ scaling by designing increasingly taller rotating convection cells (Cheng et al. Reference Cheng, Aurnou, Julien and Kunnen2018; Ecke & Shishkina Reference Ecke and Shishkina2023). This regime was also studied in a recent experiment where convection is driven radiatively, with reduced models, and in DNS with free-slip boundary conditions (BCs) (Julien et al. Reference Julien, Knobloch, Rubio and Vasil2012a; Stellmach et al. Reference Stellmach, Lischper, Julien, Vasil, Cheng, Ribeiro, King and Aurnou2014; Plumley et al. Reference Plumley, Julien, Marti and Stellmach2017; Bouillaut et al. Reference Bouillaut, Miquel, Julien, Aumaître and Gallet2021). There, to make the resolution and rotation rate manageable, the typical
 $Ek$ value is of the order of
 $10^{-7}$ at least, and
 $Ra$ is of the order of
 $10^{12}$ at most. However, it is yet to be seen whether this scaling can be achieved in experiments and DNS with the traditional lab settings (no-slip BCs, the only option for most of the experiments).
In the limit of rapid rotation ( $Ek\rightarrow 0$), strong thermal forcing (
 $Ra\rightarrow \infty$) and infinite
 $Pr$, from the asymptotically reduced equations for
 $Ra\,Ek^{8/5}=O(1)$, an upper bound
 $Nu\leq 20.56 (Ra/Ra_c)^3\propto \widetilde {Ra}^3$ was derived in Grooms & Whitehead (Reference Grooms and Whitehead2015), where
 $Ra_c$ is the critical
 $Ra$ for the onset of RRBC, and
 $\widetilde {Ra}\equiv Ra\,Ek^{4/3}$. Here,
 $Nu$ increases much faster than in the regime of geostrophic turbulence. One comes to a similar scaling relation, for any
 $Pr$, under the assumption that the total vertical heat flux is independent of the fluid layer depth
 $L$ (but not of
 $\kappa$ and
 $\nu$ as in the geostrophic turbulence regime). This assumption immediately gives the scaling relations
 $Nu\propto Ra^{1/3}$ for the case of weak or no rotation (Malkus Reference Malkus1954; Priestley Reference Priestley1959), and
 $Nu\propto \widetilde {Ra}^3$ for the case of rotation dominance, see e.g. Boubnov & Golitsyn (Reference Boubnov and Golitsyn1990) and King, Stellmach & Aurnou (Reference King, Stellmach and Aurnou2012). Although such scaling of
 $Nu$ with the control parameters was observed in some experiments and simulations for no-slip BCs at the plates and periodic lateral BCs (King et al. Reference King, Stellmach and Aurnou2012; Stellmach et al. Reference Stellmach, Lischper, Julien, Vasil, Cheng, Ribeiro, King and Aurnou2014; Cheng et al. Reference Cheng, Stellmach, Ribeiro, Grannan, King and Aurnou2015; Cheng & Aurnou Reference Cheng and Aurnou2016; Julien et al. Reference Julien, Aurnou, Calkins, Knobloch, Marti, Stellmach and Vasil2016; Aguirre Guzmán et al. Reference Aguirre Guzmán, Madonia, Cheng, Ostilla-Mónico, Clercx and Kunnen2021; Lu et al. Reference Lu, Ding, Shi, Xia and Zhong2021), the behaviour of
 $Re$ and convective length scales in that regime remains unclear. Also unclear is how this regime is connected to the regime of geostrophic turbulence.
In this work, we present results of the DNS of RRBC for  $Pr=1$ and extreme parameter range for
 $Ra$ from
 $1.5\times 10^{10}$ to
 $3\times 10^{13}$, and
 $Ek$ from
 $1.5\times 10^{-7}$ down to
 $5\times 10^{-9}$ (see figure 1 for the parameter space). For the first time, we derive both geostrophic regimes within a new unifying theoretical framework, achieve both regimes in our DNS, and show the scaling relations for
 $Nu$ and
 $Re$, the convective length scale, kinetic energy and thermal dissipation rates in both regimes. The proposed scaling argument can be used as a simple framework for deriving not only the heat transfer, but also the flow speed as well as convective length scale scaling relations in different flow regimes in rotating convection. The transition between the two regimes is seen in the scalings of all quantities; however, the scaling with
 $Ra$ and
 $Ek$ of the convective bulk length scale
 $\ell$ remains the same in both regimes. Note that this transition between the two rotation-dominated regimes is of course very different from the transition between the rotation dominance and the gravitational buoyancy dominance in RRBC (Stevens, Clercx & Lohse Reference Stevens, Clercx and Lohse2013; Kunnen Reference Kunnen2021; Ecke & Shishkina Reference Ecke and Shishkina2023). For a discussion of the latter transition, we refer to (Ecke & Shishkina Reference Ecke and Shishkina2023, § 3.3).
Convective heat transport  $Nu-1$ as a function
 $Ra$, for different
 $Ek$ values and
 $Pr=1$. All studied cases correspond to the rotation-dominated regime of RRBC (the Rossby number is
 $Ro\ll 1$). One can see that when
 $Ra$ is sufficiently large and
 $Ek$ sufficiently small,
 $Nu-1$ scales as
 ${\propto }Ra^3$ for relatively smaller values of
 $Ra$, and as
 ${\propto }Ra^{3/2}$ for larger
 $Ra$.

2. Numerical details
The Boussinesq approximation is used to describe RRBC of a fluid between two horizontal plates, which is rotated with a constant angular velocity  $\varOmega$ around the vertical axis
 $z$, under gravitational acceleration
 $g=-g\boldsymbol {e}_z$, where
 $\boldsymbol {e}_z$ is the vertical unit vector. The chosen reference scales are the height of the domain
 $L$, the temperature difference between the plates
 $\varDelta$, and the characteristic free-fall velocity
 $U_{ff}=\sqrt {g\alpha _TL\varDelta }$. Non-dimensional temperature
 $\theta$, velocity
 $\boldsymbol {u}$, pressure
 $p$ and time
 $t$ are obtained using these scales. The dimensionless governing equations for the incompressible fluid are
 $\boldsymbol {\nabla }\boldsymbol {\cdot }\boldsymbol {u} = 0$,
 $$\begin{gather} \frac{{\partial} \boldsymbol{u}}{{\partial} t}+\boldsymbol{u}\boldsymbol{\cdot}\boldsymbol{\nabla}\boldsymbol{u} =-\boldsymbol{\nabla} p+\sqrt{\frac{Pr}{Ra}}\,\nabla^2\boldsymbol{u}+\theta\boldsymbol{e}_z -\frac{1}{Ek}\,\sqrt{\frac{Pr}{Ra}}\,\boldsymbol{e}_z\times\boldsymbol{u}, \end{gather}$$
 $$\begin{gather}\frac{{\partial} \theta}{{\partial} t} + \boldsymbol{u}\boldsymbol{\cdot}\boldsymbol{\nabla} \theta = \frac{1}{\sqrt{Ra\,Pr}}\,\nabla^2\theta. \end{gather}$$
No-slip boundaries and constant temperature conditions at the bottom and top plates were applied. We consider periodic BCs in horizontal directions, to avoid the wall modes in rapidly RRBC (Ecke, Zhong & Knobloch Reference Ecke, Zhong and Knobloch1992; Herrmann & Busse Reference Herrmann and Busse1993; Favier & Knobloch Reference Favier and Knobloch2020; Shishkina Reference Shishkina2020; de Wit et al. Reference de Wit, Aguirre Guzmán, Madonia, Cheng, Clercx and Kunnen2020, Reference de Wit, Boot, Madonia, Guzmán and Kunnen2023; Zhang et al. Reference Zhang, van Gils, Horn, Wedi, Zwirner, Ahlers, Ecke, Weiss, Bodenschatz and Shishkina2020; Zhang, Ecke & Shishkina Reference Zhang, Ecke and Shishkina2021; Ecke, Zhang & Shishkina Reference Ecke, Zhang and Shishkina2022). To solve the governing equations, an energy-conserving second-order finite-difference code AFiD was utilized (Verzicco & Orlandi Reference Verzicco and Orlandi1996; van der Poel et al. Reference van der Poel, Ostilla-Mónico, Donners and Verzicco2015; Zhu et al. Reference Zhu2018). The original code was updated to include a Coriolis force term in the momentum equations to account for system rotation. The code was parallelized using a two-dimensional pencil domain decomposition strategy, allowing it to effectively handle large-scale computations (van der Poel et al. Reference van der Poel, Ostilla-Mónico, Donners and Verzicco2015). In every studied case, the computational domain size is large enough to capture the typical flow structures: specifically, the horizontal extension of the domain is at least  $20$ times larger than the onset convective length scale
 $2.4\,Ek^{1/3}$. The computational grids are fine enough to the resolve Kolmogorov microscales in the bulk and in the boundary layers (Shishkina et al. Reference Shishkina, Stevens, Grossmann and Lohse2010). Thus the maximal value of the ratio of the mesh size to the mean Kolmogorov microscale is always smaller than
 $2.2$, even for the highest
 $Ra=3.0\times 10^{13}$. There are always at least
 $10$ grid points in each thermal and viscous (Ekman) boundary layer. For example, at
 $Ra=3.0\times 10^{13}$,
 $Ek=5.0\times 10^{-9}$ with aspect ratio
 $0.125$,
 $N_z\times N_x\times N_y = 2048\times 1024\times 1024$ grid points are used in the vertical (
 $N_z$) and two horizontal (
 $N_x,N_y$) directions. Additionally, simulations lasting at least
 $400$ free-fall time units were performed to ensure that statistically steady flow states are achieved. The convergence of the Nusselt numbers is checked for the entire domain. In this study, the maximum relative errors of the Nusselt numbers calculated by five different methods listed in Appendix A were less than
 $1\,\%$ (see table 3).
3. Results
In what follows, we assume that in any rotation-dominated regime, the dimensionless convective heat transport is proportional to a power function of the supercriticality parameter  $\widetilde {Ra}\equiv Ra\,Ek^{4/3}$ (see e.g. Julien et al. Reference Julien, Knobloch, Rubio and Vasil2012a; Stellmach et al. Reference Stellmach, Lischper, Julien, Vasil, Cheng, Ribeiro, King and Aurnou2014),
 \begin{equation} Nu-1\propto \widetilde{Ra}^\xi, \end{equation}
with different exponents  $\xi$ in different regimes. First, we discuss relations that hold in both studied rotation-dominated regimes and recall the rigorous relations for the time- and volume-averaged kinetic energy dissipation rate
 $\epsilon _u=\langle \nu (\partial _iu_j(\boldsymbol {x},t))^2 \rangle$ and thermal dissipation rate
 $\epsilon _\theta =\langle \kappa (\partial _i\theta (\boldsymbol {x},t))^2 \rangle$ that hold in RRBC (Ahlers et al. Reference Ahlers, Grossmann and Lohse2009):
 $$\begin{gather} \epsilon_u= ({\nu^3}/{L^4})(Nu-1)\,Ra\,Pr^{-2}, \end{gather}$$
 $$\begin{gather}\epsilon_\theta= \kappa({\varDelta^2}/{L^2})\,Nu. \end{gather}$$
We introduce  $u$,
 $\theta$ and
 $\ell$, which are the representative convective scales for, respectively, the velocity, temperature and length. The total heat flux can be decomposed into a conductive contribution
 $\kappa \varDelta /L$ and a convective contribution
 $q$ that scales as
 $q\sim u\theta$. The dimensionless convective heat flux then scales as
 \begin{equation} Nu-1\sim \frac{q}{\kappa\varDelta/L}\sim \frac{u\theta}{\kappa\varDelta/L}. \end{equation}
Analogously, the total thermal dissipation rate  $\epsilon _\theta$ can be decomposed into a conductive contribution
 $\kappa {\varDelta ^2}/{L^2}$ and a convective contribution
 $\tilde \epsilon _{\theta }$, which scales as
 $\tilde \epsilon _{\theta }\sim {u\theta ^2}/{\ell }$. This, in combination with (3.3), gives
 \begin{equation} Nu-1\sim \frac{\tilde \epsilon_{\theta}}{\kappa \varDelta^2/L^2}\sim \frac{\theta^2}{\varDelta^2}\,\frac{L}{\ell}\,\frac{uL}{\nu}\,\frac{\nu}{\kappa}. \end{equation}
Combining (3.4) and (3.5), we obtain  $\ell /L\sim \theta /\varDelta$, which together with (3.5) leads to
 \begin{equation} Nu-1\sim \frac{\theta^2}{\varDelta^2}\,\frac{L}{\ell}\,Re\,Pr\sim \frac{\ell}{L}\,Re\,Pr. \end{equation}
The same scaling relation (3.6) has also been applied to quasi-static magnetoconvection (Bader & Zhu Reference Bader and Zhu2023). In a turbulent flow,  $\epsilon _u$ scales as
 $\epsilon _u \sim {u^3}/{\ell }$, which can also be obtained from the Coriolis, inertia and Archimedean force balance (Landau & Lifshitz Reference Landau and Lifshitz1987; Gastine et al. Reference Gastine, Wicht and Aubert2016; Madonia et al. Reference Madonia, Guzmán, Clercx and Kunnen2023). This, in combination with (3.2) and (3.6), leads to
 $$\begin{gather} Re \sim ({\ell}/{L})\,Pr^{-1/2}\,Ra^{1/2}, \end{gather}$$
 $$\begin{gather}Nu-1\sim ({\ell}/{L})^2\,Pr^{1/2}\,Ra^{1/2}. \end{gather}$$
The dimensional convective bulk length scale  $\ell$ is diffusion-free in the geostrophic turbulence regime, meaning that it is independent of
 $\nu$ and
 $\kappa$. If
 $\ell /L$ is thought of as a product of power functions of
 $Ra$,
 $Ek$ and
 $Pr$, then the requirement for
 $\ell /L$ to be diffusion-free, i.e.
 $\ell /L\propto \nu ^0\kappa ^0$, means that
 $\ell /L$ must scale as
 \begin{equation} \ell/L\sim Ra^a\,Ek^{2a}\,Pr^{-a} \end{equation}
for some value of  $a$. From (3.8) and (3.9), it follows that
 \begin{equation} Nu-1\propto \widetilde{Ra}^{2a+1/2}\,Ek^{(4a-2)/3}. \end{equation}
From (3.1) and (3.10), we derive  $a=1/2$ and
 $\xi =3/2$, therefore the following relations must be fulfilled:
 $$\begin{gather} \ell/L \sim Ra^{1/2}\,Ek\,Pr^{-1/2}, \end{gather}$$
 $$\begin{gather}Nu-1 \sim Ra^{3/2}\,Ek^{2}\,Pr^{-1/2}, \end{gather}$$
 $$\begin{gather}Re \sim Ra\,Ek\,Pr^{-1}, \end{gather}$$
 $$\begin{gather}(L^4/\nu^3)\epsilon_u \sim Ra^{5/2}\,Ek^{2}\,Pr^{-5/2}. \end{gather}$$
Note that  $a=1/2$ means that
 $\ell /L$ scales as the Rossby number
 $Ro\equiv \sqrt {Ra/Pr}\,Ek$. Equations (3.11)–(3.14) show that in the geostrophic turbulence regime, the dimensional convective bulk length scale
 $\ell$ and velocity scale
 $\nu Re/L$, the convective heat flux
 $\kappa \varDelta /L(Nu-1)$ and the dissipation rates are all diffusion-free; they all scale as
 $\propto \nu ^0\kappa ^0$. Some of the scaling relations (3.11)–(3.13) for the geostrophic turbulence were proposed in Aurnou et al. (Reference Aurnou, Horn and Julien2020); see also Sprague et al. (Reference Sprague, Julien, Knobloch and Werne2006), Julien et al. (Reference Julien, Rubio, Grooms and Knobloch2012b), Plumley & Julien (Reference Plumley and Julien2019), Guervilly et al. (Reference Guervilly, Cardin and Schaeffer2019) and Ecke & Shishkina (Reference Ecke and Shishkina2023). Previously, the scaling relations for
 $Nu$,
 $Re$ and
 $\ell$ without diffusion effects were proposed independently through various theories and analyses. Our scaling argument unifies the picture and suggests that all three scaling relations (3.11)–(3.13) should hold simultaneously to characterize the system as a geostrophic turbulence regime.
One can argue that  $\ell$ can be non-dimensionalized (without involving
 $\nu$ or
 $\kappa$) not only with
 $L$ but in another way, using e.g.
 $\alpha _T\varDelta g/\varOmega ^2$ as the reference length. In that case the diffusion-free length scale would imply
 $\ell /(\alpha _T\varDelta g/\varOmega ^2)\sim Ra^b\,Ek^{2b}\,Pr^{-b}$ for some
 $b$, which is equivalent to
 $\ell /L\sim Ra^{1+b}\,Ek^{2b+2}\,Pr^{-1-b}$. Combining this with (3.8) and (3.1), we derive that
 $b=-1/2$ and
 $\xi =3/2$, and that the scaling relations for the geostrophic turbulence, that is, (3.11)–(3.14), should hold anyway.
To verify the scaling relations (3.11)–(3.14), we have conducted DNS of RRBC in domains with periodic lateral BCs, in order to avoid the effect of the wall modes (Rossby Reference Rossby1969; Favier & Knobloch Reference Favier and Knobloch2020) or boundary zonal flows (Zhang et al. Reference Zhang, van Gils, Horn, Wedi, Zwirner, Ahlers, Ecke, Weiss, Bodenschatz and Shishkina2020; Wedi et al. Reference Wedi, Moturi, Funfschilling and Weiss2022). The studied cases in the DNS parameter range are unprecedented:  $Ra$ up to
 $3\times 10^{13}$, and
 $Ek$ down to
 $5\times 10^{-9}$. First, we verify that
 $\ell /L$ scales according to (3.11). It is indeed fulfilled, since
 $(\ell /L)\,Ra\,Ek$ scales as
 \begin{equation} (\ell/L)\,Ra\,Ek \propto Ra^{3/2}\,Ek^2= \widetilde{Ra}^{3/2}.\end{equation}
This is supported by the DNS data presented in figure 2(a). Here, following Guervilly, Hughes & Jones (Reference Guervilly, Hughes and Jones2014), Guervilly et al. (Reference Guervilly, Cardin and Schaeffer2019) and Maffei et al. (Reference Maffei, Krouss, Julien and Calkins2021), we conduct the two-dimensional (2-D) Fourier transforms of the instantaneous vertical velocity  $u_z$ at the mid-height, in order to evaluate
 $\ell /L$ as
 $\ell /L=\sum _{k_h} [\hat {u}_z(k_h)\,\hat {u}^*_z(k_h)]/\sum _{k_h} k_h [\hat {u}_z(k_h)\,\hat {u}^*_z(k_h)]$, where
 $\hat {u}_z(k_h)$ and
 $\hat {u}^*_z(k_h)$ are, respectively, the 2-D Fourier transforms of
 $u_z$ and its complex conjugate, and
 $k_h\equiv (k_x^2+k_y^2)^{1/2}$ is the horizontal wavenumber. The use of other quantities to evaluate the convective length scale leads to similar results. Here, we also conduct the 2-D Fourier transforms of the temperature fluctuations
 $\theta '=\theta - \langle \theta \rangle$ to calculate the convective length scale
 $\ell _{\theta }/L$. As demonstrated in figure 3, the convective length scale follows the scaling of
 $Ra^{1/2}\,Ek$ in two regimes: one is the low
 $Ra\,Ek^{4/3}\leq 30$ regime, and the other is the high
 $Ra\,Ek^{4/3}\geq 80$ regime.
Dimensionless (a) convective length scale  $\ell /L$ (multiplied by
 $Ra\,Ek$), (b) heat transport
 $Nu-1$, and (c)
 $Re$ (multiplied by
 $Ek^{1/3}$), as functions of
 $\widetilde {Ra}$, for all DNS data from figure 1. The DNS demonstrate
 $\ell /L\sim Ro$. (a) The inset shows
 $\ell /L$, normalized by
 $Ro$. (b) The data for different
 $Ek$ fall on one graph. For larger
 $\widetilde {Ra}$,
 $Nu-1$ scales as expected for the geostrophic turbulence regime, i.e.
 $Nu-1 \propto \widetilde {Ra}^{3/2}$ (solid line), while for smaller
 $\widetilde {Ra}$, one observes a transition to a regime with
 $Nu-1 \propto \widetilde {Ra}^{3}$ (dashed line). In the inset, the same data are presented in a compensated way, where the normalization is chosen according to the best fit of the data for
 $Ek=5\times 10^{-9}$ and large values of
 $Ra$,
 $Nu-1\propto Ra^{1.45\pm 0.05}$. (c) For larger
 $\widetilde {Ra}$,
 $Re$ scales almost as expected for the geostrophic turbulence regime:
 $Re \propto Ra\,Ek$ (solid line), while for smaller
 $\widetilde {Ra}$, it scales as
 $Re \propto Ra^{5/2}\,Ek^3$ (dashed line). In the inset,
 $Re$, normalized by its scaling in the geostrophic diffusion-free regime, i.e.
 $Re/(Ra\,Ek)$, is plotted versus
 $\widetilde {Ra}$.

(a) Dimensionless convective length scale  $\ell _{\theta }/L$ (multiplied by
 $Ra\,Ek$) evaluated by the temperature fluctuations, and (b) its compensation with
 $Ra^{1/2}\,Ek$ as a function of
 $Ra\,Ek^{4/3}$. Symbols have the same meanings as in figure 1.

As assumed in (3.1),  $Nu-1$ indeed behaves as a function of
 $\widetilde {Ra}$, since all data from figure 1 follow a master curve when plotted versus
 $\widetilde {Ra}$; see figure 2(b). For large values of
 $\widetilde {Ra}$,
 $Nu-1$ scales according to (3.12), as expected. At
 $\widetilde {Ra}\approx 30$, one observes a transition to some other regime for lower
 $\widetilde {Ra}$, with a steeper growth of
 $Nu$.
To verify the theoretical predictions on the  $Re$-scaling in the geostrophic turbulence regime, we notice that
 $Re\,Ek^{1/3}$ should scale as
 $\propto \widetilde {Ra}$ if relation (3.13) holds. Indeed, the data in figure 2(c) support this scaling relation for large
 $\widetilde {Ra}$. Here, following Guervilly et al. (Reference Guervilly, Hughes and Jones2014, Reference Guervilly, Cardin and Schaeffer2019), Gastine et al. (Reference Gastine, Wicht and Aubert2016) and Maffei et al. (Reference Maffei, Krouss, Julien and Calkins2021), in order to minimize the impact from the large-scale vortices and properly characterize the amplitude of convective bulk motions and evaluate
 $Re$, we use the vertical velocity
 $u_z$ as the typical velocity scale:
 $Re=\sqrt {\langle u_z^2\rangle }\,L/\nu$. Note that our DNS as well as previous DNS for periodic lateral BCs show formation of large-scale vortices in the geostrophic turbulence regime, which is also associated with an additional increase of
 $Re$ for larger
 $\widetilde {Ra}$ (Julien et al. Reference Julien, Knobloch, Rubio and Vasil2012a,Reference Julien, Rubio, Grooms and Knoblochb; de Wit et al. Reference de Wit, Aguirre Guzmán, Madonia, Cheng, Clercx and Kunnen2022). Thus all shown scalings of
 $\ell /L$,
 $Nu-1$ and
 $Re$ for large
 $\widetilde {Ra}$ follow the predictions (3.11)–(3.13) for the geostrophic turbulence regime.
In order to quantify the quality of the agreement between the derived diffusion-free scaling relations and the DNS data, we fit the exponents of the heat transport scaling  $Nu-1 \propto Ra^{\alpha }\,Ek^{2}$, the velocity scaling
 $Re \propto Ra^{\beta }\,Ek$, and the convective length scale scaling
 $\ell /L \propto Ra^{\gamma }\,Ek$, based on different
 $Ra$ ranges of data points for
 $Ek=5\times 10^{-9}$. The results are listed in table 1. As demonstrated in table 1, with 95 % confidence, the heat transport scaling exponent
 $\alpha$ ranges from
 $1.42$ to
 $1.48$, the momentum transport scaling exponent
 $\beta$ ranges from
 $1.16$ to
 $1.18$, and the convective length scale scaling exponent
 $\gamma$ ranges from
 $0.46$ to
 $0.70$, with variant fitting data points. The values of the exponents
 $\alpha$ and
 $\beta$ do not change much with the changing number of the fitting data points, while the value of the exponent
 $\gamma$ is quite sensitive to the fitting
 $Ra$ range, and it seems to converge to the predicted theoretical value when fitting with more data points.
The theoretical and least squares fit exponents of  $Nu-1 \propto Ra^{\alpha }\,Ek^{2}$,
 $Re \propto Ra^{\beta }\,Ek$ and
 $\ell /L \propto Ra^{\gamma }\,Ek$ of the geostrophic turbulence regime. The least squares fit is conducted at the smallest
 $Ek=5\times 10^{-9}$, with different data points, with 95 % confidence. The first data point is chosen at
 $Ra=8.0\times 10^{12}$, where the geostrophic turbulence regime begins to set in.

But what is the regime of a steeper growth of  $Nu-1$ and
 $Re$ that we observe for smaller
 $\widetilde {Ra}$ (
 $\widetilde {Ra}\lesssim 30$) in figure 2? How can we understand its scaling relations theoretically?
For any given  $Ek$, with decreasing
 $\widetilde {Ra}$, the flow should gradually laminarize, and the
 $\epsilon _u$-scaling should undergo transition to the scaling
 $\epsilon _u \sim \nu {u^2}/{\ell ^2}$. This relation, in combination with (3.2) and (3.6), leads to
 $$\begin{gather} Re \sim ({\ell}/{L})^3\,Pr^{-1}\,Ra, \end{gather}$$
 $$\begin{gather}Nu-1\sim ({\ell}/{L})^4\,Ra. \end{gather}$$
The DNS data show that in this regime of lower  $\widetilde {Ra}$, the convective bulk length scale
 $\ell /L$ is also proportional to
 $Ra^{1/2}\,Ek$; see figure 2(a). From this, (3.17) and (3.1), we obtain
 $\xi =3$, meaning a steeper growth of
 $Re$ and
 $Nu$ with increasing
 $\widetilde {Ra}$:
 $$\begin{gather} \ell/L \propto Ra^{1/2}\,Ek, \end{gather}$$
 $$\begin{gather}Nu-1 \propto Ra^{3}\,Ek^{4}, \end{gather}$$
 $$\begin{gather}Re \propto Ra^{5/2}\,Ek^3, \end{gather}$$
 $$\begin{gather}(L^4/\nu^3)\epsilon_u \propto Ra^{4}\,Ek^{4}. \end{gather}$$
The steep  $Nu$-scaling (3.19) was derived in Boubnov & Golitsyn (Reference Boubnov and Golitsyn1990), where the marginal thermal boundary layer instability in rotating convection was considered. The steep heat transfer scaling
 $Nu-1\sim Ra^3\,Ek^4$ can be considered as an asymptotic scaling relation in RRBC. Recently, Grooms & Whitehead (Reference Grooms and Whitehead2015) derived from the asymptotically reduced equations for
 $Ra\,Ek^{8/5} = O(1)$ in the limit of rapid rotation
 $Ek \rightarrow 0$ and strong thermal forcing
 $Ra \rightarrow \infty$, that there exists an upper bound on the heat transport in RRBC:
 $Nu \leq 20.56\,Ra^3\,Ek^4$ for an infinite Prandtl number
 $Pr \rightarrow \infty$. A similar scaling relation was derived by King et al. (Reference King, Stellmach and Aurnou2012) via the marginal thermal boundary layer instability criterion, which can be viewed as an asymptotic state where the destabilising effect of buoyancy and stabilising effect of rotation are balanced at the edge of a thermal boundary layer. As demonstrated here, in the steep heat transfer regime, the kinetic energy dissipation rate
 $\epsilon _u$ is viscous-dependent when the flow is not fully turbulent.
Hence it is noteworthy that the present scaling argument provides a unified framework to derive both the geostrophic turbulence and steep heat transport scaling regimes of rapidly RRBC. Thus we propose that with decreasing  $\widetilde {Ra}$, the regime of geostrophic turbulence, (3.11)–(3.14), should undergo transition to another scaling regime, (3.18)–(3.21), and in both regimes, (3.18) should hold. And indeed, our DNS data fully support this. For smaller
 $\widetilde {Ra}$,
 $Nu-1$ follows the relation (3.19), while for larger
 $\widetilde {Ra}$, it scales according to (3.12); see figure 2(b). The theory says that
 $Re\,Ek^{1/3}$ should scale as
 $\propto \widetilde {Ra}$ in the geostrophic turbulence regime (3.13), and as
 $\propto \widetilde {Ra}^{5/2}$ in the other regime (3.20), and indeed, the data in figure 2(c) support these scaling relations. Moreover, as elucidated in Appendix B, all the derived scaling relations for
 $\epsilon _u$ and
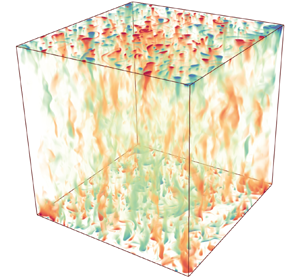
 $\tilde \epsilon _{\theta }$ also hold in both regimes. The typical flow structures in these two scaling regimes are shown in figure 4; they are Taylor columns and geostrophic turbulence, respectively. Obviously, the flows are dominated by the vertically aligned structures: columns and plumes. In contrast to non-rotating Rayleigh–Bénard convection, where a large-scale circulation spans the bottom and top walls in the flow field, the flow displays convective motions that have much smaller length scales compared to the domain size.
The thermal fluctuations  $(\theta - \langle \theta \rangle _A)/\varDelta$ illustrate (a) the Taylor columns at
 $Ra=2.5\times 10^{12}$, and (b) geostrophic turbulence at
 $Ra=10^{13}$, in these two regimes for
 $Ek=5\times 10^{-9}$. Here,
 $\langle \cdot \rangle _A$ denotes the average in time and over any horizontal cross-section
 $A$. For clarity, the domains are stretched horizontally by a factor
 $8$ (see also the supplementary movies available at https://doi.org/10.1017/jfm.2024.249).

To quantify the quality of the agreement between the derived steep heat transport scaling relations and the DNS data, we also fit the exponents of the heat transport scaling  $Nu-1 \propto Ra^{\alpha }\,Ek^{4}$, the velocity scaling
 $Re \propto Ra^{\beta }\,Ek^3$, and the convective length scale scaling
 $\ell /L \propto Ra^{\gamma }\,Ek$, based on different
 $Ra$ ranges of data points for
 $Ek=5\times 10^{-9}$. The results are listed in table 2. With 95 % confidence, the heat transport scaling exponent
 $\alpha$ ranges from
 $3.00$ to
 $3.33$, the momentum transport scaling exponent
 $\beta$ ranges from
 $2.17$ to
 $2.29$, and the convective length scale scaling exponent
 $\gamma$ ranges from
 $0.35$ to
 $0.45$, with variant fitting data points. As compared to the geostrophic turbulence regime, the value of the exponent
 $\alpha$ here is more sensitive to the fitting
 $Ra$ range, but it gradually decreases to the predicted value when fitting with more data points. The values of the exponents
 $\beta$ and
 $\gamma$ do not differ much for different numbers of the fitting data points; they stay close to the predicted values.
The theoretical and least squares fit exponents of  $Nu-1 \propto Ra^{\alpha }\,Ek^{4}$,
 $Re \propto Ra^{\beta }\,Ek^{3}$ and
 $\ell /L \propto Ra^{\gamma }\,Ek$ of the steep heat transport regime. The least squares fit is conducted at the smallest
 $Ek=5\times 10^{-9}$, with different data points, with 95 % confidence. The last data point is chosen at
 $Ra=3.0\times 10^{12}$, where the steep heat transport regime undergoes transition to the other regime.

It should be noted that near the onset of steady convection, the linear instability analysis gives the onset convective length scale  $\ell /L \sim 4.8154\,Ek^{1/3}=L_c$ for
 $Pr\geq 0.68$ (Chandrasekhar Reference Chandrasekhar1953). As demonstrated in figure 5, the convective length scales calculated for the vertical velocity and temperature fluctuations at smaller values of the supercriticality parameter do show a trend towards the onset length scale
 ${\sim }Ek^{1/3}$. However, the compensated value converges to about
 $7$ at the lowest studied value of the supercriticality parameter, which is slightly larger than the predicted value
 $4.8$ for the onset wavelength. However, as demonstrated in Appendix C, the convective length scale
 $\ell /L$ used in figure 2(a) is very close to the onset length scale for the range of
 $Ra\,Ek^{4/3}/8.7 \leq 2$. In addition, as demonstrated in table 2, the scaling of the convective length scale gradually deviates from
 $Ra^{1/2}$ and changes into
 $Ra^{0.35}$ for the lower
 $Ra$ range. This result is quite close to
 $Ra^{0.38}$ as reported by Madonia et al. (Reference Madonia, Guzmán, Clercx and Kunnen2021) (close to onset regime), who calculated the length scale based on the autocorrelation function of the vertical velocity. To this end, the convective length scale study conducted here clearly demonstrates that different definitions of the length scale can significantly affect the scaling results.
Dimensionless (a) convective length scale  $\ell /L$ and (b) convective length scale
 $\ell _{\theta }/L$ compensated with the onset length scale of
 $Ek^{1/3}$ as a function of
 $Ra\,Ek^{4/3}$.

4. Conclusions
To sum up, based on our DNS of RRBC for extreme  $Ra$ and
 $Ek$, we have verified for the first time the existence and all the heat and momentum transport as well as the convective length scale (3.11)–(3.14) for the geostrophic turbulence regime. Furthermore, we have shown that this regime is connected to another rotation-dominated regime, (3.18)–(3.21), which can be achieved from geostrophic turbulence regime by decreasing the thermal driving (
 $Ra$), while keeping constant rotation (
 $Ek$). The principle difference between the two regimes is the different scaling of the kinetic energy dissipation rate: it is turbulent in one case and laminar in the other. Based on this conceptual framework, we proposed a scaling theory that unifies the two geostrophic regimes in RRBC. This theory can also be applied to derive scaling regimes in e.g. magnetoconvection while considering the Ohmic dissipation caused by the magnetic field.
Supplementary movies
Supplementary movies are available at https://doi.org/10.1017/jfm.2024.249.
Acknowledgements
We thank J.M. Aurnou, R.E. Ecke, K. Julien and D. Lohse for illuminating discussions, and gratefully acknowledge the support from the Alexander von Humboldt Foundation and German Research Foundation (DFG), and the computing time provided on the high-performance computer Lichtenberg at the NHR Centers NHR4CES, the HPC systems of Max Planck Computing and Data Facility (MPCDF), the HoreKa supercomputer, and the GCS Supercomputer SuperMUC-NG at Leibniz Supercomputing Centre.
Declaration of interests
The authors report no conflict of interest.
Appendix A. Numerical parameters and grid resolutions
Three-dimensional DNS are performed for a broad parameter range with the Rayleigh number in  $1.5\times 10^{10}\leq Ra \leq 3\times 10^{13}$, Ekman number within
 $5\times 10^{-9}\leq Ek \leq 1.5\times 10^{-7}$, and Prandtl number
 $Pr=1$. The DNS are conducted in domains with no-slip top and bottom as well as periodic lateral BCs, in order to avoid the effect of the wall modes (Rossby Reference Rossby1969; Favier & Knobloch Reference Favier and Knobloch2020) or boundary zonal flows (Zhang et al. Reference Zhang, van Gils, Horn, Wedi, Zwirner, Ahlers, Ecke, Weiss, Bodenschatz and Shishkina2020; Wedi et al. Reference Wedi, Moturi, Funfschilling and Weiss2022). The full characterization of the DNS parameters is presented in table 3.
Summary of the quantities in the present DNS of RRBC. All simulations are performed at Pr=1. Here, Ra is the Rayleigh number, Re is the Reynolds number, Ek is the Ekman number, and Γ=D/L is the aspect ratio, where D is the horizontal period and L is the domain height. The averaged Nusselt number Nu is calculated from the Nu values evaluated in five different ways: at the bottom and top plates, by volume-averaging, from the kinetic energy, and from thermal dissipation rates. The ‘Error’ denotes the maximum relative error between each two of these values. The last column represents the grid mesh sizes used in the vertical (N z) and two horizontal (N x, N y) directions.

Appendix B. Dissipation rates scaling regimes
As the dissipation rates and their scaling relations in the main text are fundamental blocks to our theoretical derivations, we show both the kinetic energy and thermal dissipation rates as functions of  $Ra\,Ek^{4/3}$ in figure 6. Specifically, the kinetic energy dissipation rate should scale as (3.14) in the geostrophic turbulence regime, and (3.21) in the steep heat transport regime, respectively. As demonstrated in figures 6(a,b), these two derived scaling relations for
 $\epsilon _u$ are verified in both regimes. On the other hand, for the convective thermal dissipation rate, it is supposed to follow the same equations as for
 $Nu-1$, i.e. (3.12) in the geostrophic turbulence regime, and (3.19) in the steep heat transport regime, respectively. To this end, as shown in figures 6(c,d), these two scaling relations for
 $\tilde \epsilon _{\theta }$ are also verified in both regimes.
The dependence on  $\widetilde {Ra}$ of the time- and volume-averaged (a,b) kinetic dissipation rate
 $\epsilon _u$, and (c,d) convective thermal dissipation rate
 $\tilde \epsilon _{\theta }\equiv \epsilon _{\theta }-\kappa \varDelta ^2/L^2$. (a) For larger
 $\widetilde {Ra}$,
 $\epsilon _u$ scales as expected for the geostrophic turbulence regime:
 $\epsilon _u \propto Ra^{5/2}\,Ek^2$ (solid line), while for smaller
 $\widetilde {Ra}$, it scales as
 $\epsilon _u \propto Ra^{4}\,Ek^4$ (dashed line). (b) Here,
 $\epsilon _u$ is normalized by
 $Ra^{5/2}\,Ek^2$. (c) For larger
 $\widetilde {Ra}$,
 $\tilde \epsilon _{\theta }$ scales as expected for the geostrophic turbulence regime,
 $\tilde \epsilon _{\theta } \propto Ra^{3/2}\,Ek^2$ (solid line), while for smaller
 $\widetilde {Ra}$, it scales as
 $\tilde \epsilon _{\theta }\propto Ra^{3}\,Ek^4$ (dashed line). (d) Here,
 $\tilde \epsilon _{\theta }$ is normalized by
 $Ra^{3/2}Ek^2$. Symbols have the same meanings as in figure 1.

Appendix C. Approach to the onset length scale
In order to further demonstrate how the current results approach the actual onset wavelength, following the procedure of Nieves, Rubio & Julien (Reference Nieves, Rubio and Julien2014) and Madonia et al. (Reference Madonia, Guzmán, Clercx and Kunnen2021), we calculate the spatial autocorrelation function of the vertical velocity at the middle height ( $z=0.5$) as follows
 \begin{equation} \text{Corr}(\Delta x) = \frac{\langle u_z^{\prime}(x,t)\,u_z^{\prime} (x+\Delta x,t)\rangle}{\langle u_z^{\prime 2}(x,t)\rangle}. \end{equation}
Here,  $u_z^{\prime }$ is the fluctuation part of the vertical velocity
 $u_z$, and
 $\Delta x$ is the separate spatial distance in the horizontal directions (
 $x$ or
 $y$). When we calculate the autocorrelation function in the
 $x$ (
 $\kern0.7pt y$) direction,
 $\langle \cdot \rangle$ denotes the average in the
 $y$ (
 $x$) direction (i.e. in another horizontal direction). Actually, the autocorrelation functions in the two horizontal directions show very similar results. As demonstrated in figure 7(a), for the lowest
 $Ra$ for each
 $Ek$, the autocorrelation functions show distinguished extrema for separate spatial distances, especially for
 $\Delta x /L_c \leq 2$. Specifically, according to Nieves et al. (Reference Nieves, Rubio and Julien2014), the first maximum in the autocorrelation signals occurs at the critical length scale (
 $\Delta x /L_c \approx 1$), which is also observed in the current dataset. Consistent with Nieves et al. (Reference Nieves, Rubio and Julien2014), the autocorrelation function calculated by temperature fluctuation displays very similar results as for the vertical velocity (not shown here). On the other hand, at constant
 $Ek$, as depicted in figure 7(b) with increasing
 $Ra$, the autocorrelation function gradually smoothes out and the peaks are not distinguishable. This impedes attempts to use this method to quantify the convective length scale for high
 $Ra\,Ek^{4/3}$ at plumes and geostrophic turbulence regimes. Nevertheless, based on the autocorrelation function, the locations at the first maximum/minimum or the zero values have been used to quantify the typical convective length scale. In the study of Madonia et al. (Reference Madonia, Guzmán, Clercx and Kunnen2021), the length scales calculated by different quantities with different locations displayed very different scaling relations. For the plumes and geostrophic turbulence regimes (
 $Ra/Ra_c >5$), the length scale defined by the spatial autocorrelations of the vertical velocity (the first zero location) shows a scaling of
 $Ra^{0.38}$, while the length scale calculated by the integral of the autocorrelation function seems to have a different scaling behaviour. For the lower supercriticality (
 $Ra/Ra_c \leq 5$) at the columnar regime, both length scales seem to be constant.
(a) Spatial ( $x$ direction) autocorrelation function of vertical velocity for the lowest
 $Ra$ for different
 $Ek$. (b) Spatial (
 $x$ direction) autocorrelation function of vertical velocity for different
 $Ra$ at
 $Ek=5\times 10^{-9}$.

In figure 8, we show the convective length scale evaluated by the first minimum/maximum value locations (marked as an orange square/purple circle in figure 7a) in the autocorrelation functions of the vertical velocity. But we show only the results for  $Ra\,Ek^{4/3}/8.7 \leq 2$ where these peaks are distinguished. For
 $\ell _{min}/L$ in figure 8(a), the compensated value is approximately
 $3$ and remains constant in the range
 $Ra\,Ek^{4/3}/8.7 \leq 2$. This implies that the length scale
 $\ell _{min}/L$ follows the onset length scale very well in this range. If we choose the first maximum value location to evaluate the length scale, then the compensated value of
 $\ell _{max}/L$ in figure 8(b) increases slightly from 5 to 6.5 for the range
 $Ra\ Ek^{4/3}/8.7 \leq 2$. This value is very close to the compensated value
 $7$ of length scale
 $\ell /L$ calculated by the spectra method (see figure 5a), where the ensemble integral operation is used. This demonstrates clearly that different definitions of the length scale can significantly affect the scaling results. Hence the convective length scale
 $\ell /L$ used in figure 2(a) is very close to the onset length scale for the range
 $Ra\,Ek^{4/3}/8.7 \leq 2$.
Dimensionless convective length scale (a)  $\ell _{min}/L$ and (b)
 $\ell _{max}/L$ compensated with
 $Ek^{1/3}$ as a function of
 $Ra\,Ek^{4/3}/8.7$ for
 $Ra\ Ek^{4/3}/8.7 \leq 2$. Here,
 $\ell _{min}/L$ is evaluated by the average of the first minimum value locations (marked as an orange square in figure 7a) in the
 $x$ and
 $y$ autocorrelation functions of vertical velocity;
 $\ell _{max}/L$ is evaluated by the average of the first maximum value locations (marked as a purple circle in figure 7a) in the
 $x$ and
 $y$ autocorrelation functions of vertical velocity.


 Open access

