


Introduction
To promote the idea of ‘education through music’, at the beginning of this century, the well-known conductor Daniel Barenboim launched three music education projects aimed at children aged between 3 and 5 years: the Music Kindergarten in Berlin, the Music Kindergarten in Ramallah (Palestine) and the Early Childhood Music Education project (Educación Musical Infantil, hereinafter EMI) in Andalusia. The last two were developed through the Barenboim-Said Foundation. Footnote 1 The pedagogical framework of the three music education projects is based on Barenboim’s ideas on music education, according to which music consistently contributes to child education, hence the motto ‘education through music, not music education’. In Barenboim’s view, music acts as a microcosm in which a person can learn about the world and human being, since music, as such, encloses the world (Barenboim & Kahl, Reference BARENBOIM and KAHL2006). He believes that we can learn music but, more importantly, we can learn from music, for this means discovering and exploring the connections between music and life (Barenboim & Said, Reference BARENBOIM and SAID2002).
In Barenboim’s vision, through the comprehension of music we can understand ourselves, the world, humanity and society. Through it we can learn, for example, the intimate relationship between time and content, present both in music and everyday life. Furthermore, we can become familiar with the relationship between individualism and collectivism (Barenboim & Cheah, Reference BARENBOIM and CHEAH2009), and through making music in an orchestra, we can learn to live in a democratic society. In fact, for Barenboim, in an orchestra we must learn when to lead and when to follow, when to claim space for ourselves and when to leave space for others (Barenboim & Said, Reference BARENBOIM and SAID2002). Moreover, playing in an ensemble is an inclusive activity in which all the instruments, regardless of their role in the composition, are equally important. Music can teach us about the world because, according to Barenboim (cited in Doerne, Reference DOERNE2010),
[T]he content of music has something to do with the human condition; with what a person we want to be: emotions, thoughts, everything. That is why it is natural that one person sees music as something purely rational, like mathematics, another as something poetic, and the next as a sensory experience. Music encloses everything, everything is in it (p. 4).
In Barenboim’s concept, education through music is not merely early instruction in music, but education for life. The most important role of educators in this process is to build bridges between music and different educational settings, thus making music a natural medium for the development of language, movement and cognition, as well as social and emotional skills (Doerne, Reference DOERNE2010). These are the dimensions of child development that the EMI project seeks to foster through music education.
The EMI project
The philosophical character of Barenboim’s ideas on education through music raised the question of their pedagogical implementation from the very start. The pedagogical and structural principles of the EMI project were established in collaboration with a team of pedagogues specialising in different music education methodologies. Indeed, the EMI project owes most of its characteristics to Dalcroze rhythmics, Orff’s Schulwerk and Gordon’s Music Learning Theory, among others. In order to provide an overview of how the EMI project works and the extent to which it leverages Barenboim’s ideas on music education, the structural and pedagogical features will be briefly described below.
The EMI project runs at 23 Andalusian state preschools, attended by children aged between 3 and 5 years from different walks of life, regardless of their musical inclination or ability. During the 3 years of preschool, each child receives half an hour of music education daily from Monday to Thursday, during school hours, as part of the regular curriculum. Music education classes are taught in groups and are based on participatory activities designed to stimulate children’s appreciation, interpretation, creation and understanding of music as a language and expression. The music education classes are taught by music specialists from the Barenboim-Said Foundation fully trained in instrumental music and music education. The lesson contents are organised in four areas, sequenced by the music specialist according to the characteristics and needs of each class group: active listening, singing and vocal education, ensemble with Orff instruments, and rhythmics.
In order that the project should deploy its full educational potential and make the idea of education through music a reality, it is essential to coordinate the objectives and content of the music activities with those of the 3-year preschool curriculum. On a quarterly basis, the music specialist and the teachers of each group meet to design a programme in which music catalyses and enhances the concepts and content of different curricular area, thus creating a continuity between the EMI project and the regular curriculum.
The influence of music education on non-musical domains
Education through music refers to the ability of music to influence non-musical domains and, in particular, what Barenboim considers the educational domains (Doerne, Reference DOERNE2010). Since the publication of the study performed by Rauscher et al. (Reference RAUSCHER, SHAW and KY1993) on the Mozart effect, research has focused primarily on the impact of music on cognitive abilities, such as memory, language and literacy skills, phonological awareness and aural perception, visuospatial reasoning and mathematics. Studies demonstrating the influence of music on other non-musical domains base their arguments on the ‘transfer effect’. This effect is known as ‘near transfer’ when learned abilities are domain-specific, when, for example, music training improves pitch perception. By contrast, when learned abilities transfer from one domain to another, the effect is called ‘far transfer’ (Barnett & Ceci, Reference BARNETT and CECI2002). This is the case when, for example, music education has a positive influence on cognitive abilities.
Despite studies inquiring into far transfer in music becoming increasingly more frequent (Biasutti & Concina, Reference BIASUTTI and CONCINA2013; Jaschke et al., Reference JASCHKE, EGGERMONT, HONING and SCHERDER2013; Hallam, Reference HALLAM2015; Incognito et al., Reference INCOGNITO, SCACCIONI and PINTO2021), due to methodological limitations and research designs, the concept has not been free from criticism (Mehr et al., Reference MEHR, SCHACHNER, KATZ and SPELKE2013; Benz et al., Reference BENZ, SELLARO, HOMMEL and COLZATO2016; Swaminathan & Schellenberg, Reference SWAMINATHAN, SCHELLENBERG, Strobach and Karbach2016; Dumont et al., Reference DUMONT, SYURINA, FERON and VAN HOOREN2017; Sala & Gobet, Reference SALA and GOBET2017). Randomised controlled trials (RCTs), longitudinal studies and studies with active control groups may help to clarify a far transfer causal relationship, but due to high costs and intrusive intervention, they are still hard to perform.
In a meta-analysis of RCTs, longitudinal and control groups studies from 2001 to 2013 were assessed by Jaschke et al. (Reference JASCHKE, EGGERMONT, HONING and SCHERDER2013) with the Newcastle–Ottawa Scale (NOS) and their own Musiquas scale for evaluating the quality of non-randomised studies in meta-analyses. The participants included in the review were young children and preadolescents aged between 4 and 13 years who were learning an instrument or were not actively engaged with music (music listening or learning music theory). These studies revealed five main categories of transfer outcomes from music: reading, visuospatial reasoning, writing, mathematics and intelligence. Of the 72 studies analysed, that performed by Ho et al. (Reference HO, CHEUNG and CHAN2003) showed a negative transfer from music to intelligence, while Schellenberg’s (Reference SCHELLENBERG2004) showed a positive transfer effect. Transfer effects to mathematics and reading and writing were also found to be positive.
The strict methodological inclusion criteria of the study conducted by Jaschke et al. (Reference JASCHKE, EGGERMONT, HONING and SCHERDER2013) were not matched by others regarding the characteristics of the music intervention. As Swaminathan and Schellenberg (Reference SWAMINATHAN, SCHELLENBERG, Strobach and Karbach2016) point out, a fine-tuning of the inclusion criteria could help to clarify the causal relationship between music training and cognitive abilities. The characteristics of the music programme and those of the learners and the sociocultural context, among others, play a decisive role. To these characteristics should be added a clear active musical engagement, an active control group and a long-term participation in a music programme.
In Reference HALLAM2015, Susan Hallam published a systematic review of research on the impact of music practice on other domains which, albeit not a meta-analysis, is currently one of the most comprehensive in this respect, as it reviews studies that have an impact on a wide range of domains. The review includes research on frequently studied cognitive domains such as aural perception and language skills with subtopic phonological skills, literacy (reading, writing and spelling), aural and visual memory, visuospatial reasoning and mathematics, and intellectual development, executive functions and self-regulation or general attainment. It is also open to research in other areas which, although less studied than cognitive abilities, are just as important in the development process, such as creativity, music and personality, social cohesion and inclusion, empathy and emotional intelligence, personal development and self-belief, among others. The inclusion of such a wide and varied range of studies, methods and designs poses methodological problems, which Hallam herself points out in the conclusions section. Even so, these do not detract from the importance of the review because of its breadth and ability to focus and expand the discourse on the influence of music to other areas. The review concludes that, although many benefits may be derived from an active engagement with music, these are related to the quality of teaching and the age of initiation in music, as well as to social aspects, interactivity within the group and the motivation of the participants, thus stressing the considerable importance of the pedagogical aspects of music interventions.
In their meta-analysis, Sala and Gobet (Reference SALA and GOBET2017) inquired into the possible benefits of music training for academic and cognitive skills. It is interesting to note that in this study, as well as in a more recent one performed by the same authors (Reference SALA and GOBET2020), both cognitive abilities and academic achievement were still included and considered together for analysis as continuous concepts. Although correlated in most cases, cognitive abilities and academic achievement should be regarded as different concepts, since other variables, such as memorisation and motivation, concur in achievement tests (Cooper, Reference COOPER2020). The aim of Sala and Gobet’s (Reference SALA and GOBET2017) meta-analysis was to compare the overall effect size of the groups receiving music education compared to the control group and, more specifically, to determine whether music education enhances cognitive and academic skills and the impact of far transfer from music to non-musical domains, whether it improves some specific skills more than others, whether the age of students plays a role in the benefits of music education and, finally, whether the methodological quality of the analysed studies affects the results. Of the original 166 studies screened from 1986 to 2016, 38 met the established inclusion criteria. The meta-analysis also evaluated the role of four moderators: outcome measures (literacy, mathematics, intelligence, phonological processing and spatial ability); age; random allocation of participants to either the experimental or control group; and the presence of an active control group. Firstly, the results of this meta-analysis point to a small overall effect size, suggesting the limited or null far transfer of music to other cognitive abilities. Secondly, that music education seems to enhance intelligence and memory moderately, although without having any effect on academic achievement. Thirdly, that age is not a significant moderator. And, finally, that the quality of the study is inversely proportional to the effect size. In light of these results, the meta-analysis concludes that there is no consistent evidence of far transfer from music to cognitive abilities or academic achievement, and that there is a need for well-designed studies involving the random allocation of participants and an active control group.
In a recent meta-analysis, Cooper (Reference COOPER2020) hypothesised that music education might have a small to medium effect on cognitive abilities. The verbal and non-verbal cognition moderators, the laboratory setting, the natural environment, the active control groups and the type of music education experience may explain the different effect size. The studies analysed are experimental and quasi-experimental, among others, which only consider cognitive skills, while excluding academic achievement for being considered as unreliable. Other moderators included in Cooper’s meta-analysis were the quality and duration of music education, which reduced the selected studies to 21 with subjects in a 4- to 10-year age bracket. This meta-analysis seems to confirm that music education has a small to medium effect size on cognitive abilities, reaching a null effect in laboratory settings. Although the author concludes that music education is probably no more beneficial than any other type, he still defends it for its sociable and enjoyable aspects.
A meta-analysis on the influence of music on cognitive abilities (Sala and Gobet, Reference SALA and GOBET2020), taking into account the small effect size of previous meta-analyses of the benefits of music education on cognition (Gordon et al., Reference GORDON, FEHD and MCCANDLISS2015; Cooper Reference COOPER2020), analysed (a) the justified claims of recent studies, (b) the source of heterogeneity among these studies, and (c) the theory predicting positive effects on cognitive and academic skills. Only studies with the following characteristics were included: RCTs with demanding music education programmes; studies with at least one control group; studies with no music-related cognitive test or academic outcomes; studies with participants aged between 3 and 16 years; and, finally, studies with sufficient data for performing statistical calculations.
The meta-analysis screened studies conducted from 1986 to 2019, amounting to 54 with a total number of 6984 participants. Taking into consideration the limitations and recommendations of previous studies, the following moderators were assessed: baseline difference, randomisation, active or non-active control groups, age, outcome measures grouped into four categories (non-verbal ability, verbal ability, memory and speed processing) and the duration of the interventions. The results seem to suggest that there is an inverse relationship between study quality and effect size. According to this meta-analysis, random assignment and active control group studies have a null or near-zero effect size, whereas studies without active control groups and no random assignment have a small effect size. No other moderator seems to have an influence on the effect size. According to the authors, this meta-analysis confirms that there is no causal link between music education and improved cognitive abilities or academic achievement, and consequently no far transfer takes place from music education to other cognitive domains.
Compared to studies of the influence of music education on cognitive abilities, research in other areas is much less prolific, but not for that less important. From an early age, emotional and social aspects are an important component of musical experience. It has the power to construct and transform social realities in social interactions and the understanding of the emotional or affective dimension of interaction (Ilari, Reference ILARI2016). So, social and emotional learning (SEL) ‘involves a set of social, emotional, behavioural, and character competencies that are essential for success in school, in the workplace, in relationships, in the community’ (Varner, Reference VARNER2020, p. 74) and, accordingly, can be considered as a key competence which can be enhanced from a very early age through musical engagement (Ilari, Reference ILARI2016; Öztürk & Can, Reference ÖZTÜRK and CAN2020; Yanko & Yap, Reference YANKO and YAP2020; Campayo-Muñoz & Cabedo-Mas, Reference CAMPAYO–MUÑOZ and CABEDO–MAS2017; Soliveres et al., Reference SOLIVERES, GIRÁLDEZ-HAYES and PAREJO2021).
Due to the dearth of research, the recent study conducted by Blasco-Magraner et al. (Reference BLASCO-MAGRANER, BERNABE-VALERO, MARÍN-LIÉBANA and MORET-TATAY2021) claims to be the only meta-analysis performed to date on the effects of music in an educational setting on the emotional development of children aged between 3 to 12 years. The review was carried out following the indications of the Preferred Reporting Items for Systematic Reviews and Meta-Analysis (PRISMA), including studies conducted between 2000 and 2020 with children aged between 3 and 12 years, employing an empirical design and measures of the influence of music on emotions and socio-emotional skills. The 26 studies that met the aforementioned inclusion criteria were divided into 3 areas: 50% of the selected studies focused on emotional intelligence, with subtopics such as perception, appraisal and emotional expression and regulation; 42% on educational and formative benefits or how the emotional state induced by music may affect learning in the school environment; and, finally, almost 27% addressed the benefits of music in social-emotional areas such as social skills, empathy and the reduction of emotional problems by enhancing prosocial skills, sympathy, teamwork and tackling negative social-emotional attitudes. The review gathered evidence of the positive effect of music, both in passive music listening and active music participation settings, on the development of emotional intelligence in children aged between 3 and 12 years. The researchers also found that music had educational benefits in cognitive and academic domains, formative and socioemotional benefits in the shape of prosocial attitudes, sympathy and empathy, and reduced anxiety, depression and defiant attitudes.
Method
About the empirical study Footnote 2
As seen in the previous section, the underlying idea of education through music is the ability to influence different educational dimensions that, although independently and to different extents, concur together in child development. To interpret these unique characteristics, it is necessary to provide the idea of education through music with a theoretical framework that can help to explain the role of music in influencing child development domains. With his approach to intelligence, development and its role in educational settings, Gardner’s Theory of Multiple Intelligences (hereinafter MI) currently provides an effective explanatory and comprehensive theoretical framework grounded in empirical evidence (Shearer & Karanian, Reference SHEARER and KARANIAN2017). According to Gardner (Reference GARDNER1983), intelligence is not a single dimension common to all human beings, but rather consists of eight dimensions, or intelligences, present in all human beings in different measures, which define our intellectual profiles (linguistic, logical-mathematical, spatial, musical, bodily-kinesthetic, interpersonal, intrapersonal and naturalistic). To a certain extent, all these dimensions or intelligences can be modified and nurtured through education or, in this case, music education.
Unlike other disciplines, music offers a rich variety of characteristics that, combined with other activities, can be used in education to facilitate the development process through the effective influence on different domains or dimensions (Gardner, personal communication, April 29, 2021). Referring to these differential characteristics, Gardner (Reference GARDNER1998) gives what he calls more ‘affordances’, employing the term coined by Gibson (Reference GIBSON2014), to music than to other disciplines and, therefore, it can be a ‘privileged organizer of cognitive processes’ (Gardner, Reference GARDNER1998, p. 31). Working with music not only develops musical intelligence and makes people better musicians but, depending on how it is used, and in combination with other activities, due to its multimodal and multilevel characteristics, it can also help to nurture and develop other intelligences (Gardner, personal communication, April 29, 2021). Consequently, the settings and the educational process in which music is deployed, in case at hand that of the EMI project, become particularly important.
Accordingly, the aim of this study is to determine whether there is a statistically significant relationship between the EMI project, as a model implemented with all its structural and pedagogical features, and the dimensions defined by Gardner or, in other words, whether what children learn through the project spills over to the intelligences as theorised in Gardner’s MI theory. The specific objectives of this study are as follows:
-
To analyse the impact of the EMI project on MI indicators in preschool children.
-
To determine whether or not there are statistically significant differences between the experimental and control groups and, if so,
-
To measure the magnitude of those difference (effect size).
Design
This study is based on a quasi-experimental design with experimental and control groups and a single measurement at the end of the intervention (static group comparison). This research design was selected because it is the least intrusive with respect to the EMI project and possibly the best applicable to an ongoing project. It has three main characteristics (Harvey & Kent, Reference HARVEY, KENT and Frey2018):
-
1. The participants are not randomly assigned to experimental or control groups.
-
2. No measurements are taken prior to the intervention.
-
3. The experimental and control groups are measured at the same time.
The first two features are important design limitations and threats to internal validity. In point of fact, the differences between groups at the baseline (prior to treatment) may offer an alternative explanation for the outcome (Tan-Lei Shek & Wu, Reference TAN-LEI SHEK, WU and Frey2018). To reduce the sample bias, two criteria were followed when selecting the participants:
-
1. A large sample of participants in order to reduce variability and outliers.
-
2. The schools participating in the control group were selected to match the characteristics of the experimental group, thus achieving the maximum equivalence possible between the two groups. In order to do so, the Andalusian Agency for Educational Assessment (Agencia Andaluza de Evaluación Educativa, hereinafter AGAEVE)Footnote 3 was asked to select the control group from among schools of a size, location, socio-economic level, academic performance and participation in extracurricular activities similar to those of the schools in the experimental group.
Participants
The experimental group was made up of children aged between 4 and 5 years from all walks of life, attending public preschools located in different districts of the city of Seville (Alvarez-Dardet et al., Reference ÁLVAREZ-DARDET, GARCÍA, ROJAS, LARA, GARCÍA and HIDALGO2012). All the children in the experimental group participated in the EMI project for two and three preschool years, respectively, receiving, in accordance with the project, half an hour of music education daily during school hours, 4 days a week during each preschool year. The control group was made up of children aged between 4 and 5 years, attending public preschools and, in accordance with the regular school curriculum, receiving no extra music classes during school hours.
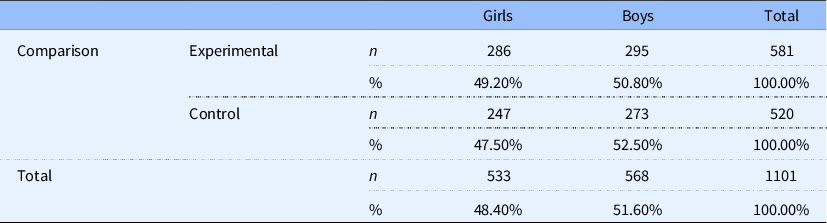
A total of 1101 children participated in the study, 581 in the experimental group and 520 in the control group. Table 1 shows the homogeneous distribution of participants according to their sex.
Participants by Sex and Group

Instrument
Based on Gardner’s MI theory, due to their different nature and their particular development, intelligences cannot be measured with standardised paper-and-pencil IQ tests. These tests measure abilities that are exclusive to linguistic or logical-mathematical dimensions. The best tool for evaluating the different intelligences, according to Gardner’s MI theory, is teacher observation and experience with children over a prolonged period (Gardner, Reference GARDNER2000). Therefore, recourse was made to an adapted questionnaire based on Armstrong’s (Reference ARMSTRONG2009), which measures teacher observation and experience with each student in the experimental and control groups. The questionnaire contained eight items corresponding to the eight intelligences of the MI theory (due to the large sample it was necessary to reduce the number of items of Armstrong’s original questionnaire), which were scored on a 10-point scale. Each item was accompanied by a legend explaining the eight items of Armstrong’s original questionnaire.
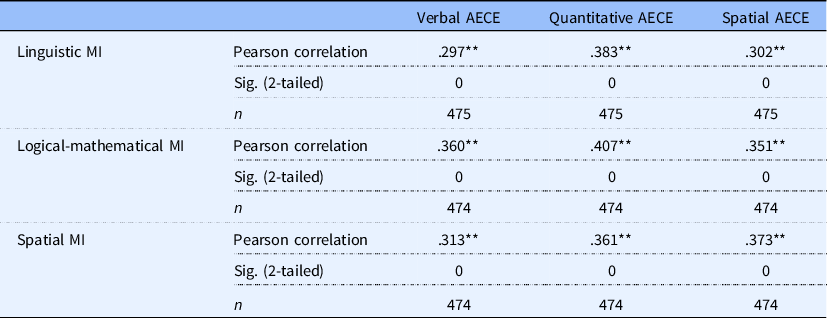
A reliability analysis of the eight dimensions obtained a very high Cronbach’s alpha score (.927), thus indicating a good internal consistency. Construct validity was calculated by performing a correlation analysis on the results of the MI questionnaire used in this study and the standardised paper-and-pencil IQ test, Aptitudes in Early Childhood Education (hereinafter AECE) (De la Cruz, Reference DE LA CRUZ2009), which measures three dimensions with the adapted Armstrong’s MI questionnaire: Linguistic MI = verbal AECE; Logical-mathematical MI = Quantitative AECE; Spatial MI = Spatial AECE. The correlation table is shown (see Table 2).
Correlation between the MI Questionnaire and AECE

**Correlation is significant at the 0.01 level (2-tailed).
Procedure
After the initial contact with the schools, an appointment was arranged to present and explain the objectives and procedures of the study. Paper questionnaires were distributed with the informed consent forms to be signed by the families. The Ethical Review Board of the University of Seville approved the study and its procedures. The experimental and control groups were tested in both Armstrong’s adapted MI and AECE questionnaires. The adapted MI questionnaire was scored on a 10-point scale by the class teachers, while the AECE questionnaire, designed with pictures, was completed by the children themselves with the help of their teachers and the EMI project’s data collection assistants. The positive correlation between the two instruments shows that the teachers in the experimental group did not respond in a biased way to the questionnaire due to their expectations for the EMI project.
Data analysis
The following data analyses were performed using the SPSS-25 statistical programme:
-
An exploratory examination of the MI dimensions to compare the means of each one in the experimental and control groups, to determine the 95% confidence interval for the means of each group and to identify and compare the ranges of the confidence intervals of all the groups.
-
Once the difference between the means had been determined, Students’ t-tests were run on independent samples to ascertain whether or not there were any statistically significant differences between the control and experimental groups. A statistical significance of 5% was required.
-
Finally, a Cohen’s d test was conducted to measure the size of the difference between the means.
Results
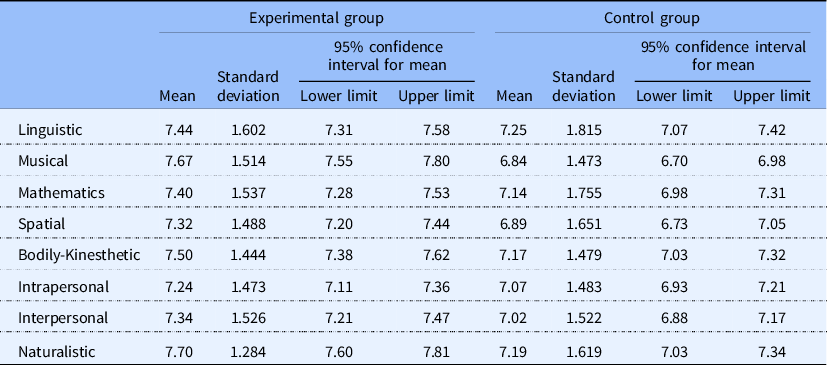
As can be seen in Table 3, the comparative exploratory analysis of each of the dimensions in the experimental and control groups reveals indices with greater means in the experimental group dimensions than in those of the control group.
Means and Confidence Intervals of the Dimensions According to Experimental and Control Groups

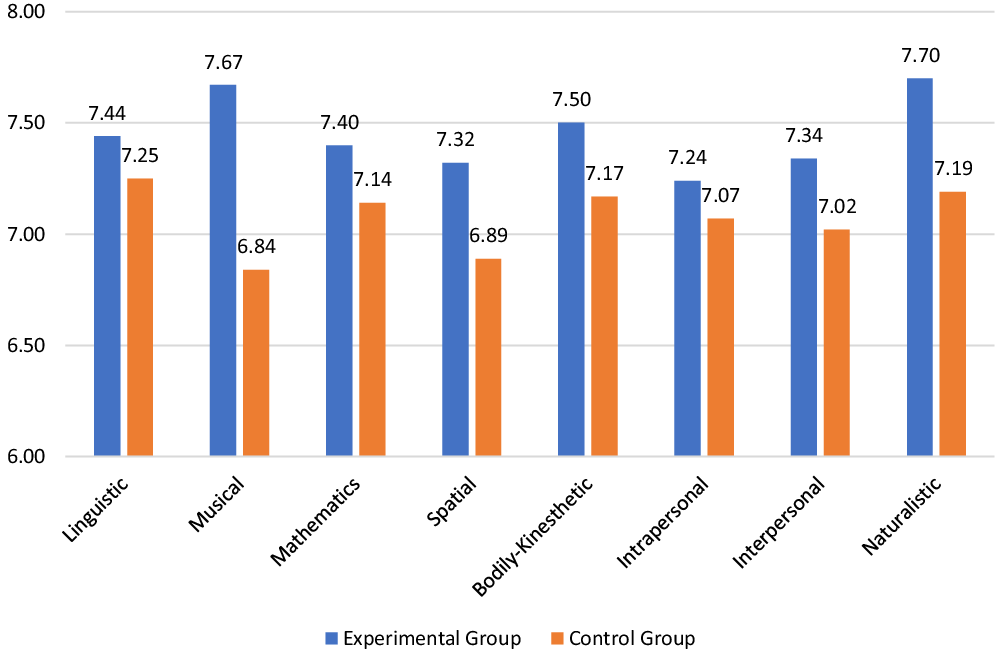
Figure 1 shows the mean differences between the experimental and control groups.
Mean differences between the experimental and control groups.

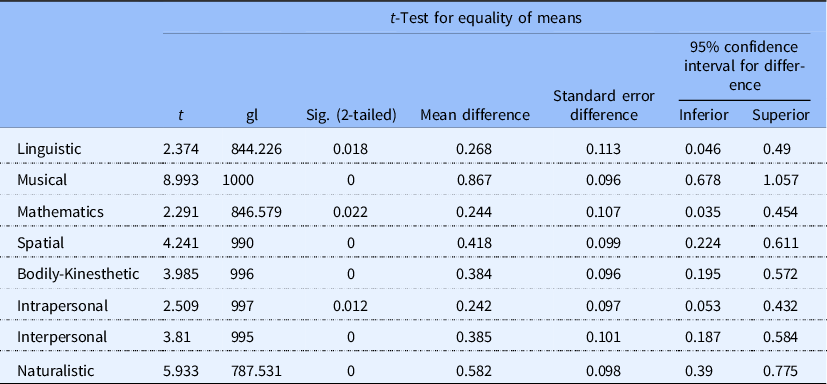
To determine whether or not there were any statistically significant differences between the means, a Student’s t-test was performed on independent groups (see Table 4). Footnote 4
Analysis of the Differences between the Experimental and Control Groups in the Eight MI Dimensions

As can be seen in Table 4, all the intelligences have a p-value of < 0.05, with the experimental group levels being higher than those of the control group. Therefore, the null hypothesis can be rejected, as there would be no statistically significant differences between the experimental and control groups (equality of means) and the alternative hypothesis accepted, while confirming that there were statistically significant differences between the experimental and control groups.
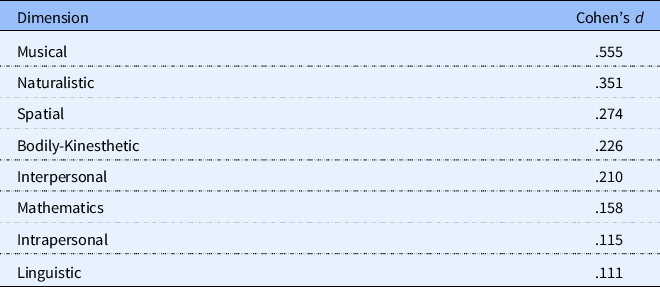
The following Table 5 shows the results of the analysis of Cohen’s d effect size calculated according to Lenhard and Lenhard (Reference LENHARD and LENHARD2016), with the interpretation of Cohen’s intervals (Reference COHEN1988) and following the revision of Sawilowsky (Reference SAWILOWSKY2009): d (.1) = very small effect, d (.2) small effect and d (.5) medium effect.
Effect Size

In ascending order, the effect size of the dimensions was as follows: linguistic, intrapersonal, mathematics (very small effect); interpersonal, bodily-kinesthetic, naturalistic (small effect); and musical (medium effect).
Discussion and conclusions
The results of this study reveal statistically significant differences between the means of each of the dimensions of the experimental group and the corresponding ones of the control group. This confirms the hypothesis that the EMI project has a positive impact on the different dimensions, in accordance with Gardner’s MI theory. Furthermore, the different impact of the EMI project on each one of the dimensions (differences in effect size) is consistent with the results of previous studies showing that music education does not affect equally each of the different dimensions analysed (Weber, Spychiger, & Patry, Reference WEBER, SPYCHIGER and PATRY1993; Bastian, Reference BASTIAN2000; Hallam, Reference HALLAM2015). Also, the very small and small but statistically significant effect size is consistent with evidence from recent meta-analyses of cognitive skills (Jaschke et al., Reference JASCHKE, EGGERMONT, HONING and SCHERDER2013; Sala & Gobet, Reference SALA and GOBET2017, Cooper, Reference COOPER2020, Sala & Gobet, Reference SALA and GOBET2020). On the other hand, and due to the heterogeneity that can be observed in the conclusions of the few specific studies that have been performed to date on the influence of music on the social and emotional dimensions, it is impossible to draw consistent conclusions in this study regarding the influence of music on these two dimensions.
Although definitive evidence cannot be offered, the most striking aspect of this study is that these dimensions are closely related to the characteristics of the EMI project, namely, the format and structure of the project and the context in which it is being run. The environment and circumstances in which each project is developed, as well as the purposes and different uses of music as a tool for its implementation, are variables that affect the results and, therefore, should be taken into account (Rauscher et al., Reference RAUSCHER, SPYCHIGER, LAMONT, MILLS, WATERS and GRUHN1998; Hallam, Reference HALLAM2015; Swaminathan & Schellenberg, Reference SWAMINATHAN, SCHELLENBERG, Strobach and Karbach2016; Jaschke, Reference JASCHKE2019; Gordon et al., Reference GORDON, FEHD and MCCANDLISS2015; Cooper, Reference COOPER2020; Sala & Gobet, Reference SALA and GOBET2020). Music per se does not have a consistent ability to influence child development (this hypothesis may shed light on the controversial claims about the so-called ‘Mozart effect’ studies), but the way we use it for an educational purpose may make the difference. The pedagogical conclusion that we can draw is that non-musical domains can be enhanced through active musical engagement, not as casual by-products of it, but with attentive musical programing aimed at their enhancement. In fact, the music education class could expand its objectives by introducing musical activities carefully designed to support the development of non-musical dimensions. This approach supports Gardner’s claims about the aforementioned ‘affordances’, or the multimodal and multilevel characteristics of music, and its implications for music education planning.
Our results are insufficient to infer a conclusive causal relationship between the EMI project and the dimensions of MI. A more in-depth and specific analysis, including sex, geographical location and socio-economic and cultural settings as independent variables, would be required to assess the variability of the effectiveness of the EMI project on child development in different socio-economic and cultural settings, as well as a more rigorous research design with the following features, necessary to obtain more solid evidence: the random assignment of participants, a baseline test, an active control group, demanding musical engagement and the duration of the musical intervention.
Viewed from a broader perspective, the results of our study support the importance of music education in child development and, by extension, the need to continue to invest in it from an early age as a core subject in school curricula. The importance and effectiveness of education through music lies in the ability of music to offer multiple and different levels that, depending on how they are used, can influence different dimensions of child development.