1. Introduction
In developed countries, high demand for environmental protection can lead to high-cost policies, especially when coupled with distortionary policies that occur through trade restrictions rather than more efficient instruments, due to their political exigency (Anderson, Reference Anderson1995). In the context of the United States, economists have estimated the costs of several policies including the Clean Air Act (Greenstone, Reference Greenstone, List and Syverson2012); the Arctic National Wildlife Refuge (Kotchen and Burger, Reference Kotchen and Burger2007); the protection of the Spotted Owl (Montgomery et al., Reference Montgomery, Brown and Adams1994); and EPA pesticide regulation (Cropper et al., Reference Cropper1992). Arrow et al. (Reference Arrow1996) suggest that benefit-cost analysis has a crucial role to play in the creation and evaluation of environmental regulations, and therefore these cost estimates contribute to our understanding of regulation generally. This same logic can apply to the context of a developing country. Regulation in developing countries can reduce growth or provide significant net benefits to consumers, depending on the relative costs and benefits (Guasch and Hahn, Reference Guasch and Hahn1999).
In this paper we estimate an environmental policy cost in the context of a developing economy – water trading restrictions in northern Chile. We focus our estimate in a partial-equilibrium setting on the ‘direct compliance cost,’ as categorized by Pizer and Kopp (Reference Pizer, Kopp, Maler and Vincent2005). In doing so, we are conscious of Davies (Reference Davies1997) note of caution in evaluating regulatory costs in developing countries: ‘Many regulatory problems entail an asymmetry, with the impact on a large and diffuse group being evaluated against that on a small, more cohesive one… Economic measures of the value of time, of health and of life itself are likely to be low for the poor, and efficiency assessments are therefore likely to place a low value on regulations designed to save their time or lives or improve their health.’ This concern is relevant, as the regulation in question is intended in part to provide water for the developmental and cultural needs of indigenous populations, and the regulatory burden falls primarily on a small group of mining firms. While the valuation of policy benefits is beyond the scope of our work, we discuss the nature of the policy benefits in detail in the discussion section.
Chile's water code generally allows for unregulated trading of water rights (Hearne and Easter, Reference Hearne and Easter1995; Bauer, Reference Bauer1998; Hearne and Donoso, Reference Hearne, Donoso, Easter and Huang2014).Footnote 1 However, Chile's growing income has increased demand for environmental amenities, which are not well defined in the private right system (Hearne, Reference Hearne, Easter, Rosegrant and Dinar1998) and the impacts of the initial water right assignments on indigenous communities remain unresolved (Prieto, Reference Prieto2016). In the hyper-arid Antofagasta Region of northern Chile, which produces 17 per cent of the world's copper supply (Cochilco, 2014), these issues have led to a change in policy by the water regulator, the Dirección General de Aguas (DGA). The DGA has denied mining firms in the region the ability to use purchased agricultural water rights in mining operations in order to protect water access for small, indigenous farming communities and regional wetland ecosystems. Mining firms have responded by shifting water input to the desalination and pumping of seawater, which must be pumped as far as 150 km (93 miles) to altitudes over 3,000 m (9,800 feet) above sea level. The cost of desalinated water is substantially higher than the observed market price of water in local agriculture, and the generation of energy for both desalination and pumping releases greenhouse gases.Footnote 2
We use a dataset of water right transfers, available in Chile due to a unique reporting requirement equivalent to that required for real estate sales, to estimate the policy cost. Ideally, we would like to compare the willingness-to-pay of agricultural water users with mining users using actual market transactions. Unfortunately, the policy change induced mining firms to shift to desalinated water. To estimate mining willingness-to-pay, we develop cost estimates for the desalinated water projects undertaken after the implementation of the trade restrictions. We do observe the market price in the regulated market, which we use to estimate agricultural willingness-to-pay. We then simulate the transfer to mining firms of water currently in use in agriculture. Doing so allows us to estimate that the direct cost of this policy is US$52 million per year. These costs are primarily borne by mining firms, whose gross revenues from the region in 2015 were around US$11.8 billion.Footnote 3
While a great deal of attention has been paid to the costs of environmental policy, this work typically examines regulation that affects production directly. There has been less analysis of the cost of environmental regulation of input markets where final product costs are more difficult for consumers to detect. This paper contributes to the literature by: (i) providing a methodology for estimating the cost of potential market transactions that are lost due to regulation; (ii) estimating the cost of environmental regulation in the context of a developing country; and (iii) estimating the costs associated with water transfer regulation. Estimating the benefits of the policy is beyond the scope of the current work, but cost estimates do provide a baseline, indicating what value benefits must exceed to have a benefit-to-cost ratio greater than one.
The organization of the paper is as follows. In section 2 we explain the Chilean setting and how water is traded and regulated. Section 3 explores the regulatory effect on market prices. Section 4 develops a methodology and estimates the deadweight cost of the policy. Finally, section 5 is a discussion of the results, including a discussion of the benefits of the policy. Supplementary materials are provided in an online appendix.
2. Background
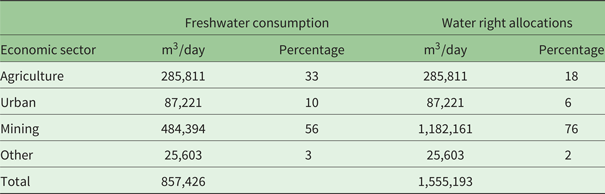
Water allocation in the Antofagasta region of Chile has become a contentious policy issue due to the coincidence of low precipitation, less than 5 mm per year, and high demand. The mining sector, accounting for around 50 per cent of US$21.5 billion in regional GDP in 2016, requires significant water input for ore production and processing. The local agricultural sector retains rights to a significant portion of the region's water while producing less than US$6 million in output annually.Footnote 4 Although the agricultural sector holds 18 per cent of water rights, it accounts for 33 per cent of freshwater consumption. The mining industry holds 76 per cent of water rights but consumes 56 per cent of freshwater. The discrepancy is due to the restrictions imposed on the use of water rights by mining firms. Because many water rights owned by mining firms are not used, the proportion of actual water use in agriculture is higher. Table 1 shows the estimates of water consumption and rights held by sector.

Mining freshwater is obtained from surface dams and groundwater pumping in the Andean highlands above the seeps and diversion points that feed wetlands and provide water to indigenous villages. As a result, mining water extraction has reduced water tables and surface flows, leading to declines in arable land and wetlands. According to Romero et al. (Reference Romero, Méndez and Smith2012):
Environmentally, Andean wetlands are also essential components of the regional hydrological cycle, and concentrate biodiversity and environmental services in the border or in the middle of the desert. They have offered permanent native grasses and allowed the development of agricultural crops. These crops have sustained ancestral village settlements made up of indigenous communities, for whom land and water are indivisible goods, with high economic, social, cultural, and spiritual values. Historically, mining has exploited surface water bodies, whose depletion and overexploitation have reduced availability and dramatically affected ecosystems and local communities.
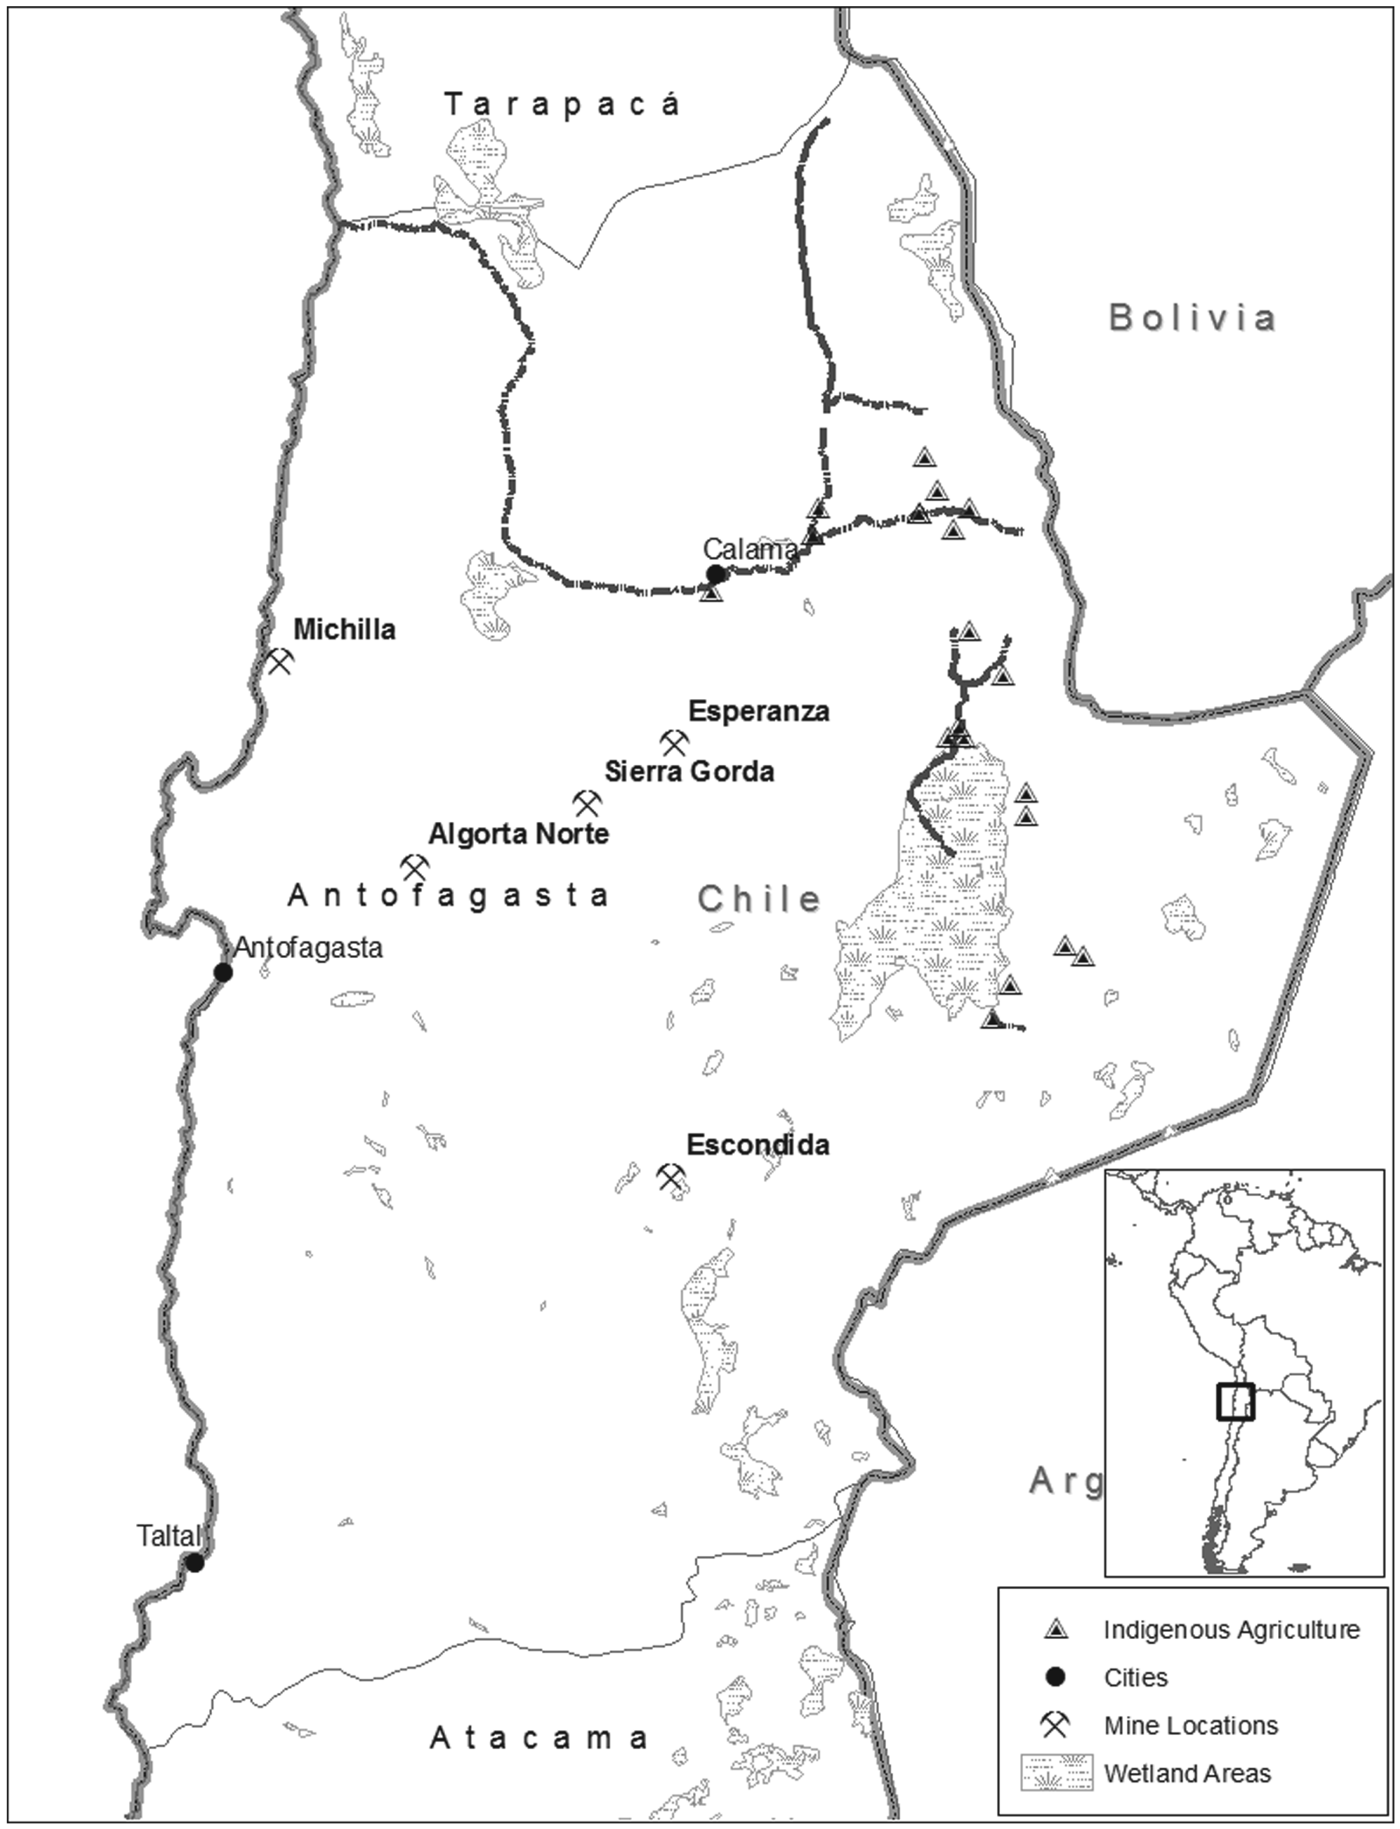
Regional wetlands encompass an area of 6,904 hectares, around 0.05 per cent of total land area, and provide important habitat for many species, as well as being linked to traditional agricultural lifestyles (Centro de Ecología Aplicada, 2011: 54). Approximately 2,000 hectares of irrigated land, out of a total of 12.6 million hectares in the Antofagasta Region, allow indigenous communities to engage in traditional agriculture. Mining diversions reduce the water available for ecological production and agriculture. Figure 1 shows a map of the region and includes the locations of major mines. The figure also shows the main local water source for the region, the Loa River, which forms a ‘U’ near the border with the Tarapacá region. The small triangles represent the approximate locations of indigenous agriculture and nearby principal wetland sites, although only a portion of the mapped areas are active wetlands.Footnote 5 Mines extract water above these areas and pipe the water to the mines.
Map of northern Chile's Antofagasta region. Notes: Authors’ drawing with data from ESRI and Red Hidrográfica; City and mine location information coded by the authors.

The indigenous population is primarily not located in the small, rural communities, but in the urban areas, and preferences across this population for environmental and indigenous policies are heterogeneous. Data from the Chile National Socioeconomic Characterization Survey (Ministerio de Desarrollo Social, 2015) show that there are 20,820 employed indigenous persons in the region, with 706 (3.4 per cent) working in agriculture and 4,853 (23.3 per cent) working in the mining sector. Both sectors make up a larger portion of the indigenous workforce than of the non-indigenous workforce, 0.53 per cent and 18.6 per cent respectively, and the large difference in agriculture suggests more sensitivity to the indigenous workforce to changes in agricultural employment. To date, there has been little discussion of the effect of DGA policies on mining sector employment, perhaps because regulatory costs affect profitability but not demand for employment or the causal link is less clear.
The allocation of water is determined by the country's 1981 water code, which established tradable water rights that were separable from the land. The original water code included few environmental controls (Bauer, Reference Bauer1997; Mentor, Reference Mentor2001), and rights to environmental amenities associated with in situ water use were not defined statutorily (Grafton et al., Reference Grafton2011).Footnote 6 In the Antofagasta Region, the period after the adoption of the water code in 1981 was characterized by rapid development of water resources by mining firms with little regard for larger externalities. Water infrastructure projects focused on providing water for mining rather than local or wetland uses (Humberto Peña, personal interview conducted March 23, 2011). Downstream from mining and agricultural diversions, streamflow in the Loa River, the main water source in the region, decreased by two-thirds from 1961 to 1990.Footnote 7
Buyers and sellers in the water market fall broadly into three categories: agricultural, mining, and government. Agricultural buyers and sellers are individual irrigators transacting in the market for water rights to irrigate small fields. Mining buyers and sellers are firms engaged in mining or industrial activities and their direct use of the water is typically in ore extraction and processing and related services. Governmental buyers and sellers are communities as well as the national government.Footnote 8 Indigenous communities buy water rights through the national Fund for Indigenous Lands and Waters to preserve their community's access to water, and are therefore classified as governmental buyers even though the water's ultimate purpose is typically agriculture (World Bank, 2011).
After Chile's return to democracy in 1990, a rapid expansion of mining occurred in the region, driven by investment by large multinational mining firms, both Chilean and foreign-owned. Private firms began to acquire additional water rights in the market to increase production, especially as copper prices rose in the mid-2000s.Footnote 9 After a water right sale is complete, a mining firm applies to the DGA to transfer the right to a new use and extraction point under the water code and environmental law (Chilean Law 19.300). In the mid-2000s these reviews led to the rejection of several change-of-use or change-of-extraction-point applications. While mining firms still held the water right, they were forbidden from using the water for mining. For example, the mining company Minera Quadra bought underground water rights in 2008 in the Pampa Llalqui, 30 km from Calama, for around US$40 million, but has not received permission to use the rights for mining.
The rejection of change requests by the DGA had a significant effect on the market for water rights. As trade restrictions limited mining purchases from agriculture, firms turned to desalination and the transport of water from sea level to remote mines (Cristi, Reference Cristi2014). Mines vary in their distance from the coast and elevation above sea level. The highest cost desalinated water is that delivered to the Escondida mine, 150 km (93 miles) inland at an altitude of around 3,200 m (9,800 feet) above sea level. Because the cost of desalinated water is substantially higher than the observed market price of water in local agriculture, this policy is potentially costly.
The remainder of the paper estimates the cost of the policy. First, we perform an econometric analysis on recorded water right transactions, from which we arrive at a point estimate for the price of an agricultural water right. Second, we parameterize a simulation model of the deadweight cost of the policy using the water right transfer data as well as data on desalination costs.
3. Trading restrictions
3.1 Water transfer data
A dataset of surface water transfers was constructed by the authors from records in the Loa River basin of the Antofagasta Region from 1995 to 2014, the full time period for which data are available.Footnote 10 Transaction records are compiled by the Superintendencia de Servicios Sanitarios for use in setting water rates to urban customers. Records were obtained for the ‘Official Database’ used for rate setting, which eliminates trades beyond the Loa basin, those with missing water price data, exchanges involving land and buildings where water is bundled in the transaction, groundwater transfers, and trades among family members. The final dataset consists of 534 surface water transfers for which information is available on the date, buyer, seller, quantity transacted, and the price at which the transfer occurred. Buyer and seller types were classified into one of three categories – mining, agriculture, or government – described above. When the transacting party was an individual's name or a series of names, the party was classified as agricultural. Mining classification occurred when the name of the transacting party contained Ltda., Ltd, or S.A., indicating a business, or the name directly referenced a known mine, mining firm, or a company associated with mining. Government classification occurred when the transacting party's name references a community, or local or national agency.Footnote 11
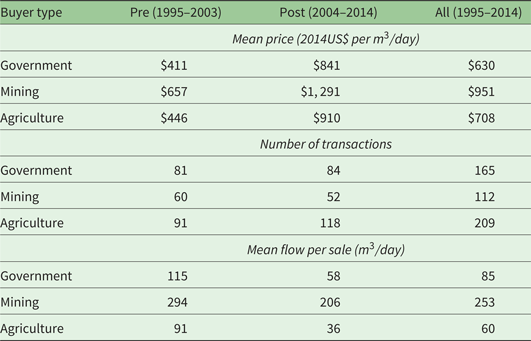
To simplify the analysis, we look at trades in three categories encompassing 91 per cent of recorded water transactions: agriculture-to-mining, agriculture-to-agriculture, and agriculture-to-government. As the high-value users, mining firms have been active buyers of water rights but not sellers. Similarly, government entities have been buyers. By limiting the sellers to agriculture we are able to examine the effect of buyer type on sales from a single sector. Overall summary statistics on prices, volume, and number of transfers are provided in column 4 of table 2. Prices are for a permanent transfer and are given in flow units. Throughout the paper water prices are expressed as a right to a cubic meter of water, every day, in perpetuity: dollars per m3/day.Footnote 12
Surface water sale summary statistics

Notes: Authors' calculations from transfer data.
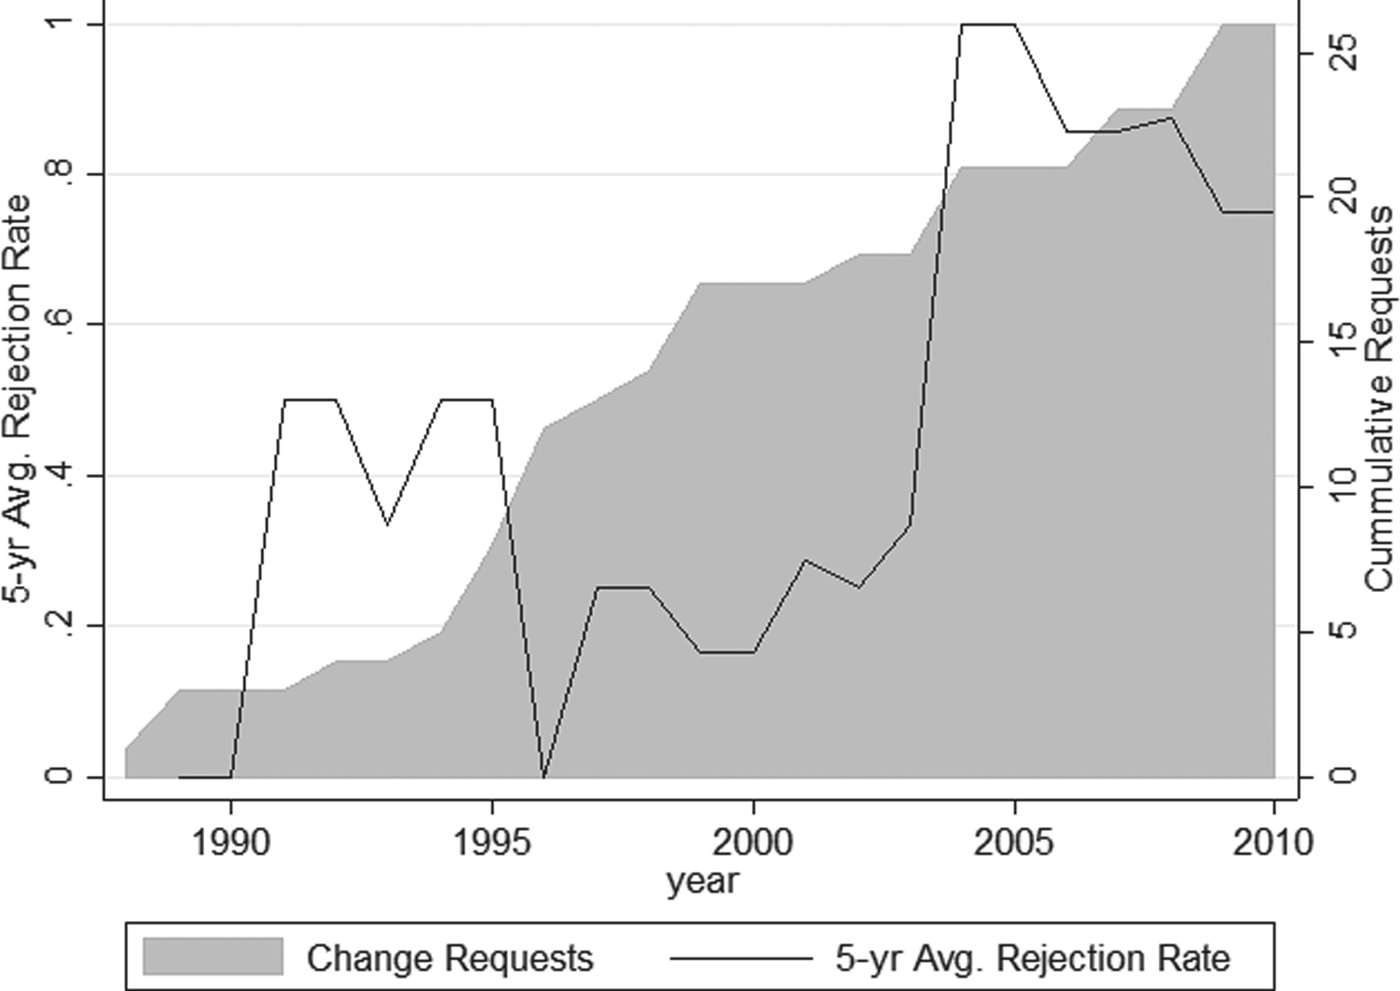
We use the available data from the Catastro Público de Aguas of the DGA regarding DGA reviews of surface water right transfers in the Calama region to understand how these reviews may have affected the market. In figure 2, the shaded grey area shows the cumulative number of requests for water transfers reviewed by the DGA, by the date submitted. The rejection rate is a five-year average of the percentage of reviews that were rejected or withdrawn, by the date a decision was made. Only one application for a change in surface water was approved after 2003. From February 2003 to July 2004, five surface transfers representing 46 per cent by volume of water transfer requests submitted up to that date were denied.
Water right change requests and change rejection rate. Note: Authors’ calculations from data on rejections collected from the Catastro Público de Aguas of the DGA.

Because of the change in the rate of regulatory denial in 2003, table 2 displays summary statistics through-2003 and post-2003 as well as for the entire period. Throughout the sample period, mining firms appear to pay more for water on average than do agricultural and government buyers. This may be indicative of mining firms selecting rights to purchase that differ based on properties unobservable in the dataset.Footnote 13 The summary statistics are consistent with a post-2003 change that constrained the supply of agricultural water rights available for purchase by mining firms. The average volume transferred for all purchasers decreased from the pre- to post-2003 period. Further, despite there being two more years in the post-2003 period, the overall number of transfers to mining dropped from 60 to 52. Prices and means for the summary statistics table were calculated using the price per m3/day. However, the distribution of the log of prices has a more symmetric distribution, as seen in the online appendix figure A2. For this reason the transformed prices are preferred for statistical analysis.
3.2 Econometric approach
We estimate a regression equation to find the price paid when both buyer and seller are agricultural users, as well as to examine the effect on water right prices of the 2003 increase in regulatory rejections on different classes of transacting parties. We define an indicator variable such that I R=1 when time t>2003 and I R=0 otherwise. The price of a water right, j, per unit (a perpetual right to one cubic meter per day) is P j. We regress the log of P j on indicators of buyer type, I q, where q={M, G}, so that I M=1 for a mining buyer, and I G=1 for a government buyer, and both are 0 for an agricultural buyer. Generally, our empirical specification takes the form:
 $$\hbox{ln}(P_{\rm j}) = \alpha +\gamma I_R + \sum\limits_{q\in \{M,G\}} \lambda_q I_q + \sum\limits_{q\in \{M,G\}} \delta_q I_R \cdot I_q + u_{\rm j}.$$
The expected log value of an agricultural water right post-2003 when the seller and buyer are agricultural is α + γ. This log price is distributed N(α + γ, σ 2). We observe the coefficient estimates,  $\hat{\alpha}$ and
 $\hat{\gamma}$, and the robust standard error estimate of their linear combination,
 $\hat{\sigma}_{\rm n}$. The λ coefficients indicate the extent to which mining and governmental buyers, relative to agricultural buyers, paid higher prices to agricultural sellers, prior to 2003, while the δ coefficients indicate whether this difference changed for rights purchased after 2003. These coefficients provide some indication of whether non-agricultural buyers paid higher prices for water rights. To better isolate the δ coefficients, we use a year dummy to control for year-to-year variation in water right price in one specification.
3.3 Econometric results
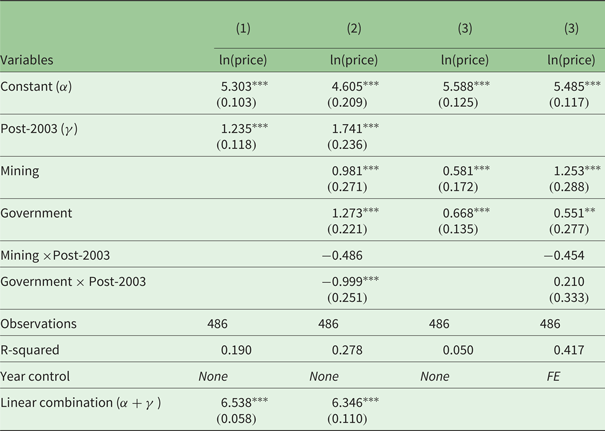
We run the regression from equation (1) to estimate the agriculture-to-agriculture transfer price,  $\hat{p}$. The results are shown in the first two specifications in table 3, where we estimate the 2004–2014 average price of agricultural water: specification (1) regresses the log of the water right price on an indicator for post-2003; and specification (2) includes controls for differential prices for government and mining purchases both before and after 2003. Both specifications arrive at similar estimates for
 $\hat{p} = \hat{\alpha} + \hat{\gamma}$, the mean price post-2003. Using the estimate from (2) we find that the joint estimate of
 $\hat{\alpha} + \hat{\gamma}$ is 6.346 and
 $\hat{\sigma}_{\rm n}$ is 0.110. Transforming our estimates to dollars, the mean price is around US$574. We construct a 99 per cent confidence interval for
 $\hat{p}$ of (US$264, US$1,247).Footnote 14
Regressions of price of water sold by agricultural users on buyer type

Notes: Regressions of log of per unit water transfer price from agriculture sellers on indicators of buyer type and post-2003 dummy for years 1995–2014. The sum α + γ represents the average log of the post-2003 agriculture-to-agriculture transfer price. Robust standard errors in parentheses. ***p<0.01, **p<0.05.
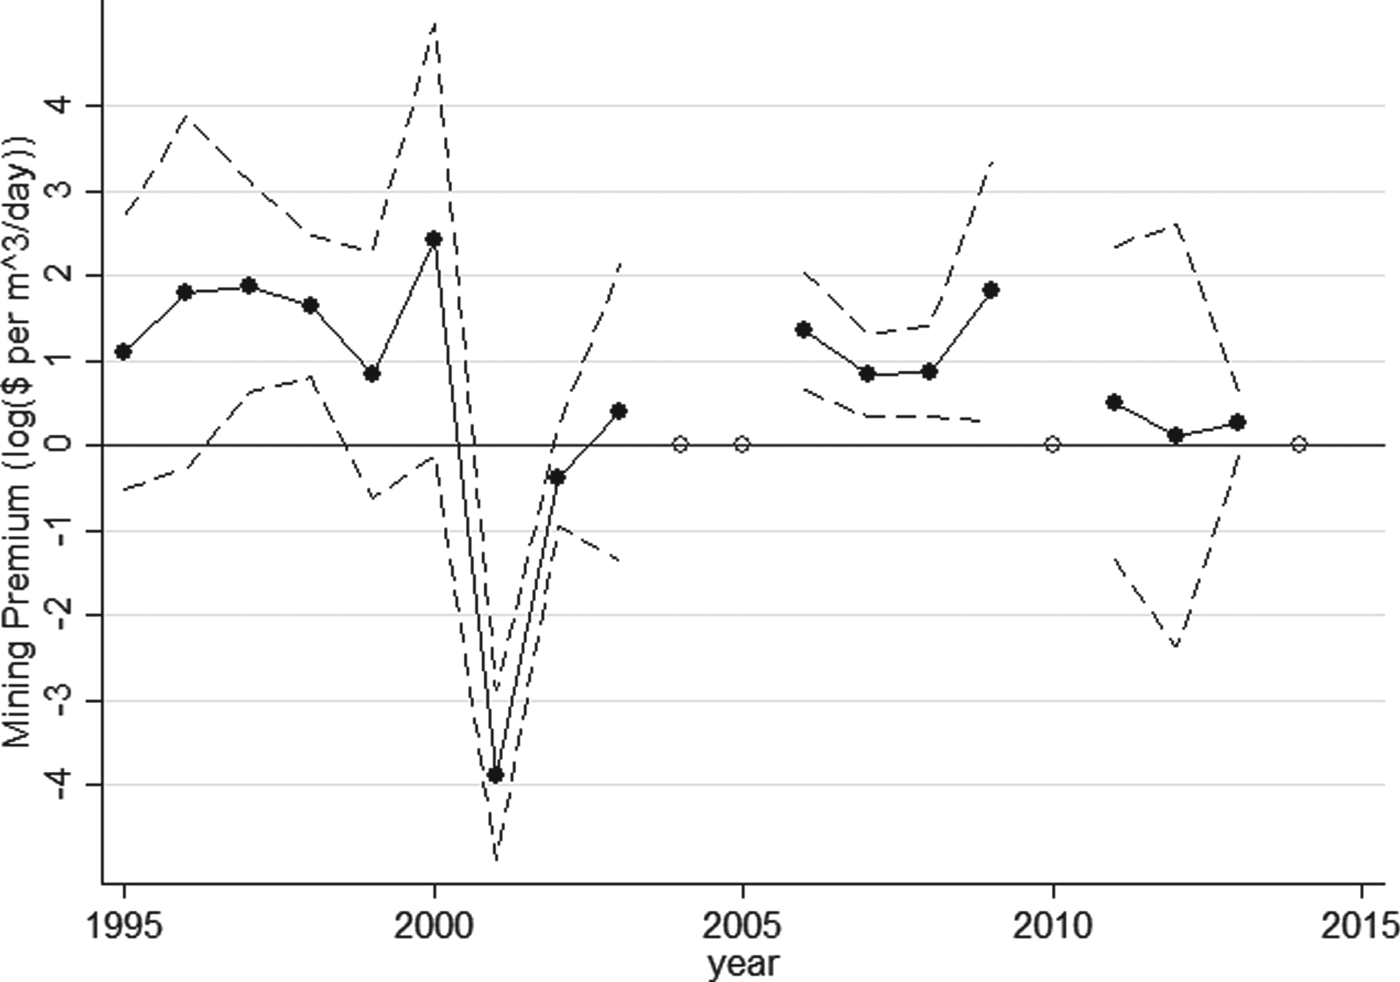
We now turn to analysis of the mining price premium through time. There is a two-year hiatus of mining water right purchases after 2003 as well as zero recorded purchases in 2010 and 2014. This result is consistent with our understanding that the number and volume of mining rights purchases decrease after 2003.
Turning to statistical analysis, results from equation (1) are shown in table 3. Specifications (1) and (3) look at the mining and government price premiums for the entire sample period, while specification (2) looks at premiums before and after 2003, and specification (4), which includes a year dummy to control for variation in a given year across trade types, only looks at the post-2003 premium. For the entire period, mining firms pay more on average for water rights. It may be the case that firms can select quality or regulatory attributes of rights that are unobserved in our data set, causing their purchases to occur at higher price levels. However, after controlling for year fixed effects in (4), it is not apparent that post-2003 the price premiums change relative to what they were during the pre-2003 period. When mining firms do purchase water post-2003, they pay a price premium similar to what they paid prior to 2003 – still significantly less than the desalination costs they concurrently undertake. We conclude from this that mining willingness-to-pay cannot be estimated using market transactions. Figure 3 plots the results of regressions showing the yearly premium paid by mining buyers relative to agricultural buyers. The specification used for this figure and coefficient estimates are shown in online appendix table A1. We describe an alternative estimation approach using estimated desalination costs in the next section.
Mining price premium relative to agriculture. Notes: This figure shows the coefficient and 95% confidence intervals for the price premium paid for purchases by mining buyers relative to agricultural buyers in each year. The open points indicate years when agricultural purchases occurred but mining purchases did not. Results used to generate this figure are reported in table A1.

4. Deadweight loss
4.1 Simulation approach
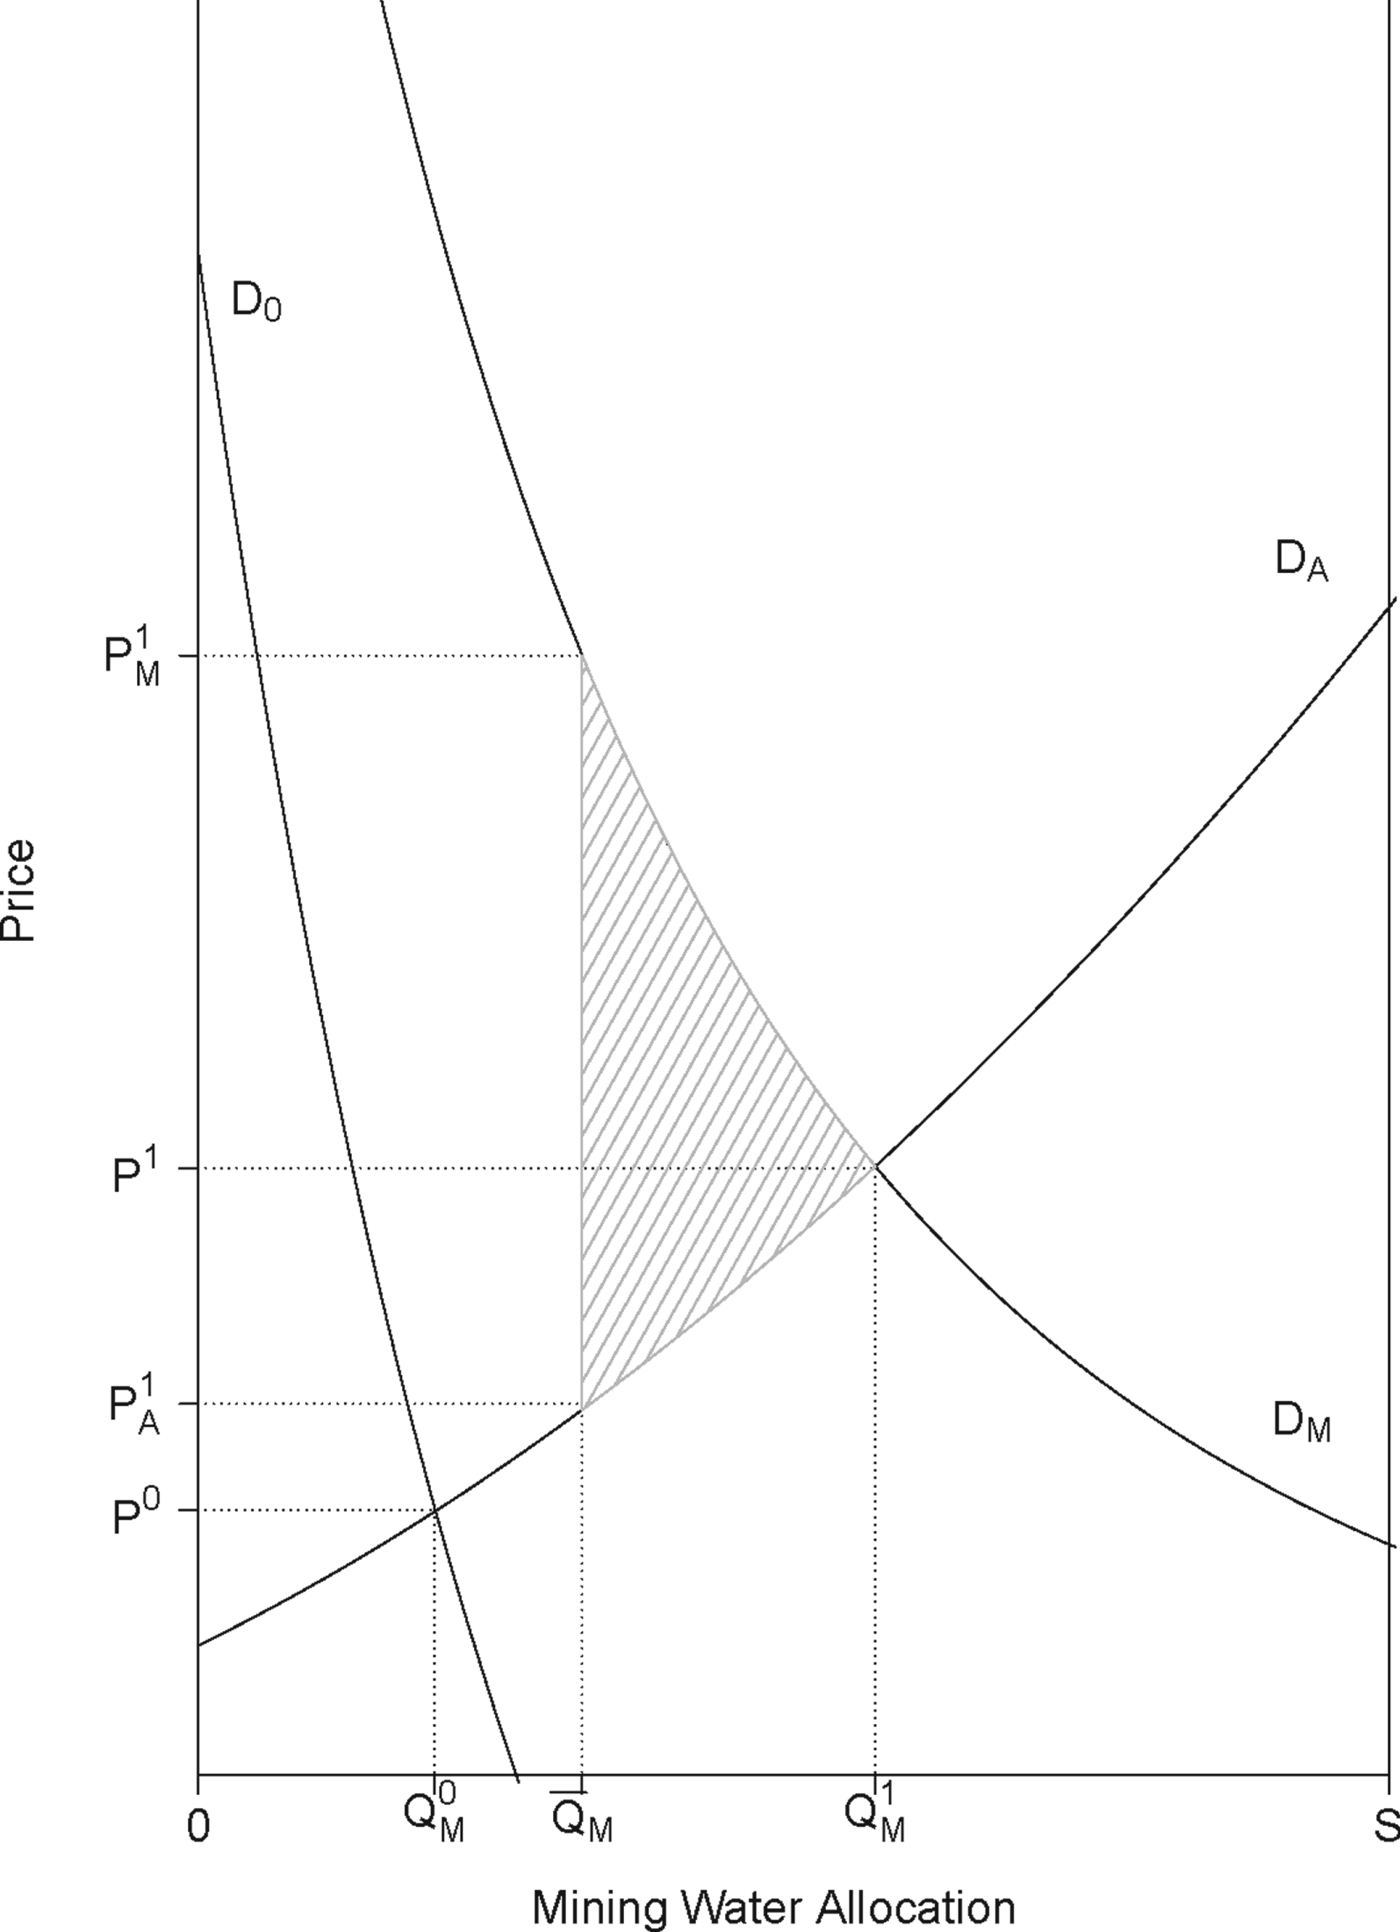
Similar to Griffin (Reference Griffin2006, 40), we examine a simplified setting via a two-sector model, where the supply of water is S, and this water can be used for two purposes, mining or agriculture, as illustrated in figure 4 with price on the y-axis and the amount of water in mining, Q M, on the x-axis.Footnote 15 We define the initial inverse demand curve for water in mining as D 0 (P)=Q M and for water in agriculture as D A (P)=Q A. Initially, mining demand is low and the market clears. Because Q M+Q A=S, the condition for the market clearing is  $D_{A}^{-1} (S - Q_{M}) = D_{0}^{-1} (Q_{M}) = P^{0}$.Footnote 16
Surface water demand and gains from trade.

When demand for water in mining increases, represented by demand shifting to D M (P), regulatory restrictions are put into place, enforced via a rationing rule. We assume that the regulatory rule assigns a subset of the water that has been freely transferred to mining firms,  $\bar{Q}_{M}$. This leaves
 $S - \bar{Q}_{M}$ water in agriculture. Now two prices emerge,
 $P_{M}^{1} = D_{M}^{-1} (\bar{Q}_{M})$ and
 $P_{A}^{1} = D_{A}^{-1} (S - \bar{Q}_{M})$. The price of rights that can be transferred to mining must be at least as valuable as those that cannot be moved from agriculture,
 $P_{M}^{1} \ge P_{A}^{1}$.Footnote 17 Without the transfer restrictions, the market clearing price would satisfy D A−1 (S−Q M)=D M−1 (Q M)=P 1, with the resulting amount of water in mining D M (P 1)=Q M1.
The shaded area in figure 4 represents the lost trade surplus as a result of the regulatory restriction on water markets. To find this area, which represents the cost of the policy, C, we integrate between the demand curves:
 $$C = \int\limits_{\bar{Q}_{M}}^{Q^{1}_{M}} [D_M^{-1}(Q)-D_A^{-1}(S-Q)]dQ.$$
Simulating the gains from allowing additional trades from agriculture to mining requires estimating D M and D A, then solving for Q M1, and finally solving equation (2). To estimate D A we use  $\hat{p}$, from the regressions on water rights prices between agricultural water users, to calibrate a demand curve using previous estimates of agricultural price elasticity and an assumption of a constant elasticity of substitution (CES) functional form (Lichtenberg and Zilberman, Reference Lichtenberg and Zilberman1986). The CES demand function has the form:
 $$Q_A =A_0 p^{\eta}.$$
where A 0 is a constant, Q A is quantity of agricultural water used, p is price of water, and η is elasticity of water demand. The agricultural water transaction price, P A1, is used as a point estimate to calibrate the CES demand curve, where Q 0=S−Q M0 is the estimated water use in agriculture:
 $$A_0 = \displaystyle{Q_0 \over (P_A^1)^{\eta}} = Q_0 (P_A^1 )^{-\eta}.$$
Therefore, the price paid by an agriculturalist for a consumptive water right, P A1, is defined as:
 $$P_A^1 = \hat{p}.$$
Rewriting the agricultural demand curve, equation (3), in terms of price and substituting in (4) and (5), and Q A=S−Q M, we arrive at:
 $$p = \hat{p} \left(\displaystyle{S - Q_{M} \over Q_{0}} \right)^{1/n}.$$
To find the willingness of mining firms to pay for water, D M, we construct estimates of willingness-to-pay based on the distance from the coast and elevation of mining operations using desalinated water. Mines are located at various distances and elevations, creating a downward sloping curve. We assume that if the policy restricting transfers was relaxed, agricultural water would initially offset the most expensive desalinated water via market transactions.
The literature that considers water as an input in agricultural production often distinguishes between applied water per acre and the effective water per acre (Bogges et al., Reference Bogges, Lacewell, Zilberman, Carlson, Zilberman and Miranowski1993). The latter depends on irrigation technology, land quality, and soil type. Farmers divert and apply a given quantity of water to their field, and some smaller quantity is used consumptively through evapotranspiration while the remaining water returns to the system, with reuse possible in some circumstances. Chile's system of tradable water rights does not distinguish between applied water and effective water; an owner can always sell the right to the total amount of applied water (Cristi, Reference Cristi2007). For this reason, our analysis supposes the transfer of water from agriculture to mining offsets an equivalent volume of desalinated water. The willingness-to-pay by mining firms for agricultural water rights, p, is:
 $$p = D_M^{-1} (Q_M ).$$
By equating (6) and (7), we can find Q M1:
 $$D_M^{-1} (Q_M^1) = \hat{p} \left(\displaystyle{S-Q^{1}_{M} \over Q_{0}} \right)^{1/n},$$
where S−Q M1 is the amount of water remaining in agriculture at Q M1. Then, the integral from equation (2) is evaluated numerically, after simplifying:
 $$C = \int \limits_0^{Q_M^1} D_M^{-1} (Q)dQ - \hat{p} \int\limits_0^{Q_M} \left(\displaystyle{S - Q \over Q_{0}} \right)^{1/n}dQ.$$
4.2 Parameterization
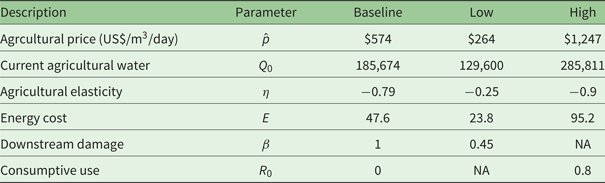
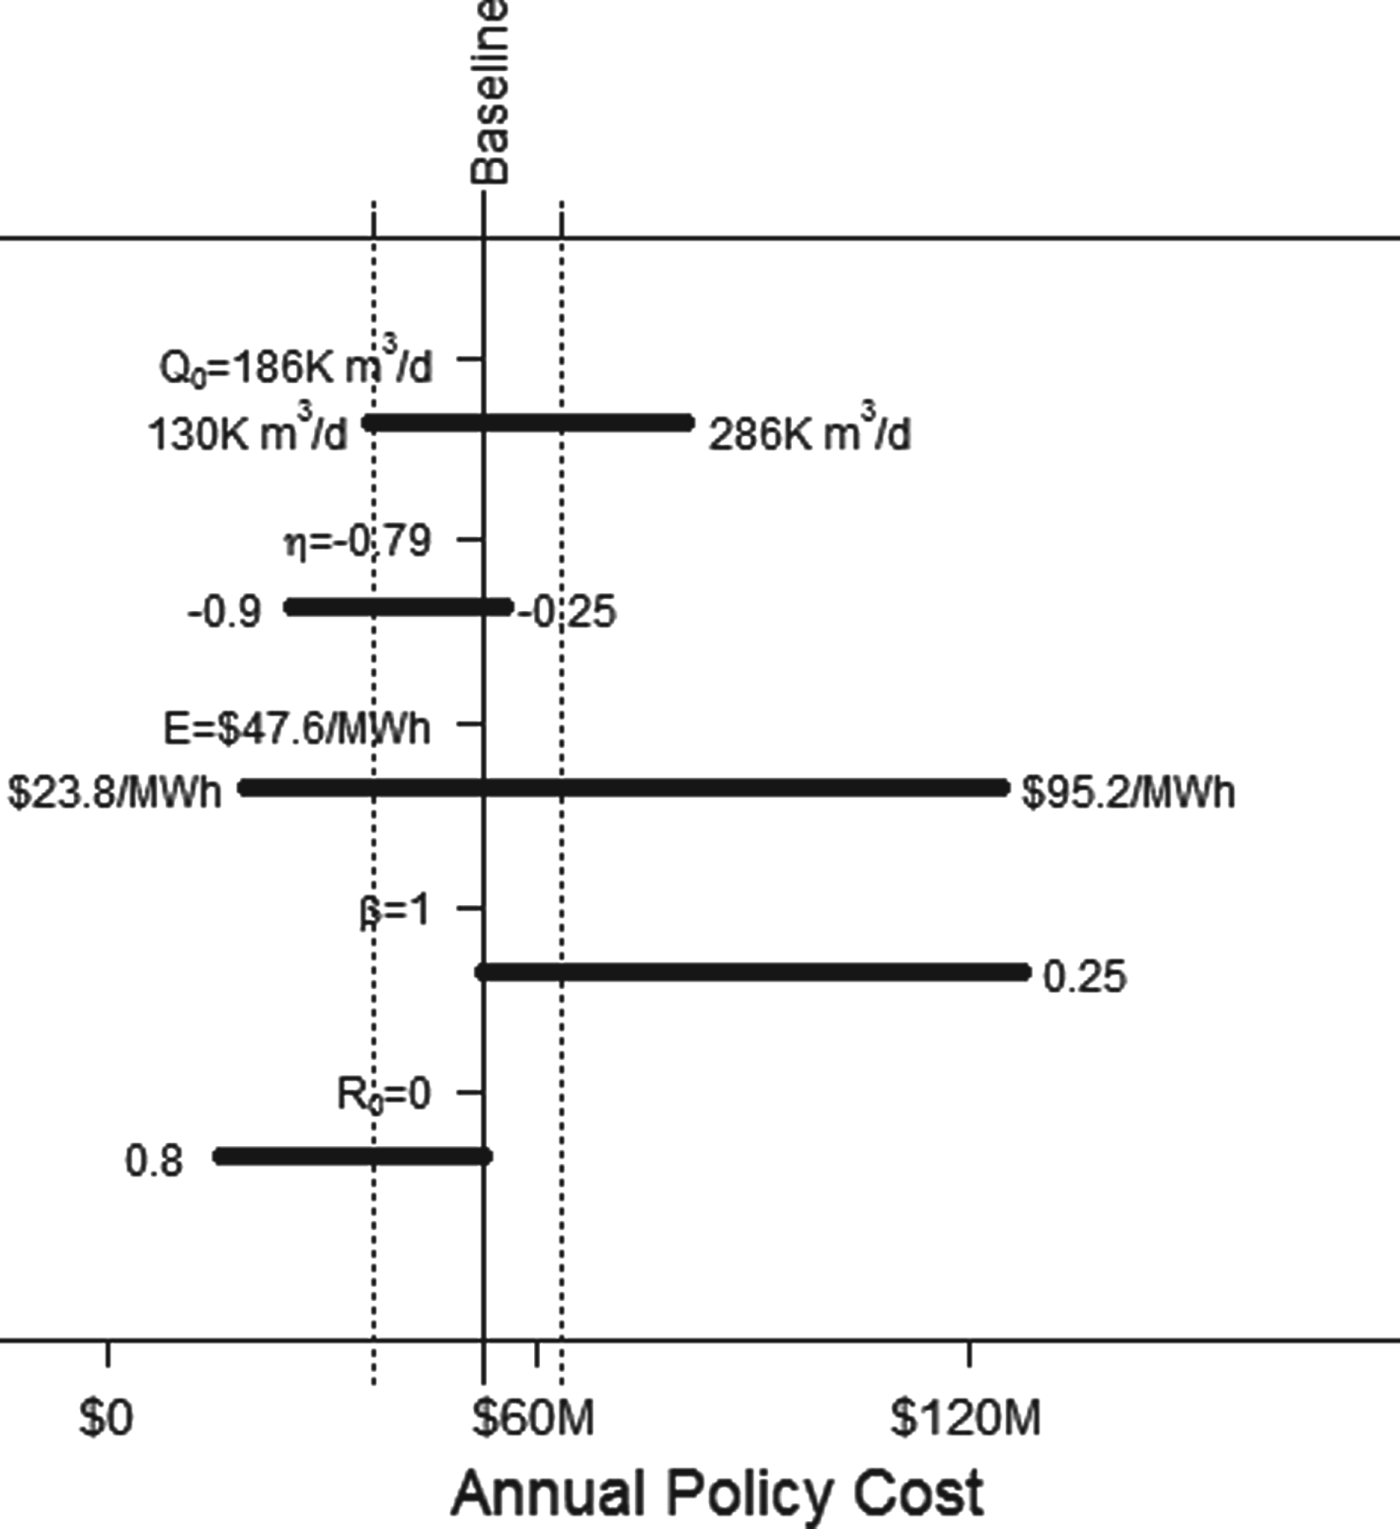
Table 4 describes the parameters used to calculate the policy cost. The key parameters are estimated agricultural-to-agricultural water right price,  $\hat{p}$; quantity of agricultural water available for transfer, Q 0; the agricultural elasticity of water demand, η; and the cost of energy, E. Each of these parameters has a baseline value, as well as a high and low value used for sensitivity analysis. To estimate the quantity of water currently in agriculture, we use a baseline of the total recorded agricultural surface water rights on the Loa River and tributaries, 185,674 m3/day (Salazar et al., Reference Salazar2003; DGA, 2005). For the sensitivity analysis, a range was chosen based on a low estimate of available water using gauged flow in the Loa River of 129,600 m3/day and the estimate of water use in agriculture from table 1 of 285,811 m3/day.
Parameter descriptions and values

To calculate agricultural sale price, we use the mean and confidence interval constructed with estimates from equation (1), specification (2) described above. The price elasticity of demand for water use is estimated to be −0.79 based on calculations from the literature (Schoengold et al., Reference Schoengold, Sunding and Moreno2006). A range from −0.25 (from Nieswiadomy et al., Reference Nieswiadomy1988) to −0.9 is used. Finally, we use water cost estimates calculated and presented in table 5 as our estimate of D M.Footnote 18 The table shows the desalinization plants associated with particular mines and the cost of desalinated water for each plant. Mine locations were selected if they have operational seawater pumping; cost is estimated based on elevation and distance from the ocean. The methodology for constructing this curve is provided in the online appendix and shown graphically in online appendix figure A3, with demand at quantity equal to zero being the current status quo with no transfers to mining.
Desalination projects

Notes: The water cost estimates use a 6% discount rate. Two desalination projects to provide urban water to coastal cities are also included because the urban utility (Aquas Antofagasta) has switched urban users to desalinated water, freeing surface water for mining use, without incurring pumping costs. Some of the projects listed (Algorta Norte, Sierra Gorda, and Michilla II) have utilized direct seawater, but we have chosen to estimate the desalinated water cost because the direct seawater has proven problematic due to its corrosive properties.
Source: Authors' calculations; procedures and sources are fully described in the online appendix.
Two additional parameters – agricultural water return rate, R 0, and the downstream flow reduction coefficient of mining extractions, β, which both range between 0 and 1 – are also included in the interest of completeness. While the baseline set of assumptions is consistent with the Chilean interpretation of hydrologic conditions, these additional parameters explore two possibilities. First, that sales from agriculture are modified to reflect return flow; agricultural users purchase a water right that entitles them to an amount of water, but their effective water use is less. For the robustness check it is assumed that effective water is only 20 per cent of their applied water. Second, sales might be modified to reflect the water savings of mining firm extractions high in the Andean Plateau: we use calculations from the Ojos de San Pedro sub-basin within the Loa River watershed to estimate that downstream flows are decreased only about 45 per cent of the total amount of upstream mining extraction due to savings from reduced evaporation and seepage losses (Edwards and Kirk-Lawlor, Reference Edwards and Kirk-Lawlor2013).Footnote 19
4.3 Simulation results
Based on these parameters and estimates, we solve equation (8) to find Q M1, the quantity of water transferred such that marginal prices are equalized. We find under the baseline scenario that this occurs when 160,500 m3/day of water is permanently transferred out of agriculture to mining firms. Full results are shown in online appendix table A2 for the baseline specifications along with the results of varying each of the parameters. Because water right prices are expressed in perpetuity, the cost estimate is a total present-value cost, which is US$874 million for the baseline parameters. Using a 6 per cent discount rate, the estimate can be converted to the yearly policy cost of US$52 million.
Figure 5 shows the sensitivity analysis graphically: the solid vertical line is the baseline estimate; the dotted vertical lines show the 99 per cent confidence interval constructed around the mean agriculture-to-agriculture exchange price while holding all of the parameters at their baseline values.Footnote 20 The horizontal lines represent the high and low cost estimates of changes in each parameter value, holding all other parameters at their baselines. The sensitivity analysis shows that the cost estimate is particularly sensitive to electricity price. The cost estimate is also sensitive to R 0 and β independently. However, these variables would likely both change simultaneously under a policy that accounted for effective water. A joint sensitivity analysis with R 0=0.2 and β=0.45 results in a policy cost estimate of US$76.86 million/year.
Present value policy cost sensitivity analysis.

The policy cost estimate is not a measure of welfare change because it does not incorporate the non-market costs and benefits of the policy. Without the trade restrictions, we estimate around 86 per cent of the remaining surface water in the highlands would be removed from agriculture, desiccating natural water sources and negatively affecting riparian ecosystems and forcing indigenous communities out of their ancestral homeland. The policy also produces non-market costs, shifting mining production from highland water to seawater powered by fossil fuels, and creating additional greenhouse gas emissions. We discuss these issues in the next section.
5. Discussion
The primary result of this paper is the estimate of an annual US$52.46 million policy cost associated with the DGA water use regulations. This result may be large or small, depending on what benefits, and to whom, these costs are compared to. Many of the benefits of the policy are nebulous, making a full accounting difficult. Comparing the policy cost to total agricultural output in the region of only US$6 million annually suggests the cost is large. Indigenous groups represent around 5 per cent of total regional population, although the estimates of those directly engaged in agriculture is only around 706. This implies a policy cost of over US$74,000/year for each active indigenous agriculturalist in the region.
However, the direct value of agricultural production is likely to underestimate the importance of water to indigenous communities. The direct agricultural and cultural benefits of the policy include cultural values associated with indigenous water use, avoided relocation costs, and agricultural production. In the cultures of the Aymara and Atacama – the native people of the Antofagasta region – water is viewed as a community asset (Peña, Reference Peña, Donoso, Jouravlev, Peña and Zegarra2004). Further, the costs of relocating entire villages that are desiccated would likely be much higher than lost agricultural production. For example, the Ojos de San Pedro (OdSP) area of the highlands in the Antofagasta Region was once the location of a lake and wetland system that supported a unique ecology and a small village. Even early water extraction by mining firms through 1970, however, led to severe impacts, including a complete desiccation of the area and the abandonment of the village (Edwards and Kirk-Lawlor, Reference Edwards and Kirk-Lawlor2013). While compensation was not paid in this case, it is difficult to imagine in modern-day Chile that relocation would not entail significant economic and sociological costs.
The environmental benefits of the policy include tourism and the intrinsic value Chileans attribute to protecting their ecosystems. The policy serves to partially protect highly valued tourist destinations, including the Los Flamencos National Reserve near the city of San Pedro de Atacama. Further, many Chileans place intrinsic value on the preservation of their unique ecosystems, and the policy cost per Chilean is less than US$3 per year. When compared to gross mining revenues from the region in 2015 of around US$11.8 billion, and coupled with the environmental and cultural benefits, the policy costs may appear small.
There are also additional policy costs that arise from the carbon emissions as a result of desalinating and pumping water. Because freshwater delivery is gravity fed, it is possible to make a back-of-the-envelope calculation of total carbon emissions. Our baseline projection is that 160,500 m3/day of freshwater could be provided, offsetting US$52.46 million in electricity costs or 1.10B kWh of electricity per year. The northern Chilean grid is 75.6 per cent coal, 13.5 per cent natural gas, and 6.7 per cent fuel oil and diesel (CDEC-SING, 2015). CO2 releases are 0.972 kg/kWh for coal, 0.434 kg/kWh for natural gas, and 0.865 kg/kWh for fuel oil no. 6 (authors’ calculations from 2010 data from EIA (2017)). This leads to an estimate of the policy causing an additional 721,451 metric tons of CO2 emissions. The social cost of carbon is estimated at US$43.00 per metric ton, the mean of the peer-reviewed studies surveyed by Tol (Reference Tol2005). This leads to a cost estimate of US$31.02 million per year.
The high policy costs relative to agricultural production and employment and the potential environmental costs of increased carbon emissions, coupled with the high cultural and intrinsic values placed on in situ water, challenge policy makers and regulators to find alternative solutions. Markets may offer a partial solution. The Chilean government purchases water rights through the Fund for Indigenous Lands and Waters that are then granted to the communities in perpetuity. In this way, the rights are purchased at a market price from current right holders, moving water to protect environmental and indigenous benefits without reducing the value of property held by agricultural producers. These trades make marginal water values and the cost to the government of the policy explicit, illustrating the tradeoffs between conservation and development. However, once these assets are transferred to villages, sale requires agreement of the entire community. Thus, these rights, although extremely scarce, have limited direct financial value due to low agricultural productivity in the region.
Beyond making tradeoffs explicit, it is worth considering alternative transfer and compensation mechanisms that might facilitate mutually beneficial exchange. Currently, the guidelines issued by the Chilean Undersecretary of Mining (2014) for the best-practices for indigenous relations suggest mining firms work to protect the natural heritage and water flows, utilizing formal commitments with indigenous villages. These guidelines go on to suggest that, in order to meet this objective, firms should preferentially use seawater. We suggest two potential alternatives. First, firms could use this commitment process to determine to what extent village and mining water needs could be met mutually, for instance if mining firms worked with communities on the location and amount of water diversions. Second, indigenous villages could be compensated, for instance investment in infrastructure and education, in addition to the payment firms make to water right holders. While formal property rights offer advantages in the exchange of water by lowering transaction costs, the problem of social cost emerges because the private costs facing decision makers are less than social costs. Although the formal water right system may fail to account for externalities, the argument made by Coase (Reference Coase2013) would suggest that stakeholders and mining companies could potentially engage in beneficial bargaining provided they can define the resource they are bargaining over.
Supplementary material
The supplementary material for this article can be found at https://doi.org/10.1017/S1355770X18000220.
Acknowledgements
This work was supported by a grant from the University of California Center for Energy and Environmental Economics (UCE3) and by the Utah Agricultural Experiment Station. A portion of this work was undertaken while Eric Edwards was Lone Mountain Fellow at the Property and Environment Research Center (PERC). The authors would like to thank Terry Anderson, Carlos Díaz, Nick Parker, Terry Jordan, Naomi Kirk-Lawlor, Sara Sutherland, Matt Turner, and Mark Kanazawa for their suggestions, as well as seminar participants at PERC, the University of Utah, Washington State University, the University of Colorado Environmental and Resource Economics Workshop, the WEAI Annual Conference, and the UCE3 Research Conference.