




No CrossRef data available.
Article contents
Temporal and spatial patterns of nestedness in eel macroparasite communities
Published online by Cambridge University Press: 06 August 2004
Abstract
A nested (non-random) species composition was observed among the intestinal macroparasite communities of European eels, Anguilla anguilla. Nestedness was observed in 8 out of 10 component community samples from the rivers Thames and Test between April 2000 and October 2001. Parasite component communities consisted of mainly generalist and specialist, but also accidental species, and included acanthocephalans, cestodes, nematodes and digeneans. Nestedness was observed when component population size differed markedly between all or most parasite species, but not when the majority of species present was similarly abundant. Nestedness could not be explained in terms of host weight, log normal distribution of parasite species, or mean intensity of infection. It is proposed that nestedness occurred as a result of a sufficiently graded abundance between parasite species, which was established early in the year by colonization processes.
Information
- Type
- Research Article
- Information
- Copyright
- 2004 Cambridge University Press
INTRODUCTION
Nestedness, a non-random pattern in the species composition of communities, is commonly reported from insular or fragmented habitats (Patterson & Atmar, 1986), and extends to at least some others (Patterson, 1990), including parasite assemblages (Guégan & Hugueny, 1994; Rohde et al. 1998; Matejusova, Morand & Gelnar, 2000; Poulin & Guégan, 2000; šimkovà, Gelnar & Morand, 2001; Poulin & Valtonen, 2001, 2002; Vidal-Martinez & Poulin, 2003).
Infracommunities vary in the number of parasite species they contain, and the infracommunities that include parasite species X, for example, will extend over a range of species richness values. In nestedness terms, the lowest infracommunity species richness (ICR) value represents the minimum number of parasite species required in an individual infracommunity before expecting to observe X; if X is found only in those infracommunities that contain equal or higher species richness, and is not observed in infracommunities that contain fewer species, it is nested. Perfect nestedness describes the theoretical situation where this applies to every parasite species in the infracommunities under investigation, where typically the minimum richness value differs between the parasite species concerned. For instance, X may only be found in hosts harbouring [ges ]3 species, Y in those harbouring [ges ]4 species, and so on. As a result, each host contains a non-random (nested) subset of the parasite species comprising the component community; parasite species are not distributed among hosts independently of one another, and some structure is apparent between hosts in terms of the species composition of their infracommunities. In broad ecology terms, nestedness is principally thought to arise as a result of extinction processes, and to a lesser extent, colonization processes (Wright & Reeves, 1992; Atmar & Patterson, 1993; Fleishman & Murphy, 1999). Differential extinction probabilities are thought to lead to a sequential, or selective, loss of species from sites, with the probability of a species disappearing from a site being inversely related to its abundance across all sites. While local extinctions are assumed to stem from random variation in population size and site quality, in nested systems they occur as a non-random, graded loss of species over time (Patterson & Atmar, 1986).
More recently, studies have indicated that colonization processes alone may be sufficient to generate nested subsets of species among some types of sites (Patterson, 1990; Cook & Quinn, 1995). Particularly relevant are new, young or ephemeral sites that were originally empty (zero species). Nestedness could occur if such sites acquire species in an order determined by the differential colonization probabilities between species, although a range of site sizes may also be required (Cook & Quinn, 1995). Hosts satisfy the criterion of insular sites (Kuris, Blaustein & Alió, 1980), and parasite assemblages may be communities where nested subsets of species composition might be observed (Poulin, 1998). In addition, the low frequency of intestinal macroparasite infracommunities in eels from the UK during the winter months (Kennedy, 1990) suggests that the eel intestine is acting as an ephemeral habitat, and should nestedness be observed, colonization processes might be responsible. But while considerable research has been directed at revealing the patterns and processes of eel–macroparasite communities (Kennedy, 1990, 1993; Kennedy & Guégan, 1996), there appear to have been no previous studies into nestedness in eels, and comparatively few on host–parasite systems at all. It also appears that where nestedness has been investigated in host–parasite systems previously, little attempt has been made to test the repeatability of observed nestedness in space or time (Poulin & Valtonen, 2002; Vidal-Martinez & Poulin, 2003).
Nestedness is parasite communities can arise as a result of host size variation (Guégan & Hugueny, 1994; Poulin & Valtonen, 2001; Vidal-Martinez & Poulin, 2003), or high degrees of host specificity among parasite species (Matejusová et al. 2000). However, if parasite species richness is determined by host size, further nestedness analyses will be of limited use (Poulin & Valtonen, 2001). At present it remains unclear how common host-size/parasite-richness correlations, or nested systems, actually are, although a number of studies suggest that nestedness in parasite assemblages is rare (Poulin, 1996; Rohde et al. 1998; Poulin & Guégan, 2000), temporary, and unpredictable (Vidal-Martinez & Poulin, 2003).
The present study examines the intestinal macroparasite infra- and component communities from two populations of eels, with the view to test for nestedness and record any temporal and spatial variation in its occurrence and intensity, and to test the hypothesis that host size is causal. The ‘nestedness temperature calculator’ of Atmar & Patterson (1993) was used, as this avoids significant biases of both the traditional metric N, and the R0 and R1 type null models commonly used with it. This standardized measure of nestedness also allows matrices of different sizes (and values of nestedness) to be compared (Cook & Quinn, 1998; Wright et al. 1998). Despite the advancement on earlier models, the nestedness calculator remains biased toward Type 1 errors, particularly when used with small matrices (Wright et al. 1998) or where both common and rare species are present (Fischer & Lindenmayer, 2002). The bias arises in part because the model assumes that (parasite) species are equally abundant. Whilst not ecologically realistic in this sense, the nestedness calculator still appears more reliable than those models using the alternative null hypothesis (Wright et al. 1998; Cook & Quinn, 1998). Fischer & Lindenmayer (2002) concluded that results from the nestedness calculator need to be interpreted in the light of the model's idiosyncrasies, and that diagonal asymmetry should also be apparent in a significantly nested matrix, before this result can be accepted. If eel hosts can be regarded as ephemeral habitats and host size does not correlate with parasite species richness, variation over time in the intensity of nestedness could indicate whether colonization or extinction processes are responsible.
MATERIALS AND METHODS
Eels were captured from the river Test (Hampshire) using a weir trap at Leckford, and by using fyke nets on the river Thames at Windsor, Greenwich and Thurrock. Windsor and Leckford are both entirely freshwater locations, Thurrock is estuarine, and Greenwich is mainly freshwater with low-level salt water influence (Fig. 1). Eel sampling extended from October 1999 to October 2001 (between April and October). Eleven eel samples were collected, and a total of 357 infected eels were examined as fresh specimens for intestinal macroparasites, not more than 4 days post-capture, using a standard protocol (Norton, Lewis & Rollinson, 2003). The total intestinal macroparasite fauna recovered from each sample of eels was assumed in each case to be representative of the component community within that host population, at that time. Because analyses concerned parasite communities, only infected hosts were included. Thus, the mean intensity of infection was calculated using infected hosts only, and the intensity of infection refers to the number of individuals of a given parasite species, in an individual host, after Bush et al. (1997). Abundance refers to component population size, calculated as the total number of parasites per species, per sample of eels.

Fig. 1. South-East England with eel sampling locations on the rivers Thames and Test.
Testing for nestedness
Each component community sample was tested for nestedness using Atmar & Patterson's ‘nestedness temperature calculator’. These authors considered matrix randomness in terms of disorder, or entropy. The relationship between entropy and heat led them to quantify matrix randomness in terms of temperature, with 0° representing minimum entropy (perfect nestedness), and 100° representing maximum entropy (randomness). The nestedness temperature calculator packs the observed data in a matrix to concentrate presences in the upper left-hand corner as much as possible, while preserving the primary information (species per site data) within the matrix. The packed matrix is then compared with a maximally nested equivalent, to identify unexpected presences and absences. Total unexpectedness is calculated by squaring and summing the relative distances across the skew-diagonal. The temperature of the packed matrix equals the ratio of the sum of squared deviations, to its maximum value, ×100, and is expressed in degrees (T°). The significance of a derived T° value was estimated by t-test, using a normal distribution of 1000 Monte Carlo simulated T° values. Finally, significant nestedness was also expected to be apparent visually, on inspection of the nested matrix, before being accepted (Fischer & Lindenmayer, 2002).
Testing hypotheses of the cause of nestedness
When packing the matrix, the nestedness temperature calculator rearranges matrix columns (parasite species) and rows (individual hosts). Reorganization vectors are included in the program's output, and this allows the user to track the individual columns and rows after they have been packed, so that the order that particular species and individual sites are nested in can be identified. If nestedness is found within a packed matrix, it is in the parasite species composition among rows (hosts). Consequently, rows in the packed matrix represent hosts rearranged according to rank order to nested subset. The host in the top row generally contains the largest subset of parasite species, and that in the bottom row the smallest subset. If a single host factor explains the nestedness (of parasite species), such as size, hosts should be arranged within the matrix in rank order of this factor also. The question then is whether or not host size correlates with nested subset rank, requiring a separate analysis. The hypothesis that nestedness in eel parasite communities arises as a result of variation in host size was tested by Spearman's rank correlation analysis of eel weight against rank in the packed matrix. Eel weight data were used as the measure of host size for this analysis, rather than the conventional standard body length. This was done principally because eels of the same length vary in weight, often considerably, leading to loss of data if length is used as an index of size. Also, a relationship between host size and parasite species richness is explained, at least in part, in terms of the differential feeding rate between larger and smaller hosts, and this rate is likely to reflect biomass or weight more closely than length. Specifically then, the host-size hypothesis predicts that the heaviest eel should have the highest rank in a nested matrix i.e. 1, and vice versa. This data column represents ranks within the matrix, but because increasing rank equals decreasing numerical value, this type of data column is in inverse order for the subsequent correlation test. Inverse correlation ranks are generated during the test procedure, reversing the sign of detected relationships, and a negative correlation coefficient represents a positive relationship. For clarity, the sign of the relationship from all inversely-ranked Spearman's correlations are reversed and tabulated results reflect the true direction of relationships. An identical rank correlation approach was used to test the significance of mean intensity of infection (infected eels only) and component population size, with eel rank within packed matrices. Separate analyses into the relationship between host weight and parasite species richness were also undertaken, where appropriate. Linear regression was used, but some data sets retained unequal variances after log transformation, and were not regressed. A rank-correlation alternative was not appropriate either, because of an unacceptably high number of ties within the observed parasite species richness values (Fowler & Cohen, 1990). These problems applied to 4 of the 11 data sets.
Parasite population size was also plotted against species rank in the packed matrix to visualize the relative difference between species. In addition, cumulative probability plots were used to estimate the rank abundance distributions of each component community. The nestedness temperature calculator was downloaded from http://aics-research.com/nestedness/tempcalc.html. Spearman's correlation co-efficients, cumulative probability plots and linear regressions (least squares method) were computed using SPSS 7.5.
RESULTS
Significant nestedness was observed within 8 of the 10 eel samples that could be tested (Table 1), and all nested matrices demonstrated a discernable asymmetry across the bottom-left/top-right diagonal axis (Fischer & Lindenmayer, 2002). A significant finding was also found for the Leckford 1999 sample, but was judged unreliable because the distribution of simulated T° values was right-skewed i.e. the t-test may not have been appropriate. In the light of this, and because this matrix may have contained an insufficient amount of primary data for reliable use with the nestedness temperature calculator to begin with (Wright et al. 1998; Fischer & Lindenmayer, 2002), the nestedness analysis for the Leckford 1999 sample was abandoned. However, data from Leckford were used for a host weight/parasite species richness analysis. A weak positive relationship between these variables was observed in almost all 8 nested samples, but in only 3 of these was the host weight/parasite species richness relationship also significant, and rS or r2 values in these cases were low. It is assumed that if the occurrence of a host size/parasite species richness relationship correlates with that of nestedness, and the first relationship is to be inferred as casual as in previous studies, then each separate occurrence is required to be statistically significant. In this respect, the host size hypothesis of nestedness was not supported: evidence of a repeatable and significant host weight/parasite species richness relationship was not detected among eels with nested parasite communities.
Table 1. Analyses of packed component community matrices, each constructed with data from n eels (Significant results are in bold. Matrix temperature T° ranges from 0° (perfect nestedness) to 100° (randomness). rS Spearman's rank correlation coefficients. r2 values are shown for significant linear regression results.)

Germane aspects of all packed matrices are shown in Table 2, including the parasite species recovered, and the rank assigned to each species in the packed matrix for that sample. Computed T° values of all significantly nested matrices are given, and 3 temporal series are included, from which changes in T° can be gauged: July and September 2000, and August and October 2001 from Leckford, and April, July and October 2001 from Windsor.
Table 2. Summary table of macroparasite species per location (Gr., Greenwich; Tk., Thurrock), ranked according to their position within packed matrices (fr.=Freshwater strain, est.=estuarine strain, N.S., Not significant.)

Generalist acanthocephalans retained consistently high ranks in both Leckford and Windsor component communities: Echinorhynchus truttae at Leckford and Acanthocephalus anguillae at Windsor. In the Leckford 2000 series (Table 2), parasite species absent from the September sample mostly had low ranks in the July sample, suggesting that a predictable extinction order may have occurred. These findings were not replicated during 2001, where nestedness decreased from a significant to a non-significant level between the months August to October. Although 2 of the 3 parasite species absent by October 2001 had low ranks in the July sample, Nicolla gallica did not. In addition Cucullanus truttae appeared in July only, and no ranks were preserved between the samples.
The temporal series from Windsor during 2001 indicating that the degree of nestedness diminished over the period April, July and October (T° values increased) and significant nestedness was observed during April and July only. The number of parasite species decreased in consecutive samples, and those species found in all three months retained their approximate rank throughout.
In addition, the rank position of parasite species correlated with component population size, but not mean intensity of infection, in the Windsor time series (Table 3). Correlation coefficients indicated a positive but not significant relationship between mean intensity of infection and rank position in the matrix. The relationship between mean intensity of infection and component population size was positive, as expected, but not consistently significant.

Apart from the Windsor samples of 2001, only 3 other host samples contained sufficient parasite species ([ges ]7) for a non-parametric rank correlation analysis (Table 4). These additional samples were from Leckford (July 2000 and August 2001), and Greenwich (June 2001). Spearman's rank correlation coefficients indicated the rank position of parasite species within packed matrices from these Leckford and Greenwich eel samples correlated with both component population size and mean intensity of infection, on 2 out of 3 occasions. On the third occasion (Leckford, July 2000) the variables were positively correlated but not significantly so.

The range in host weight varied between eel samples, but there was no reason to suggest it was too small to test the host size hypothesis in any individual sample. Nestedness was also observed in the sample with the smallest range in host weight (Leckford, September 2000), and a fraction of the range typically encountered during the study (Table 5). All 11 component community samples demonstrated an approximately log-normal distribution of parasite species using cumulative probability plots.
Table 5. Mean and range of eel weights used in the study, per sample, per location (n, Number of eels per sample (infected only); s, standard deviation of the mean.)

When parasite component population size was plotted against parasite species rank in the packed matrix, there was a considerable difference between the component population sizes of the highest and lowest ranked species, as expected with log-normal species distributions (Figs 2 and 3). But, where a number of parasite species within a sample had similar population sizes, the degree of nestedness was lower (higher T°) than in similarly species-rich samples where the population sizes were less similar. Examples of this were Leckford, July 2000 and August 2001 (Fig. 2A,B), and the Windsor time series of 2001 (Fig. 2C).

Fig. 2. (A–C) The relationship between parasite component population size and parasite species rank within packed matrices for Leckford and Windsor component community samples. The temperature of nested matrices is given, where the result was significant. (A) Leckford, 2000 ([bull ], July, 27 °C; ○, September, 9 °C). (B) Leckford, 2001 ([bull ], October, N.S.; ○, August, 15 °C). (C) Windsor 2001 (○, April, 23 °C; □, October, N.S.; [utri ], July, 28 °C).

Fig. 3. The relationship between parasite component population size and parasite species rank within packed matrices for River Thames 2000–2001; non-time-series component community samples only. The temperature of nested matrices is given, where the result was significant. (○, Windsor, August 2000, 6·5 °C; □, Greenwich, June 2001, 10·5 °C; [utri ], Thurrock, October 2001, 6·7 °C).
DISCUSSION
While accepting that it is often impractical, Vidal-Martinez & Poulin (2003) suggested that nestedness studies should control for a species richness/host size relationship, perhaps by using adult hosts only. Minimum legal mesh and trap sizes used in eel fishing in the UK effectively ensured this: eel hosts used in this study were not small (in eel terms), and host weight did not generally correlate with species richness, suggesting eels from the rivers Thames and Test were particularly relevant study populations.
Nestedness was observed in the intestinal macroparasite communities of eels from both Thames and Test populations, on 8 out of 10 occasions where this was testable, using a refined metric of nestedness with a reduced probability of a type 1 error over most older models (Atmar & Patterson, 1993). It appeared that nestedness can be common if unpredictable in eel parasite communities, both temporally and spatially. Using both the conventional regression of parasite species richness against host weight, and the unconventional row-position against host weight, revealed only 3 significant relationships, all positive but weak; 6 examples of observed nestedness could not be explained by variation in host weight (in the range 88–1277 g). Furthermore, the 3 examples of nestedness in which a relationship with host weight was observed all demonstrated a lower degree of nestedness (higher T°) compared with most examples where no such relationship was observed. Given all of this, an alternative explanation was required for the observed nestedness, and the suggestion by Poulin & Valtonen (2001) of the limited utility of nestedness analyses in parasite community ecology was challenged, at least in the case of eels. A positive but weak trend emerged between host weight and parasite species richness among the samples used in this study, and perhaps this is sufficient to generate variation between parasite communities and in turn lead to nestedness. If this is the case (apart from the difficulty of testing), a stronger and significant relationship between these two variables in comparable samples might also be expected to generate sufficient variation for nestedness. This variation did not occur in the Leckford eels sampled during October 2001, where a significant relationship between host weight and parasite species richness was observed, but nestedness was not.
A significant degree of nestedness was apparent at Windsor (2001) in April but not by October. By October 3 parasite species of low rank in July were absent from the sample, otherwise species generally retained their rank within the April, July and October samples. Together these observations suggest that extinction events occurring in Windsor eels during the latter part of 2001 eroded the high differential in species abundance observed earlier in the year. With no evidence for a relationship between parasite species richness and host weight, it is proposed that colonization processes occurring early in the season, in leading to a sufficiently high differential species abundance, were most likely responsible for the nestedness observed in Windsor eels during 2001.
Interpreting results from Leckford eels was more problematic: eel samples were not available earlier in the year and fewer parasites were present later in the year, than in Windsor eels. Significant nestedness was observed among Leckford eels in July 2000, but in contrast to the Windsor findings, was more pronounced by September 2000. By September, 4 of the 5 species ranked lowest in July were absent from Leckford eels, and the species still remaining in September were observed at considerably lower numbers. The loss of low-ranking species, and the lower component population sizes suggest that by September extinction events were more common than colonizing events, and that a predictable species extinction order may have occurred. The degree of nestedness increased by September, but the differential abundance between parasite species was also enhanced, compared with July. These findings are consistent with a hypothesis of high differential abundance as a cause of nestedness in some types of parasite community, but suggest that colonization or extinction processes may be implicated.
Findings during 2001 indicated that the degree of nestedness within Leckford eels fell between August and October, but there was little to suggest that parasite species had disappeared in a predictable order. However, during the latter part of 2001 both the differential abundance between remaining species, and the degree of nestedness, decreased.
Overall, results suggest that the differential abundance between parasite species within Thames and Test eel populations was sufficiently high to lead to nested parasite infracommunities. Regarding a species' abundance as the net effect of colonization and extinction rates, results suggest that when nestedness arose it was probably as a result of colonization processes earlier in the year, and that extinction processes generally eroded, but could enhance, nestedness. Whilst there was some temporal and spatial unpredictability, nested occurrences were more common during the spring and summer months. Contrary to recent research (Guégan & Hugueny, 1994; Poulin & Valtonen, 2001; Vidal-Martinez & Poulin, 2003), this study found little evidence that variation in host size was responsible for nested parasite communities. These results suggest that nestedness analyses can still be an effective research tool in parasite community studies. Even so, the repeatability of nested parasite communities in eels is in stark contrast to findings from previous fish parasite studies, and lends weight to the conclusion by Vidal-Martinez & Poulin (2003) that the frequency of nestedness in host–parasite systems will be difficult to generalize.
The authors would like to thank Neil Morley of Royal Holloway, Guy Robinson & Warren Gilchrist of The Leckford Estate, Chris Dutton of the Environment Agency, The Leverhulme Trust and The Linnean Society, for support and assistance.
References
REFERENCES
ATMAR, W. &
PATTERSON, B. D.
(
1993).
The measure of order and disorder in the distribution of species in fragmented habitat.
Oecologia 96, 373–382.CrossRefGoogle Scholar
BUSH, A. O.,
LAFFERTY, K. D.,
LOTZ, J. M. &
SHOSTAK, A. W.
(
1997).
Parasitology meets ecology on its own terms: Margolis et al. revisited.
Journal of Parasitology 83, 575–583.CrossRefGoogle Scholar
COOK, R. R. &
QUINN, J. F.
(
1995).
The influence of colonization in nested species subsets.
Oecologia 102, 413–424.CrossRefGoogle Scholar
COOK, R. R. &
QUINN, J. F.
(
1998).
An evaluation of randomization models for nested species subsets analysis.
Oecologia 113, 584–592.CrossRefGoogle Scholar
FISCHER, J. &
LINDENMAYER, D. B.
(
2002).
Treating the nestedness calculator as a ‘black box’ can lead to false conclusions.
Oikos 99, 193–199.CrossRefGoogle Scholar
FLEISHMAN, E. &
MURPHY, D. D.
(
1999).
Patterns and processes of nestedness in a Great Basin butterfly community.
Oecologia 119, 133–139.CrossRefGoogle Scholar
FOWLER, J. &
COHEN, L.
(
1990).
Practical Statistics for Field Biology.
Open University Press.
GUÉGAN, J. F. &
HUGUENY, B.
(
1994).
A nested species subset pattern in tropical fish: host as major determinant of parasite infracommunity structure.
Oecologia 100, 184–189.CrossRefGoogle Scholar
KENNEDY, C. R.
(
1990).
Helminth communities in freshwater fish: structured communities or stochastic assemblages? In
Parasite Communities: Patterns and Processes (ed. Esch, G. W., Bush, A. O. &
Aho, J. M.
), pp. 131–156. Chapman and Hall, London.
KENNEDY, C. R.
(
1993).
The dynamics of intestinal helminth communities in eels Anguilla anguilla in a small stream: long term changes in richness and structure.
Parasitology 107, 71–78.CrossRefGoogle Scholar
KENNEDY, C. R. &
GUEGAN, J.-F.
(
1996).
The number of niches in intestinal helminth communities of Anguilla anguilla: are there enough spaces for parasites?
Parasitology 113, 293–302.Google Scholar
KURIS, A. M.,
BLAUSTEIN, A. R. &
ALIÓ, J. J.
(
1980).
Hosts as islands.
American Naturalist 116, 570–586.CrossRefGoogle Scholar
MATEJUSOVÁ, I.,
MORAND, S. &
GELNAR, M.
(
2000).
Nestedness in assemblages of gyrodactylids (Monogenea: Gyrodactylidea) parasitising two species of cyprinid – with reference to generalists and specialists.
International Journal for Parasitology 30, 1153–1158.CrossRefGoogle Scholar
NORTON, J.,
LEWIS, J. W. &
ROLLINSON, D.
(
2003).
Parasite infracommunity diversity in eels: a reflection of local component community diversity.
Parasitology 127, 475–482.CrossRefGoogle Scholar
PATTERSON, B. D.
(
1990).
On the temporal development of nested subset patterns of species composition.
Oikos 59, 330–342.CrossRefGoogle Scholar
PATTERSON, B. D. &
ATMAR, W.
(
1986).
Nested subsets and the structure of insular mammalian faunas and archipelagos.
Biological Journal of the Linnean Society 28, 65–82.CrossRefGoogle Scholar
POULIN, R.
(
1996).
Richness, nestedness, and randomness in parasite infracommunity structure.
Oecologia 105, 545–551.CrossRefGoogle Scholar
POULIN, R.
(
1998).
Evolutionary Ecology of Parasites.
Chapman and Hall,
London.
POULIN, R. &
GUÉGAN, J.-F.
(
2000).
Nestedness, anti-nestedness, and the relationship between prevalence and intensity in ectoparasite assemblages of marine fish: a spatial model of species coexistence.
International Journal for Parasitology 30, 1147–1152.CrossRefGoogle Scholar
POULIN, R. &
VALTONEN, E. T.
(
2001).
Nested assemblages resulting from host size variation: the case of endoparasite communities in fish hosts. International Journal for Parasitology 31, 1194–1204.CrossRefGoogle Scholar
POULIN, R. &
VALTONEN, E. T.
(
2002).
The predictability of helmith community structure in space: a comparison of fish populations from adjacent lakes. International Journal for Parasitology 32, 1235–1243.CrossRefGoogle Scholar
ROHDE, K.,
WORTHEN, W. B.,
HEAP, M.,
HUGUENY, B. &
GUÉGAN, J.-F.
(
1998).
Nestedness in assemblages of metazoan ecto- and endoparasites of marine fish.
International Journal for Parasitology 28, 543–549.CrossRefGoogle Scholar
šIMKOVÁ, A.,
GELNAR, M. &
MORAND, S.
(
2001).
Order and disorder in ectoparasite communities: the case of congeneric gill monogeneans (Dactylogyrus spp.).
International Journal for Parasitology 31, 1205–1210.CrossRefGoogle Scholar
VIDAL-MARTINEZ, V. M. &
POULIN, R.
(
2003).
Spatial and temporal repeatability in parasite community structure of tropical fish hosts.
Parasitology 127, 387–398.CrossRefGoogle Scholar
WRIGHT, D. H. &
REEVES, J. H.
(
1992).
On the meaning and measurement of nestedness of species assemblages.
Oecologia 92, 416–428.CrossRefGoogle Scholar
WRIGHT, D. H.,
PATTERSON, B. D.,
MIKKELSON, G. R.,
CUTLER, A. &
ATMAR, W.
(
1998).
A comparative analysis of nested subset patterns of species composition.
Oecologia 113, 1–20.Google Scholar
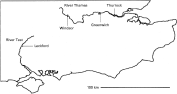
Fig. 1. South-East England with eel sampling locations on the rivers Thames and Test.
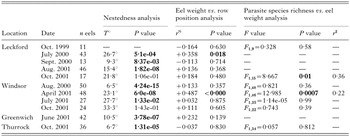
Table 1. Analyses of packed component community matrices, each constructed with data from n eels
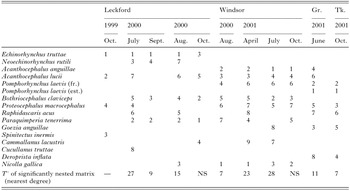
Table 2. Summary table of macroparasite species per location (Gr., Greenwich; Tk., Thurrock), ranked according to their position within packed matrices
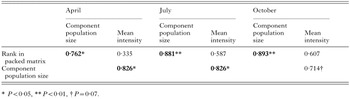
Table 3. Significant Spearman's rank correlation coefficients (indicated in bold) for the Windsor time series (2001)
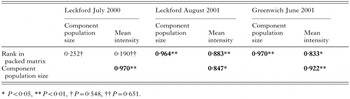
Table 4. Significant Spearman's rank correlation coefficients (indicated in bold) for the Leckford (2000 and 2001), and Greenwich component community samples
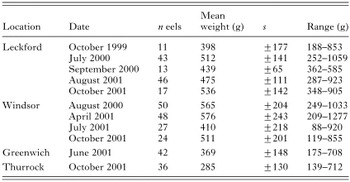
Table 5. Mean and range of eel weights used in the study, per sample, per location
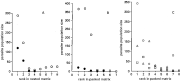
Fig. 2. (A–C) The relationship between parasite component population size and parasite species rank within packed matrices for Leckford and Windsor component community samples. The temperature of nested matrices is given, where the result was significant. (A) Leckford, 2000 ([bull ], July, 27 °C; ○, September, 9 °C). (B) Leckford, 2001 ([bull ], October, N.S.; ○, August, 15 °C). (C) Windsor 2001 (○, April, 23 °C; □, October, N.S.; [utri ], July, 28 °C).
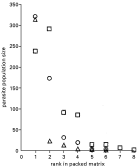
Fig. 3. The relationship between parasite component population size and parasite species rank within packed matrices for River Thames 2000–2001; non-time-series component community samples only. The temperature of nested matrices is given, where the result was significant. (○, Windsor, August 2000, 6·5 °C; □, Greenwich, June 2001, 10·5 °C; [utri ], Thurrock, October 2001, 6·7 °C).
 You have
Access
- 28
- Cited by