1. MOTIVATION AND RESULTS
The problem of deciding whether a strongly autocorrelated time series is best described as an integrated process or a stationary process with largest root near to one (i.e., a near integrated process) is a long-standing one in time series econometrics. Many observed macroeconomic time series appear to be well described as either integrated or near integrated; see Tables 6 and 7 of Stock and Watson (1999) for some well-known examples. From a hypothesis testing perspective, the null hypothesis may be chosen to be either integration or near integration. Müller (2005) investigated the properties of the Kwiatkowski, Phillips, Schmidt, and Shin (1992) test (KPSS test) applied to testing the null hypothesis that a time series is near integrated against the alternative hypothesis that it is integrated. His results show that the KPSS test as usually implemented, using a bandwidth parameter in the long-run variance estimator that increases at a slower rate than the sample size, has an asymptotic size of unity under this null hypothesis. This finding is taken to explain the increased finite-sample size of the KPSS test under strongly autocorrelated stationary data generating processes (DGPs); see, for example, Caner and Kilian (2001, Table 1). Alternately, Müller showed that choosing the bandwidth parameter to increase at the same rate as the sample size results in a test with size of less than unity but with a nonstandard asymptotic distribution, possibly dependent on nuisance parameters. He compared these asymptotic properties of the KPSS test with those of a point optimal test designed specifically for testing for near integration against a unit root, and he found the point optimal test to be superior.
In this note we suggest a simple modification to the KPSS test to make it applicable to testing for near integration against a unit root. Briefly, if the model for a time series wt is

where c ≥ 0 and νt is stationary, then the near integrated null hypothesis is H0 : c ≥ c > 0 for some fixed c, to be tested against the unit root alternative H1 : c = 0. Instead of applying the KPSS test to wt, we suggest that it be applied instead to the filtered series wt − (1 − c/T)wt−1. This has the effect of removing the near unit root under the null hypothesis, resulting in a KPSS test with controlled asymptotic size. Under the alternative hypothesis, the filtering does not completely remove the unit root, and so the test retains nontrivial power.
The asymptotic properties of the transformed KPSS test are derived and compared with those of the point optimal test of Müller (2005) and another point optimal test derived by Elliott and Müller (2006). These point optimal tests are based on differing treatments of the initial value, w1, in (1). The modified test is found to have superior properties for a range of assumptions about the initial value and also to have superior finite-sample size properties in the presence of stationary autocorrelation in νt. We leave for future research the use of the modified test for confidence interval construction for the largest autoregressive root, as discussed by Elliott and Stock (2001) using point optimal tests.
2. THE MODEL AND MODIFIED KPSS TEST
Consider the following DGP (cf. Müller and Elliott, 2003) for an observed series yt


where νt is a stationary process. Here ρc,T = 1 − cT−1, c ≥ 0. We wish to test the null hypothesis of local to unit root stationarity against the unit root alternative. Following Müller (2005) we state these as H0 : c ≥ c > 0 against H1 : c = 0 where c specifies the minimal amount of mean reversion under the stationary null hypothesis.
As regards the initial value, which is important under H0, following Müller and Elliott (2003), we assume that it is fixed and set ξ = αω/(1 − ρc,T2)1/2, for c > 0. Here α controls the magnitude of the initial value relative to the standard deviation of a stationary AR(1) process with parameter ρc,T < 1. We assume that νt is a zero mean stationary process with finite autocovariances E(νtνt−j) = γj and long-run variance

that is finite and nonzero.
We consider the following generalized least squares (GLS) type transformation of the yt based on our hypothesized value c under the stationary null:

for t = 2,…,T. To use the yt − ρc,T yt−1 as the basis for a KPSS test we need to make them invariant to μ(1 − ρc,T). So, we utilize the ordinary least squares (OLS) estimator of μ(1 − ρc,T) given by

and calculate the OLS residuals

Our modified KPSS test is then the standard KPSS statistic constructed from the rc,t. That is,

Here

is any standard long-run variance estimator of the form

where λ(.) is a kernel function. The following theorem provides the asymptotic distribution of Sμ(c) under the null and alternative hypotheses.
THEOREM 1. Under the preceding assumption for νt,

where

and W(r) is a standard Wiener process. Also, when c = c > 0, Hα,c,c(r) = W(r) − rW(1).
The second part of the theorem shows that Sμ(c) has the standard intercept case KPSS limiting null distribution. Note that Sμ(c) is invariant to the initial value even in finite samples.1
If (2) also includes a linear trend term, the modified statistic is formed from the OLS detrended yt − ρc,T yt−1, t = 2,…,T. Redefining rc,t accordingly, the analogue to Theorem 1 follows by replacing Hα,c,c(r) with

. Also, Sμ(c) has the usual trend case KPSS distribution.
The modified KPSS test is related to the prewhitened long-run variance estimator suggested by Sul, Phillips, and Choi (2005) for the KPSS test. Instead of the usual fixed upper bound of 0.97 for the AR(1) prewhitening coefficient, they suggest using 1 − T−1/2. The difference is that our AR(1) filtering uses 1 − cT−1 and this is employed in both numerator and denominator of the test. Sul et al. (2005) note that the rate T−1 at which 1 − cT−1 approaches unity makes it inappropriate for prewhitening when used in the denominator alone, but clearly it is valid in our context.
3. COMPARISONS WITH OPTIMAL STATIONARITY TESTS
We compare the asymptotic performance of Sμ(c) with that of the stationarity test of Müller (2005), denoted Qμ(g) in the notation of that paper (with g corresponding to c). This test is asymptotically optimal in a Gaussian setting when g = c, in the situation where the initial value is generated with α = 1. The test was originally suggested as a point optimal test of the unit root null in Elliott (1999) but can equally be considered as a test of the null of stationarity, simply by considering the opposite tail of the distribution to the unit root case.
When testing the unit root null, Müller and Elliott (2003) consider the effect that the magnitude of the initial value in a stationary series has on the power of unit root tests. In the current context of stationarity testing, this translates into an issue of size control. Elliott and Müller (2005), in the unit root testing context, derive an asymptotically optimal test (based on a weighted average power criterion) whose power varies little across different initial values. Again, it can equally be considered as a stationarity test, where size should be fairly robust across differing initial values. We denote this test Qμ(g,k). As regards choosing parameters, we follow the previous authors and set c = g = 10 (k = 3.8).
Limit distributions of the three statistics are simulated by approximating the Wiener process functionals involved using i.i.d.N(0,1) variables, approximating the integrals by normalized sums of 5,000 steps. All experiments are based on 10,000 replications.
As in Müller (2005), we compare the tests by determining critical values for each such that rejection rates coincide at some prespecified value for c = 0 (power) and then examining their size for c > 0. In this way, one test dominates another if the former's rejection profile for c > 0 (size) lies consistently below that of the latter.2
Note that when c = 0 all the tests are invariant to α, so that the same critical values apply for all α.
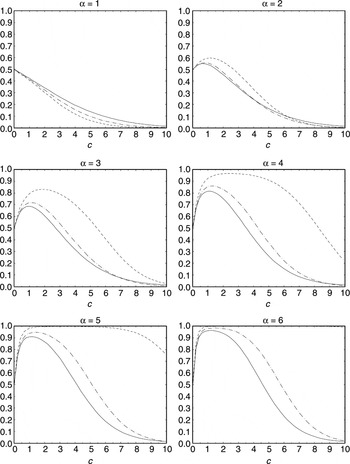
Figure 1 shows the rejection profiles of the tests across c for a rejection rate of 0.50 when c = 0. When α = 1, Qμ(10) is the optimal test, and so it dominates the other two tests everywhere. Between Qμ(10, 3.8) and Sμ(10), it is Qμ(10, 3.8) that dominates, though not substantially. In fact, there is only ever a very modest amount of difference between the sizes of all three tests, with all having size close to zero when c = 10. The size of each test is also monotonically decreasing in c. For α > 1, the rejection profiles are no longer monotonic in c. There is always a region of c for which the size of each test is greater than power. However, this effect differs significantly across tests. As α increases the size of Qμ(10) rapidly approaches 1.00 for most c, demonstrating its sensitivity to departures of the initial value from its optimality point. The other two test sizes appear much less sensitive to increasing α. Between these two, whereas there is virtually nothing to choose for α = 2, for all α ≥ 3 it is Sμ(10) that clearly dominates Qμ(10, 3.8) in terms of exhibiting the least size distortion.

Asymptotic size and power: ———, Sμ(10); - - - - -, Qμ(10); – · – · –, Qμ(10, 3.8).
To compare finite-sample size, we consider the DGP (2) with μ = 0 and νt generated by the MA(1) model

with εt ∼ i.i.d.N(0,1). For Qμ(10) and Qμ(10, 3.8), we follow Müller (2005) and estimate ω2 using residuals from an AR(1) regression of demeaned yt in place of the rc,t in (3). For all tests we use the quadratic spectral (QS) kernel for λ(.) and employ the automatic bandwidth selection of Newey and West (1994).
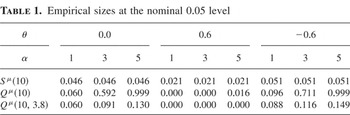
For T = 200 and c = 10, Table 1 shows the empirical size of the tests using nominal 0.05 level asymptotic null critical values for various values of θ and α.3
For Sμ(10) this is the standard KPSS value of 0.460. Unlike Sμ(10), neither Qμ(10) nor Qμ(10, 3.8) is invariant to α when c = 10. For these two tests we use asymptotic critical values calculated assuming α = 1. This is appropriate for Qμ(10) as α = 1 is the value at which it is optimal. Also, it is not unreasonable for Qμ(10, 3.8) because this test is designed to have critical values that are fairly insensitive to α.
Empirical sizes at the nominal 0.05 level

Overall, our findings indicate that despite its optimality, Qμ(10) is too susceptible to severe oversizing problems when α > 1 to be recommended for practical use. Although Qμ(10, 3.8) suffers rather less in this same situation, it is still the case that Sμ(10) generally displays the more robust size control asymptotically for a given level of power and also has better finite-sample size properties. We therefore conclude that, in circumstances when there is some uncertainty about the generation of the initial value, the modified KPSS test is likely to provide the most dependable inference of those considered here.
4. PROOF OF THEOREM
As the rc,t are invariant to μ, we can set μ = 0 without loss of generality, so that yt = wt. It also proves convenient to define zt = wt − w1 and rewrite rc,t in the form

Then

and we may write the first right-hand side term of (4) as

on noting that z1 = 0. It is shown in Elliott (1999) that T−1/2z[rT] ⇒ ωKα,c(r) where Kα,c(r) is defined as in Theorem 1 and W(r) is the Wiener process defined by

. So, setting t = [rT] we find that

For the second right-hand side term of (4), note that

Hence,

Thus, via the continuous mapping theorem,

That

follows simply by noting that for t = 2,…,T we can write

and so

To show the second part of the theorem note that when c = c > 0 we have, for t = 2,…,T,

and so rc,t invariant to α and using standard results