


I. INTRODUCTION
In recent years, granular nanocomposites and porous materials have attracted extensive interest because of their potential as candidates for increasing the dimensionless thermoelectric figure-of-merit ZT = σS 2T/κ, where σ is the electrical conductivity, S is the Seebeck coefficient, κ is the thermal conductivity, and T is the average absolute temperature.Reference Faleev and Leonard1–Reference Vineis, Shakouri, Majumdar and Kanatzidis6 For most of the commercially available thermoelectric materials, ZT is well below one. This fact limits the efficiency of energy conversion between electricity and heat, and the application of thermoelectric devices for power generation and refrigeration. In 2002, Harman et al. reported ZT = 1.6 at T = 300 K for PbSeTe/PbTe nanodot superlattices.Reference Harman, Taylor, Walsh and LaForge7 Recently, a dramatic enhancement in ZT has been achieved in bulk thermoelectric nanostructures with all-scale hierarchical architecturing for lead chalcogenides PbTe, PbSe, and PbS.Reference Biswas, He, Zhang, Uher, Dravid and Kanatzidis8,Reference Biswas, He, Blum, Wu, Hogan, Seidman, Dravid and Kanatzidis9,Reference He, Kanatzidis and Dravid10 A recorded high ZT value of ∼2.2 at 915 K has been demonstrated by the introduction of 1–17 nm SrTe nanoscale precipitations and 0.1–1 μm micrograins in the Na-doped PbTe matrix.Reference Biswas, He, Blum, Wu, Hogan, Seidman, Dravid and Kanatzidis9 The increase in ZT value has come either from the reduction in lattice thermal conductivity or improvement in thermoelectric power factor P = σS 2, or both of them. Note that there are many theoretical and experimental studies on the enhancement of the Seebeck coefficient and power factor (see, e.g., Refs. Reference Fel, Strelniker and Bergman11,Reference Martin, Wang, Chen and Nolas12,Reference Huang, Lu, Chiu, Su, Liao, Huang and Hsieh13,Reference Neophytou, Zianni, Kosina, Frabboni, Lorenzi and Narducci14 and citations therein). In Ref. Reference Neophytou, Zianni, Kosina, Frabboni, Lorenzi and Narducci14, it has been reported a large power factor in p-type nanocrystalline Si: ∼5 times higher than in bulk Si. Assuming inhomogeneous impurity distribution in grains, a theoretical model has been developed to show the increase in electrical conductivity in the grains and simultaneous increase in the Seebeck coefficient in grain boundaries.
Despite such a rapid progress in technology of high-performance thermoelectric materials, very few theoretical works have, yet, been done to analyze thermal transport properties in semiconductors with pores or inclusions of varying size scales. In our recent publications,Reference Tarkhanyan and Niarchos15,Reference Tarkhanyan, Ioannidou and Niarchos16 a considerable reduction in lattice thermal conductivity of a nanocomposite with pores from nano to microscale size has been predicted. In Ref. Reference Tarkhanyan and Niarchos17, we have shown that the porosity always leads to an increase in the absolute value of the Seebeck coefficient due to the enhancement of the entropy per charge carrier. This enhancement is caused by the energy-filtering effect at pore boundaries and reduction of the carrier's density compared to that in bulk material with zero porosity. The pores were assumed to be periodically distributed and identical in each layer.
The purpose of this work is an investigation of opportunities for the enhancement in the thermopower and power factor of porous structures with all-scale hierarchical disorder in the size of the pores, which are assumed randomly dispersed throughout the matrix material. We will examine how the presence of randomly distributed pores can vary electrical conductivity and the Seebeck coefficient of porous materials, aiding the design of better thermoelectric materials with higher figure-of-merit ZT. Since a porous medium has a high surface area per unit volume, it is very important to take into account the possibility of trapping for free charge carriers in deep energetic states localized at pore/medium interfaces. For definiteness and simplicity, we will restrict ourselves to the consideration of n-type isotropic thermoelectric host material with single parabolic conduction band. As in Ref. Reference Tarkhanyan and Niarchos17, we will neglect possible changes in the carrier effective mass due to the band bend at pore–medium interfaces and assume that there are no charge carriers inside the pores, which are hollow or filled by insulating nano- or microinclusions. In other words, the pore boundaries are considered as energy barriers with high-scattering potential so as the low energy electrons scatter strongly (i.e., the transmission probability is negligible), while the high-energy ones are practically unaffected. We will show that in the presence of pores of different size scales in the same host material, it is possible to achieve a considerable improvement in the Seebeck coefficient (S) over its value in the bulk material. The enhancement in S in this case is stronger than in a multilayer composite, different layers of which contain only pores of a single length-scale. The enhancement in power factor (P) is only possible if the relative growth in S exceeds a definite critical value, which depends on the position of the Fermi energy. We will determine these critical values for both nondegenerate and degenerately doped porous semiconductors.
The paper is organized as follows: in the next section, the details of modeling for a porous material with randomly distributed spherical nonoverlapping hollow pores of different size scales are given, and the porosity of such a material is determined on the base of the gamma distribution for pore sizes. In Sec. III, the presence of trap centers localized at interfaces of the pores is taken into account, and their influence on the chemical potential is examined in both nondegenerate and degenerately doped porous semiconductors. In Sec. IV, we derive an analytical expression for the power factor in the presence of different groups of pores with various length-scales in host material, at the arbitrary level of the Fermi energy. In Sec. V, we examine the peculiarities of the Seebeck coefficient, electrical conductivity, and power factor in limiting cases of nondegenerate and degenerately doped materials and show that the presence of hollow pores with all-scale hierarchical disorder leads to a considerable enhancement in the thermopower. The necessary conditions for the enhancement of the power factor are found. In Sec. VI, we consider the effective thermopower and electrical conductivity of a multilayer composite consisting of alternating layers of various porosities with pores of the same size scale in each layer and show that when the pores of different size scales are situated in the same host material, it is possible to achieve stronger enhancement in both S and P than in the multilayer composite. Finally, in Sec. VII, we make concluded remarks.
II. PORE SIZE DISTRIBUTION AND NET POROSITY
Consider a porous medium in the presence of different groups of nonoverlapping spherical hollow pores with various size scales, e.g., nanoscale pores with randomly distributed pore diameters d 1 < 100 nm around average diameter  $\overline {{d_1}}$, microscale ones with diameters d 3 ≥ 1 μm around average diameter
 $\overline {{d_3}}$, and pores with intermediate size diameters d 2 around average diameter
 $\overline {{d_2}}$ (Fig. 1). As in Refs. Reference Tarkhanyan and Niarchos15 and Reference Tarkhanyan, Ioannidou and Niarchos16, we assume that the pore size distribution in each group is described by probability density function
 $$f\left( {{\rho _i}} \right) = {{N\left( {{\rho _i}} \right)} \over {{N_i}}} = {{{\rho _i}^{{\alpha _i} - 1}\exp \left( {{{ - {\rho _i}} \mathord{\left/ {\vphantom {{ - {\rho _i}} {{\beta _i}}}} \right. \kern-\nulldelimiterspace} {{\beta _i}}}} \right)} \over {\beta _i^{{\alpha _i}}\Gamma \left( {{\alpha _i}} \right)}},\quad i = 1,\,2,\,3\quad ,$$
where  $\rho _i = {{d_i } \mathord{\left/ {\vphantom {{d_i } {\overline {d_i } }}} \right. \kern-\nulldelimiterspace} {\overline {d_i } }}$ are the nondimensional diameters, N(ρi)dρi is the number of pores with given size scale in the interval, ρi,ρi + dρi,N i is the total number of pores in the group, αi > 1 and βi are the “shape” and “scale” parameters of the gamma distribution, respectively,Reference Jambunathan18 and Γ(αi) is the gamma function (the Euler integral of the second kind). The mean (first moment) and variance of the distribution are given by αiβi = 1 and
 ${\alpha _i}\beta _i^2 = \alpha _i^{ - 1}$, respectively, using which for the second and third moments of the distribution, one can obtainReference Tarkhanyan and Niarchos15,Reference Tarkhanyan, Ioannidou and Niarchos16
 $$\overline {\rho _i^2} = 1 + \alpha _i^{ - 1}\quad ,$$
 $$\overline {\rho _i^3} = {{\beta _i^3\Gamma \left( {{\alpha _i} + 3} \right)} \over {\Gamma \left( {{\alpha _i}} \right)}} = {{\left( {{\alpha _i} + 1} \right)\left( {{\alpha _i} + 2} \right)} \over {\alpha _i^2}}\quad .$$
Schematic illustration of the medium with randomly distributed nano, intermediate, and microscale pores.

Note that if the standard deviation  $\alpha _i^{ - 1/2}\overline {{\rho _i}}$ is much less than the mean, i.e., when
 $\alpha _i^{1/2} \gg 1$, the distribution function
 $f\left( {{\rho _i}} \right) \sim \delta \left( {{\rho _i} - \overline {{\rho _i}} } \right)$. The porosity φi of each group is given by
 $${\varphi _i} = {{{V_i}} \mathord{\left/ {\vphantom {{{V_i}} V}} \right. \kern-\nulldelimiterspace} V} = {{\pi {c_i}{{\overline {{d_i}} }^3}\overline {\rho _i^3} } \mathord{\left/ {\vphantom {{\pi {c_i}{{\overline {{d_i}} }^3}\overline {\rho _i^3} } 6}} \right. \kern-\nulldelimiterspace} 6}\quad ,$$
where V is the total volume of the sample.
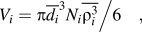 $${V_i} = {{\pi {{\overline {{d_i}} }^3}{N_i}\overline {\rho _i^3} } \mathord{\left/ {\vphantom {{\pi {{\overline {{d_i}} }^3}{N_i}\overline {\rho _i^3} } 6}} \right. \kern-\nulldelimiterspace} 6}\quad ,$$
is the net volume of the pores with given size scale, and c i = N i/V is the number density (concentration) of the pores. It is evident that the net porosity of the material is given by
 $$\varphi = \mathop\sum\limits_i {{\varphi _i}} \quad .$$
III. EFFECTIVE POROSITY AND FERMI ENERGY IN THE PRESENCE OF INTERFACE TRAP CENTERS
In porous materials under consideration, free charge carriers are absent not only inside the pores but also in a small spherical region around the pores due to the presence of deep surface states, which act as electron traps. These trap centers are situated at pore/medium interfaces and are characterized by localized energy E tr near or above the middle of the band gap. Total number of traps per pore is then  $\pi d_i^2{N_{\rm{s}}}$, where N s is the areal density of trap centers. Consequently, the volume density of traps localized at interfaces of the pores with given size scale is equal to
 $${N_{{\rm{tr}},i}} = \pi d_i^2{N_{\rm{s}}}{c_i} = {{6{\varphi _i}{N_{\rm{s}}}\rho _i^2} \mathord{\left/ {\vphantom {{6{\varphi _i}{N_{\rm{s}}}\rho _i^2} {\overline {{d_i}} \overline {\rho _i^3} }}} \right. \kern-\nulldelimiterspace} {\overline {{d_i}} \overline {\rho _i^3} }}\quad ,$$
where c i is eliminated with the use of Eq. (4). Usually N tr,i « N D, where N D is the net density of shallow donors with energy of ionization εD. In the temperature range εD < k BT < εG/2, where εG is the width of the band gap, all the donors are assumed to be ionized and then the density of electrons in bulk material  ${n_0} \cong {N_{\rm{D}}}$. In porous material, as electrons are trapped, spherical regions depleted of free electrons are forming around the pores. Assuming that all trap states are filled by frozen-in electrons and there is no thermal emission from these states, the condition of electrical neutrality can be written as
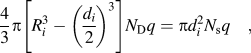 $${4 \over 3}\pi \left[ {R_i^3 - {{\left( {{{{d_i}} \over 2}} \right)}^3}} \right]{N_{\rm{D}}}q = \pi d_i^2{N_{\rm{s}}}q\quad ,$$
using which for the radius of the depleted region, one can obtain
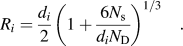 $${R_i} = {{{d_i}} \over 2}{\left( {1 + {{6{N_{\rm{s}}}} \over {{d_i}{N_{\rm{D}}}}}} \right)^{{1 \mathord{\left/ {\vphantom {1 3}} \right. \kern-\nulldelimiterspace} 3}}}\quad .$$
Thus, the volume per pore with no mobile electron is equal to V p,i(1 + 6N s/N Dd i), where  $V_{{\rm{p}},i} = {{\pi d_i^3 } \mathord{\left/ {\vphantom {{\pi d_i^3 } 6}} \right. \kern-\nulldelimiterspace} 6}$ is a pore volume. Introducing now “effective porosity” with respect to mobile electrons for each group of the pores
 $${\phi _i} = {\varphi _i}\left[ {1 + {{6{N_{\rm{s}}}\overline {\rho _i^2} } \over {{N_{\rm{D}}}\overline {{d_i}} \overline {\rho _i^3} }}} \right]\quad ,$$
for the net effective porosity and the effective density of free electrons in porous material we obtain, respectively,
 $$\phi \equiv \sum\limits_i {{\phi _i}} = \varphi + {\varphi _{{\rm{tr}}}}\quad ,$$
and
 $$n = {n_0}\left( {1 - \phi } \right)\quad ,$$
where
 $${\varphi _{{\rm{tr}}}} = {{6{N_{\rm{s}}}} \over {{N_{\rm{D}}}}}g,\quad g \equiv \mathop\sum\limits_{i = 1}^3 {{{{\alpha _i}{\varphi _i}} \over {\left( {{\alpha _i} + 2} \right)\overline {{d_i}} }}} \quad .$$
Thus, the presence of pores and traps leads to a reduction of free charge carriers' density with respect to that in bulk material with zero porosity and consequently to the shifting of the Fermi energy and modification of all transport coefficients. Consider, for example, n-type isotropic material with a single parabolic conduction band. The density of electrons at the arbitrary level of the Fermi energy is given by
 $$n = {{{{\left( {2{m^*}{k_{\rm{B}}}T} \right)}^{3/2}}} \over {2{\pi ^2}{\hbar ^3}}}{F_{1/2}}\left( {{\zeta ^*}} \right)\quad ,$$
where m ∗ is the effective mass, k B is the Boltzmann constant, T is the absolute temperature, h is the Planck constant, ζ is the chemical potential relative to the conduction band edge, ζ∗ ≡ ζ/k BT is the reduced chemical potential, and
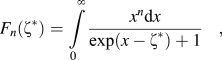 $${F_n}\left( {{\zeta ^*}} \right) = \int\limits_0^\infty {{{{x^n}{\rm{d}}x} \over {\exp \left( {x - {\zeta ^*}} \right) + 1}}} \quad ,$$
is the Fermi integral. Using Eq. (11b) in the case of nondegenerate semiconductors, where exp(−ζ∗) » 1, for the reduced chemical potential, we obtain
 $${\zeta ^*} = \zeta _0^* + \ln \left( {1 - \phi } \right)\quad ,$$
where
 $$\zeta _0^* = - \ln \left( {{{{N_{\rm{c}}}} \mathord{\left/ {\vphantom {{{N_{\rm{c}}}} {{n_0}}}} \right. \kern-\nulldelimiterspace} {{n_0}}}} \right)\quad ,$$
is the reduced chemical potential in bulk material with zero porosity, and
 $${N_{\rm{c}}} = {{2{{\left( {2\pi {m^*}{k_{\rm{B}}}T} \right)}^{{3 \mathord{\left/ {\vphantom {3 2}} \right. \kern-\nulldelimiterspace} 2}}}} \mathord{\left/ {\vphantom {{2{{\left( {2\pi {m^*}{k_{\rm{B}}}T} \right)}^{{3 \mathord{\left/ {\vphantom {3 2}} \right. \kern-\nulldelimiterspace} 2}}}} {{h^3}}}} \right. \kern-\nulldelimiterspace} {{h^3}}}\quad ,$$
is the effective density of states in the conduction band. Since ζ0 is negative, from Eq. (15a), one can conclude that the presence of porosity leads to the enhancement in the absolute value of the Fermi level. Unlike this, in the case of degenerately doped materials, where exp(ζ∗) » 1, the Fermi energy decreases:
 $$\zeta = {\zeta _0}{\left( {1 - \phi } \right)^{{2 \mathord{\left/ {\vphantom {2 3}} \right. \kern-\nulldelimiterspace} 3}}}\quad ,$$
Here
 $${\zeta _0} = \varepsilon _{\rm{F}}^0\left[ {1 - {{{\pi ^2}} \over {12}}{{\left( {{{{k_{\rm{B}}}T} \over {\varepsilon _{\rm{F}}^0}}} \right)}^2}} \right]\quad ,$$
where
 $$\varepsilon _{\rm{F}}^0 = {{{\hbar ^2}} \over {2{m^*}}}{\left( {3{\pi ^2}{n_0}} \right)^{{2 \mathord{\left/ {\vphantom {2 3}} \right. \kern-\nulldelimiterspace} 3}}}\quad ,$$
is the Fermi energy at T = 0 K.
IV. POWER FACTOR IN THE PRESENCE OF DIFFERENT GROUPS OF PORES WITH VARIOUS SIZE SCALES
Consider now a composite with all-scale hierarchical disorder in pore sizes, e.g., a material consisting of different phases: host porous medium with volume fraction 1 − φ and different groups of nanoscale and microscale insulating particles (or hollow pores) with volume fractions φi. We will use classical expressions for the Seebeck coefficient and electrical conductivity based on the solution of the Boltzmann transport equation under relaxation time approximation. They can be written in the form
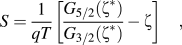 $$S = {1 \over {qT}}\left[ {{{{G_{{5 \mathord{\left/ {\vphantom {5 2}} \right. \kern-\nulldelimiterspace} 2}}}\left( {{\zeta ^*}} \right)} \over {{G_{{3 \mathord{\left/ {\vphantom {3 2}} \right. \kern-\nulldelimiterspace} 2}}}\left( {{\zeta ^*}} \right)}} - \zeta } \right]\quad ,$$
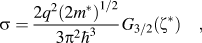 $$\sigma = {{2{q^2}{{\left( {2{m^*}} \right)}^{{1 \mathord{\left/ {\vphantom {1 2}} \right. \kern-\nulldelimiterspace} 2}}}} \over {3{\pi ^2}{\hbar ^3}}}{G_{{3 \mathord{\left/ {\vphantom {3 2}} \right. \kern-\nulldelimiterspace} 2}}}\left( {{\zeta ^*}} \right)\quad ,$$
using which for the power factor, one can obtain
 $$P = {{2{{\left( {2{m^*}} \right)}^{{1 \mathord{\left/ {\vphantom {1 2}} \right. \kern-\nulldelimiterspace} 2}}}} \over {3{\pi ^2}{\hbar ^3}{T^2}}}{{{{\left( {{G_{{5 \mathord{\left/ {\vphantom {5 2}} \right. \kern-\nulldelimiterspace} 2}}} - \zeta {G_{{3 \mathord{\left/ {\vphantom {3 2}} \right. \kern-\nulldelimiterspace} 2}}}} \right)}^2}} \over {{G_{{3 \mathord{\left/ {\vphantom {3 2}} \right. \kern-\nulldelimiterspace} 2}}}}}\quad ,$$
where
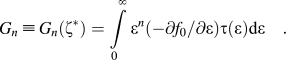 $${G_n} \equiv {G_n}\left( {{\zeta ^*}} \right) = \int\limits_0^\infty {{\varepsilon ^n}\left( {{{ - \partial {f_0}} \mathord{\left/ {\vphantom {{ - \partial {f_0}} {\partial \varepsilon }}} \right. \kern-\nulldelimiterspace} {\partial \varepsilon }}} \right)\tau \left( \varepsilon \right){\rm{d}}\varepsilon \quad .}$$
 $f_0 \left( {\varepsilon ,T} \right) = \left( {{\rm{exp}}\left[ {{{\left( {\varepsilon - \zeta } \right)} \mathord{\left/ {\vphantom {{\left( {\varepsilon - \zeta } \right)} {k_{\rm{B}} T}}} \right. \kern-\nulldelimiterspace} {k_{\rm{B}} T}}} \right] + 1} \right)^{ - 1}$ is the Fermi distribution function, and τ(ε) is the combined relaxation time. Using Matthiessen's rule for scattering events, which are independent from each other, τ(ε) can be expressed asReference Ziman19–Reference Lundstrom22
 $${\tau ^{ - 1}} = \tau _{\rm{b}}^{ - 1} + \tau _1^{ - 1} + \tau _2^{ - 1} + \tau _3^{ - 1}\quad ,$$
where τb is the electronic momentum relaxation time in the bulk matrix, and τi (i = 1, 2, 3) is that due to scattering at pore/medium interfaces. To find the relaxation time, let us estimate electron mean free path (MFP). When a charge carrier travels a distance L, the average number of its collisions with pores of given size scale is equal to
 $${\gamma _i} = L{A_i}{c_i}\quad ,$$
where
 $${A_i} = {{\pi \overline {d_i^2} } \mathord{\left/ {\vphantom {{\pi \overline {d_i^2} } 4}} \right. \kern-\nulldelimiterspace} 4} = \pi {\overline {{d_i}} ^2}{{\left( {1 + {\alpha _i}} \right)} \mathord{\left/ {\vphantom {{\left( {1 + {\alpha _i}} \right)} {4{\alpha _i}\quad ,}}} \right. \kern-\nulldelimiterspace} {4{\alpha _i}\quad ,}}$$
is the average classical cross-sectional area. Therefore,
 $${\Lambda _i} = {L \mathord{\left/ {\vphantom {L {{\gamma _i}}}} \right. \kern-\nulldelimiterspace} {{\gamma _i}}} = {\left( {{A_i}{c_i}} \right)^{ - 1}}\quad ,$$
and then τi can be found as
 $${\tau _i} = {{{\Lambda _i}} \over v} = {{\left( {{\alpha _i} + 2} \right)\overline {{d_i}} {{\left( {2{m^*}} \right)}^{{1 \mathord{\left/ {\vphantom {1 2}} \right. \kern-\nulldelimiterspace} 2}}}} \over {3{\alpha _i}{\varphi _i}}}{\varepsilon ^{{{ - 1} \mathord{\left/ {\vphantom {{ - 1} 2}} \right. \kern-\nulldelimiterspace} 2}}}\quad ,$$
where v = v(ε) is the electronic velocity. Thus, from Eq. (23) for the combined relaxation time, we obtain
 $$\tau \left( \varepsilon \right) = {{{\tau _{\rm{b}}}} \over {1 + 3g{\tau _{\rm{b}}}{{\left( {{\varepsilon \mathord{\left/ {\vphantom {\varepsilon {2{m^*}}}} \right. \kern-\nulldelimiterspace} {2{m^*}}}} \right)}^{{1 \mathord{\left/ {\vphantom {1 2}} \right. \kern-\nulldelimiterspace} 2}}}}}\quad ,$$
where g is given in Eq. (12). For definiteness, we will further consider the case of relatively low impurity concentrations, so that the main contribution in the carrier relaxation time at zero porosity is from the scattering on deformation potential of acoustic phonons. Then, settingReference Ziman19,Reference Ansel'm20
 $${\tau _{\rm{b}}} = a{\varepsilon ^{{{ - 1} \mathord{\left/ {\vphantom {{ - 1} 2}} \right. \kern-\nulldelimiterspace} 2}}}\quad ,$$
where
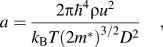 $$a = {{2\pi {\hbar ^4}\rho {u^2}} \over {{k_{\rm{B}}}T{{\left( {2{m^*}} \right)}^{{3 \mathord{\left/ {\vphantom {3 2}} \right. \kern-\nulldelimiterspace} 2}}}{D^2}}}\quad ,$$
is the constant for acoustic phonons, ρ is the mass density, u is the longitudinal velocity of the sound, and D is the deformation potential constant, Eq. (28) can be transformed to the form
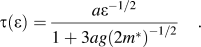 $$\tau \left( \varepsilon \right) = {{a{\varepsilon ^{{{ - 1} \mathord{\left/ {\vphantom {{ - 1} 2}} \right. \kern-\nulldelimiterspace} 2}}}} \over {1 + 3ag{{\left( {2{m^*}} \right)}^{{{ - 1} \mathord{\left/ {\vphantom {{ - 1} 2}} \right. \kern-\nulldelimiterspace} 2}}}}}\quad .$$
Substituting Eq. (31) into Eqs. (19)–(21), we obtain the following expressions:
 $$S = {{{k_{\rm{B}}}} \over q}\left[ {{{2{F_1}\left( {{\zeta ^*}} \right)} \over {{F_0}\left( {{\zeta ^*}} \right)}} - {\zeta ^*}} \right]\quad ,$$
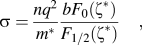 $$\sigma = {{n{q^2}} \over {{m^*}}}{{b{F_0}\left( {{\zeta ^*}} \right)} \over {{F_{1/2}}\left( {{\zeta ^*}} \right)}}\quad ,$$
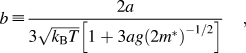 $$b \equiv {{2a} \over {3\sqrt {{k_{\rm{B}}}T} \left[ {1 + 3ag{{(2{m^*})}^{ - 1/2}}} \right]}}\quad ,$$
and
 $$P = {{nbk_{\rm{B}}^2{{\left[ {2{F_1}\left( {{\zeta ^*}} \right) - {\zeta ^*}{F_0}\left( {{\zeta ^*}} \right)} \right]}^2}} \over {{m^*}{F_0}\left( {{\zeta ^*}} \right){F_{{1 \mathord{\left/ {\vphantom {1 2}} \right. \kern-\nulldelimiterspace} 2}}}\left( {{\zeta ^*}} \right)}}\quad ,$$
where F n(ζ∗) is given in Eq. (14). Eqs. (32)–(35) for the transport coefficients are valid for an arbitrary level of the Fermi energy.
V. ENHANCEMENT OF THE THERMOPOWER AND POWER FACTOR IN NONDEGENERATE AND DEGENERATELY DOPED POROUS COMPOSITES WITH ALL-SCALE HIERARCHICAL DISORDER
In this section, we will examine peculiarities of the power factor in two limiting cases.
A. Nondegenerate limit
Let us begin from the case of nondegenerate bulk materials with zero porosity. For such a material from Eqs. (32)–(35), one can find well-known classical resultsReference Ziman19–Reference Yu and Cardona24
 $${S_0} = {{{k_{\rm{B}}}} \over q}\left( {2 - \zeta _0^*} \right)\quad ,$$
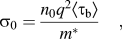 $${\sigma _0} = {{{n_0}{q^2}\left\langle {{\tau _{\rm{b}}}} \right\rangle } \over {{m^*}}}\quad ,$$
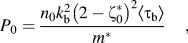 $${P_0} = {{{n_0}k_{\rm{b}}^2{{\left( {2 - \zeta _0^*} \right)}^2}\left\langle {{\tau _{\rm{b}}}} \right\rangle } \over {{m^*}}}\quad ,$$
where  $\zeta _0^*$ is given by Eq. (15b) and
 $$\left\langle {{\tau _{\rm{b}}}} \right\rangle = {{4a} \over {3\sqrt {\pi {k_{\rm{B}}}T} }}\quad .$$
For porous materials under consideration, Eqs. (32)–(35) with the use of Eqs. (13) and (15a) are transformed to the form
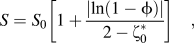 $$S = {S_0}\left[ {1 + {{\left| {\ln \left( {1 - \phi } \right)} \right|} \over {2 - \zeta _0^*}}} \right]\quad ,$$
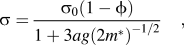 $$\sigma = {{{\sigma _0}\left( {1 - \phi } \right)} \over {1 + 3ag{{\left( {2{m^*}} \right)}^{{{ - 1} \mathord{\left/ {\vphantom {{ - 1} 2}} \right. \kern-\nulldelimiterspace} 2}}}}}\quad ,$$
 $$P = {{{P_0}\left( {1 - \phi } \right)} \over {1 + 3ag{{\left( {2{m^*}} \right)}^{{{ - 1} \mathord{\left/ {\vphantom {{ - 1} 2}} \right. \kern-\nulldelimiterspace} 2}}}}}{\left[ {1 + {{\left| {\ln \left( {1 - \phi } \right)} \right|} \over {2 + \ln \left( {{{{N_{\rm{c}}}} \mathord{\left/ {\vphantom {{{N_{\rm{c}}}} {{n_0}}}} \right. \kern-\nulldelimiterspace} {{n_0}}}} \right)}}} \right]^2}\quad ,$$
where ϕ and g are given by Eqs. (11a) and (12).
For relative growth of S and relative change in power factor in this nondegenerate approximation, we obtain
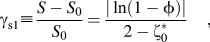 $${\gamma _{{\rm{s}}1}} \equiv {{S - {S_0}} \over {{S_0}}} = {{|\ln \left( {1 - \phi } \right)|} \over {2 - \zeta _0^*}}\quad ,$$
and
 $${\gamma _{{\rm{p}}1}} \equiv {{P - {P_0}} \over {{P_0}}} = {{\left( {1 - \phi } \right){{\left( {{\gamma _{s1}} + 1} \right)}^2}} \over {1 + 3ag{{\left( {2{m^*}} \right)}^{{{ - 1} \mathord{\left/ {\vphantom {{ - 1} 2}} \right. \kern-\nulldelimiterspace} 2}}}}} - 1\quad ,$$
respectively. Before that to examine physical consequences of these equations, let us consider opposite limiting case too.
B. Strongly degenerate limit
For degenerately doped materials from Eqs. (32)–(35), we obtain
 $$S = {S_0}{\left( {1 - \phi } \right)^{{{ - 2} \mathord{\left/ {\vphantom {{ - 2} 3}} \right. \kern-\nulldelimiterspace} 3}}}\quad ,$$
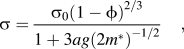 $$\sigma = {{{\sigma _0}{{\left( {1 - \phi } \right)}^{{2 \mathord{\left/ {\vphantom {2 3}} \right. \kern-\nulldelimiterspace} 3}}}} \over {1 + 3ag{{\left( {2{m^*}} \right)}^{{{ - 1} \mathord{\left/ {\vphantom {{ - 1} 2}} \right. \kern-\nulldelimiterspace} 2}}}}}\quad ,$$
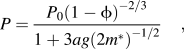 $$P = {{{P_0}{{\left( {1 - \phi } \right)}^{{{ - 2} \mathord{\left/ {\vphantom {{ - 2} 3}} \right. \kern-\nulldelimiterspace} 3}}}} \over {1 + 3ag{{\left( {2{m^*}} \right)}^{{{ - 1} \mathord{\left/ {\vphantom {{ - 1} 2}} \right. \kern-\nulldelimiterspace} 2}}}}}\quad ,$$
where S 0, σ0, and P 0 are the corresponding quantities for strongly degenerate bulk material of zero porosity:
 $${S_0} = {{{\pi ^2}k_{\rm{B}}^2T} \over {3q\varepsilon _{\rm{F}}^0}}\quad ,$$
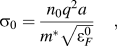 $${\sigma _0} = {{{n_0}{q^2}a} \over {{m^*}\sqrt {\varepsilon _F^0} }}\quad ,$$
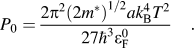 $${P_0} = {{2{\pi ^2}{{\left( {2{m^*}} \right)}^{{1 \mathord{\left/ {\vphantom {1 2}} \right. \kern-\nulldelimiterspace} 2}}}ak_{\rm{B}}^4{T^2}} \over {27{\hbar ^3}\varepsilon _{\rm{F}}^0}}\quad .$$
Relative growth in S and relative change in power factor in this case are given by
 $${\gamma _{{\rm{s}}2}} = {\left( {1 - \phi } \right)^{{{ - 2} \mathord{\left/ {\vphantom {{ - 2} 3}} \right. \kern-\nulldelimiterspace} 3}}} - 1\quad ,$$
and
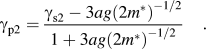 $${\gamma _{{\rm{p}}2}} = {{{\gamma _{{\rm{s}}2}} - 3ag{{\left( {2{m^*}} \right)}^{{{ - 1} \mathord{\left/ {\vphantom {{ - 1} 2}} \right. \kern-\nulldelimiterspace} 2}}}} \over {1 + 3ag{{\left( {2{m^*}} \right)}^{{{ - 1} \mathord{\left/ {\vphantom {{ - 1} 2}} \right. \kern-\nulldelimiterspace} 2}}}}}\quad .$$
According to both Eqs. (40) and (45), the presence of hollow pores of different size scales leads to the enhancement in the thermopower with respect to its value in the bulk material with zero porosity. The enhancement in the absolute value of the Seebeck coefficient and the reduction in electrical conductivity depend on the net effective porosity ϕ. Despite the quite different form of expressions in the right sides of Eqs. (43) and (51), the relative growth of S in both these cases increases monotonically with increasing of the porosity and also (at the given value of the ratio N s/N D) with decreasing of characteristic pore sizes  $\overline {{d_i}}$ [see Eq. (12) for φtr]. Except that, γs depends also on the shape parameters of the gamma distribution and increases slightly with increasing of all three parameters αi.
It is evident that because of the reduction in conductivity, the enhancement in S is not sufficient for the enhancement of the power factor. Indeed, from Eqs. (44) and (52), we conclude that an enhancement in power factor is only possible if the relative growth in S exceeds a definite critical value:
 $${\gamma _{{\rm{s}}1}} > \sqrt {{{1 + 3ag{{\left( {2{m^*}} \right)}^{{{ - 1} \mathord{\left/ {\vphantom {{ - 1} 2}} \right. \kern-\nulldelimiterspace} 2}}}} \over {1 - \phi }}} - 1\quad ,$$
in nondegenerate limit and
 $${\gamma _{{\rm{s}}2}} > 3ag{\left( {2{m^*}} \right)^{{{ - 1} \mathord{\left/ {\vphantom {{ - 1} 2}} \right. \kern-\nulldelimiterspace} 2}}}\quad ,$$
in degenerate limit. In the case when the porosity is governed by one length-scale, the conditions (53) and (54) can be rewritten in the form
 $$|\ln \left( {1 - \phi } \right)| > \left( {2 - \zeta _0^*} \right)\left[ {\sqrt {{{\left( {1 + \Gamma \phi } \right)} \mathord{\left/ {\vphantom {{\left( {1 + \Gamma \phi } \right)} {1 - \phi }}} \right. \kern-\nulldelimiterspace} ({1 - \phi) }}} - 1} \right]\quad ,$$
 $$\phi > 1 - {\left( {1 + \Gamma \phi } \right)^{{{ - 3} \mathord{\left/ {\vphantom {{ - 3} 2}} \right. \kern-\nulldelimiterspace} 2}}}\quad ,$$
where
 $$\Gamma = 3a{g_0}{\left( {2{m^*}} \right)^{{{ - 1} \mathord{\left/ {\vphantom {{ - 1} 2}} \right. \kern-\nulldelimiterspace} 2}}}{\left( {1 + {{6{g_0}{N_{\rm{s}}}} \mathord{\left/ {\vphantom {{6{g_0}{N_{\rm{s}}}} {{N_{\rm{D}}}}}} \right. \kern-\nulldelimiterspace} {{N_{\rm{D}}}}}} \right)^{ - 1}}\quad ,$$
a is a nondimensional positive parameter and
 $${g_0} = {\alpha \mathord{\left/ {\vphantom {\alpha {\left( {\alpha + 2} \right)}}} \right. \kern-\nulldelimiterspace} {\left( {\alpha + 2} \right)}}\bar d\quad .$$
We have to recollect that the modulus of the reduced chemical potential in n-type nondegenerate semiconductors satisfies condition  $\exp |\zeta _0^*| \gg 1$. Taking these fact into account and carrying out a careful numerical examination, it is not difficult to be convinced that in nondegenerate porous semiconductors, both conditions (53) and (53a) are practically unrealizable, i.e., the increase of the Seebeck coefficient does not compensate the decrease in electrical conductivity. As to the case of a material with strongly degenerated electronic gas, the fulfillment of condition (54a) depends on the value of parameter Γ. At a given value of the effective porosity
 $\phi$, the enhancement of the power factor occurs only if
 $$\Gamma \lt {\phi ^{ - 1}}\left[ {{{\left( {1 - \phi } \right)}^{{{ - 2} \mathord{\left/ {\vphantom {{ - 2} 3}} \right. \kern-\nulldelimiterspace} 3}}} - 1} \right]\quad .$$
In Fig. 2 are presented the graphs of the function  $f\left( \phi \right) = 1 - {\left( {1 + \Gamma \phi } \right)^{ - 3/2}}$ in the right-hand side of Eq. (54a) for four different values of Γ. A numerical analysis shows that at Γ ≤ 0.666 the condition (54a) is satisfied for all possible values of ϕ. At Γ = 0.67, 0.7, and 0.8, such a situation occurs only if ϕ > 0.006, 0.054, and 0.167, respectively. Thus, at Γ > 2/3, there is a minimum value
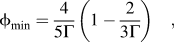 $${\phi _{{\rm{min}}}} = {4 \over {5\Gamma }}\left( {1 - {2 \over {3\Gamma }}} \right)\quad ,$$
so as the enhancement of the power factor occurs only if the porosity ϕ > ϕmin.
Graphs of the function  $f\left( \phi \right) = 1 - {\left( {1 + \Gamma \phi } \right)^{ - 3/2}}$ for four different values of Γ.
Note that at small enough porosity values for which Γϕ « 1, Eq. (54a) gives Γ < 2/3. This inequality means that in the case when the ratio N s/N D ≥ 3a/4(2m ∗)1/2, the enhancement of the power factor becomes possible at an arbitrary value of  $\overline d$. In the opposite case when
 $${{{N_{\rm{s}}}} \mathord{\left/ {\vphantom {{{N_{\rm{s}}}} {{N_{\rm{D}}}}}} \right. \kern-\nulldelimiterspace} {{N_{\rm{D}}}}} \lt {{{3a} \mathord{\left/ {\vphantom {{3a} {4\left( {2{m^*}} \right)}}} \right. \kern-\nulldelimiterspace} {4\left( {2{m^*}} \right)}}^{{1 \mathord{\left/ {\vphantom {1 2}} \right. \kern-\nulldelimiterspace} 2}}}\quad ,$$
the enhancement of the power factor in degenerate semiconductors with small porosity occurs only if the average pore diameter satisfies the condition  $\overline d > {d_{{\rm{min}}}}$ where
 $${d_{{\rm{min}}}} = {{6\alpha } \over {\left( {\alpha + 2} \right)}}\left( {{{3a} \over {4{{\left( {2{m^*}} \right)}^{{1 \mathord{\left/ {\vphantom {1 2}} \right. \kern-\nulldelimiterspace} 2}}}}} - {{{N_{\rm{s}}}} \over {{N_{\rm{D}}}}}} \right)\quad .$$
Let us take, e.g., N s = 109 cm−2, N D = 2.5 × 1016 cm−3, and m ∗ = 0.26m 0 = 2.366 × 10⁻³¹ kg (Si). For the constant a of acoustic phonons [see Eq. (30)] in Si at T = 200 K, one can find a = 1.16 × 10⁻²² kg1/2 m. Then, Eq. (54g) at “shape” parameter of the distribution, α = 5 gives  $\overline d > 0.54\mu {\rm{m}}$. Setting
 $\overline d = 0.6\mu {\rm{m}}$, we obtain g 0 = 1.19 × 10⁶m −1 and Γ = 0.6, i.e., in this case, the enhancement of the power factor can occur at any porosity in the range ϕ ≤ 15%.
VI. EFFECTIVE THERMOPOWER OF A MULTILAYER COMPOSITE WITH PORES OF VARIOUS SIZE SCALES IN DIFFERENT LAYERS
In the previous section, we have assumed that the pores of different size scales are distributed in the same layer of the thermoelectric material. It is extremely interesting to compare the enhancement of the Seebeck coefficient in such a material with that in multilayer composite consisting of alternating layers with various porosities and pores of different size scales when the pores in each layer have the same size scale. As before, the pores are assumed to be randomly distributed in the layers and described by probability density functions f(ρi) given by Eq. (1). For definiteness, we will consider again 3-layer composite: let one of the layers contains small (d < 100 nm) nanoscale pores with volume fraction φ1, the second one pores with intermediate size scale and volume fraction φ2, and the third layer contains microscale size pores with volume fraction φ3. The layers are assumed to be perpendicular to the direction of the temperature gradient and having the same volume and thickness. The latter is assumed significantly larger than the maximum value of electron MFP in the layers Λe,i. For example, in the case of classical electronic gas, one can find
 $${\Lambda _{{\rm{e}},i}} = {{\left\langle {{\tau _{\rm{b}}}} \right\rangle \sqrt {{{{{3{k_{\rm{B}}}T} \mathord{\left/ {\vphantom {{3{k_{\rm{B}}}T} m}} \right. \kern-\nulldelimiterspace} m}}^*}} } \over {1 + {{3a{\alpha _i}{\varphi _i}} \mathord{\left/ {\vphantom {{3a{\alpha _i}{\varphi _i}} {\left( {{\alpha _i} + 2} \right)}}} \right. \kern-\nulldelimiterspace} {\left( {{\alpha _i} + 2} \right)}}\overline {{d_i}} {{\left( {2{m^*}} \right)}^{{1 \mathord{\left/ {\vphantom {1 2}} \right. \kern-\nulldelimiterspace} 2}}}}}\quad ,$$
where a and  $\left\langle {{\tau _{\rm{b}}}} \right\rangle$ are given by Eqs. (30) and (39), respectively. Since in main thermoelectric materials Λe ∼ 10–100 nm at room temperatures,Reference Chen, Dresselhaus, Dresselhaus, Fleurial and Caillat25 it is evident that the layers with thickness ∼1 mm can be very suitable for experiments.
The electrical conductivity of the composite is given by
 $${\sigma _{\rm{c}}} = {\sigma _0}{\left( {\mathop\sum\limits_i {\left[ {{{1 + {{3a{\alpha _i}} \mathord{\left/ {\vphantom {{3a{\alpha _i}} {\left( {{\alpha _i} + 2} \right)}}} \right. \kern-\nulldelimiterspace} {\left( {{\alpha _i} + 2} \right)}}{{\left( {2{m^*}} \right)}^{{1 \mathord{\left/ {\vphantom {1 2}} \right. \kern-\nulldelimiterspace} 2}}}\overline {{d_i}} } \over {3{{\left( {1 - {\phi _i}} \right)}^{\rm{\nu }}}}}} \right]} } \right)^{ - 1}}\quad ,$$
where ν = 1 in nondegenerate case and ν = 2/3 in strongly degenerate limit.
Using the factReference Callen26,Reference de Groot and Mazur27 that the thermopower is equivalent to entropy per carrier per charge, and the entropy of a system in local equilibrium conditions is an additive quantity, in Ref. Reference Tarkhanyan and Niarchos17, it has been shown that the effective Seebeck coefficient of a multilayer composite can be expressed as
 $${S_{\rm{c}}} = {{\mathop\sum\limits_i {{n_i}{S_i}} } \mathord{\left/ {\vphantom {{\sum\limits_i {{n_i}{S_i}} } {\sum\limits_i {{n_i}} }}} \right. \kern-\nulldelimiterspace} {\mathop\sum\limits_i {{n_i}} }}\quad ,\quad i = 1,\,2,\,3\quad ,$$
where n i is the density of free charge carriers in the ith layer, and  ${S_i}$ is the thermopower of the corresponding single layer. Note that there is no discrepancy between different arrangements of the layers with distinct pore size scales. Assuming that the bulk density of electrons n 0 and the ratio N s/N D are constants, from Eq. (56) in nondegenerate case, we obtain
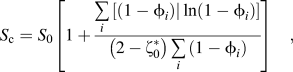 $${S_{\rm{c}}} = {S_0}\left[ {1 + {{\mathop\sum\limits_i {\left[ {\left( {1 - {\phi _i}} \right)|\ln \left( {1 - {\phi _i}} \right)} \right]} } \over {\left( {2 - \zeta _0^*} \right)\mathop\sum\limits_i {\left( {1 - {\phi _i}} \right)} }}} \right]\quad ,$$
and relative growth
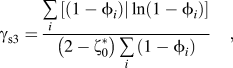 $${\gamma _{{\rm{s}}3}} = {{\mathop\sum\limits_i {\left[ {\left( {1 - {\phi _i}} \right)|\ln \left( {1 - {\phi _i}} \right)} \right]} } \over {\left( {2 - \zeta _0^*} \right)\mathop\sum\limits_i {\left( {1 - {\phi _i}} \right)} }}\quad ,$$
where
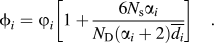 $${\phi _i} = {\varphi _i}\left[ {1 + {{6{N_{\rm{s}}}{\alpha _i}} \over {{N_{\rm{D}}}\left( {{\alpha _i} + 2} \right)\overline {{d_i}} }}} \right]\quad .$$
In strongly degenerate case, Eqs. (57) and (58) should be replaced by
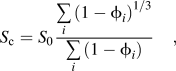 $${S_{\rm{c}}} = {S_0}{{\mathop\sum\limits_i {{{\left( {1 - {\phi _i}} \right)}^{{1 \mathord{\left/ {\vphantom {1 3}} \right. \kern-\nulldelimiterspace} 3}}}} } \over {\mathop\sum\limits_i {\left( {1 - {\phi _i}} \right)} }}\quad ,$$
 $${\gamma _{{\rm{s}}4}} = {{\mathop\sum\limits_i {{{\left( {1 - {\phi _i}} \right)}^{{1 \mathord{\left/ {\vphantom {1 3}} \right. \kern-\nulldelimiterspace} 3}}}} } \over {\mathop\sum\limits_i {\left( {1 - {\phi _i}} \right)} }} - 1\quad .$$
Using Eqs. (57) or (60) for the thermopower in common with Eq. (55b) for the electrical conductivity, it is not difficult to make analogical calculations for the power factor and its relative change. Furthermore, we will restrict ourselves to the consideration of the thermopower only.
Note that total porosity for ν-layer composite material containing layers of various volume V i and porosity φi is given by average porosity
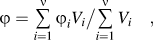 $$\varphi = {{\mathop\sum\limits_{i = 1}^{\rm{\nu }} {{\varphi _i}{V_i}} } \mathord{\left/ {\vphantom {{\sum\limits_{i = 1}^{\rm{\nu }} {{\varphi _i}{V_i}} } {\sum\limits_{i = 1}^{\rm{\nu }} {{V_i}} }}} \right. \kern-\nulldelimiterspace} {\mathop\sum\limits_{i = 1}^{\rm{\nu }} {{V_i}} }}\quad ,$$
where φiV i is the total volume of the pores in a layer with number i. If the layers have the same volume (V i = V 0), Eq. (62a) gives 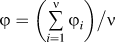 $\varphi = {{\left( {\mathop\sum\limits_{i = 1}^\nu {\varphi _i } } \right)} \mathord{\left/ {\vphantom {{\left( {\sum\limits_{i = 1}^\nu {\varphi _i } } \right)} \nu }} \right. \kern-\nulldelimiterspace} \nu }$ or for 3-layer composite
 $$\varphi = {{\left( {{\varphi _1} + {\varphi _2} + {\varphi _3}} \right)} \mathord{\left/ {\vphantom {{\left( {{\varphi _1} + {\varphi _2} + {\varphi _3}} \right)} 3}} \right. \kern-\nulldelimiterspace} 3}\quad .$$
A simple comparison of Eq. (58) with Eq. (43) and Eq. (61) with Eq. (51) shows that the enhancement in the absolute value of S in the multilayer composite is considerably less than that in single layer composite with multiscale size pores:
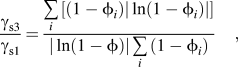 $${{{\gamma _{{\rm{s}}3}}} \over {{\gamma _{{\rm{s}}1}}}} = {{\mathop\sum\limits_i {\left[ {\left( {1 - {\phi _i}} \right)|\ln \left( {1 - {\phi _i}} \right)|} \right]} } \over {|\ln \left( {1 - \phi } \right)|\mathop\sum\limits_i {\left( {1 - {\phi _i}} \right)} }}\quad ,$$
in nondegenerate case and
 $${{{\gamma _{{\rm{s}}4}}} \over {{\gamma _{{\rm{s}}2}}}} = {{{{\left[ {\mathop\sum\limits_i {\left( {1 - {\phi _i}} \right)} } \right]}^{ - 1}}\mathop\sum\limits_i {{{\left( {1 - {\phi _i}} \right)}^{{1 \mathord{\left/ {\vphantom {1 3}} \right. \kern-\nulldelimiterspace} 3}}} - 1} } \over {{{\left( {1 - \phi } \right)}^{{{ - 2} \mathord{\left/ {\vphantom {{ - 2} 3}} \right. \kern-\nulldelimiterspace} 3}}} - 1}}\quad ,$$
in the case of strongly degenerate electronic gas. In Eqs. (63) and (64), ϕi and ϕ can be expressed by the same relations, which are given in Eqs. (10) and (11a), respectively. It is evident that to compare the enhancement in the thermopower of the 3-layer material and homogeneous material with the same volume fraction of the pores in each one, for the total porosity φ in Eq. (11a) must be used by the value given by Eq. (62b) so that the materials differ only in physical arrangement of the pores.
Setting, for example,  $\overline {{d_1}} = 10\;{\rm{nm}}$,
 $\overline {{d_2}} = 0.2\;\mu {\rm{m}}$,
 $\overline {{d_3}} = 1\;\mu {\rm{m}}$, α1 = 8, α2 = 6, α3 = 3, and φ1 = φ2 = φ3 = 0.05, from Eq. (63) at N s = 109 cm−2 and N D = 1016 cm−3, we obtain γs3/γs1 = 0.767. However, for heavily doped samples at N D = 2.5 × 1016 cm−3 and the same values of the other parameters, Eq. (64) gives γs4/γs2 = 0.886.
Thus, in both these limiting cases, the medium with multiscale size pores in the same host material provides stronger enhancement in the thermopower compared with that in layered composite in which each layer contains pores of single length-scale: more than 30% stronger enhancement in the case of nondegenerate electronic gas and ∼10% in strongly degenerate case.
It is not difficult to see that the enhancement in the material with multilength-scale pores exceeds that also in the case of an identical material with single-scale pores when they have the same total porosity. Really, the relative growth of the thermopower in a material with nondegenerate electronic gas and single-scale pores is given by
 $${\gamma _{\rm{s}}} = {{|\ln \left( {1 - {\phi _{\rm{s}}}} \right)|} \over {2 - \zeta _0^*}}\quad ,$$
where
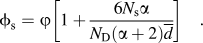 $${\phi _{\rm{s}}} = \varphi \left[ {1 + {{6{N_{\rm{s}}}\alpha } \over {{N_{\rm{D}}}\left( {\alpha + 2} \right)\overline d }}} \right]\quad .$$
A comparison of Eqs. (65a) and (43) shows immediately that the ratio γs/γs1 is always less than 1. For example, consider a material with monoscale pores described by  $\overline d = 0.2\;\mu {\rm{m}}$, α = 6, and φ = 0.05. Then for the same values N s = 109 cm−2 and N D = 1016 cm−3, one can find ϕs = 0.051 and γs/γs1 = 0.669. In the case of microscale pores with
 $\overline d = 1\;\mu {\rm{m}}$, α = 3, and the same porosity φ = 0.05, the ratio is γs/γs1 = 0.655. Thus, the medium with multiscale size pores provides ∼1.5 times stronger enhancement in the thermopower than a material with monoscale porosity.
It is evident that by combining the significant reduction of lattice thermal conductivity predicted in Refs. Reference Tarkhanyan and Niarchos15 and Reference Tarkhanyan, Ioannidou and Niarchos16 and possible enhancement in the power factor due to the increasing value of the thermopower, high thermoelectric performance of porous materials can be achieved.
VII. CONCLUSIONS
The main results of this paper can be summarized as follows:
(1) The presence of hollow pores of different size scales randomly distributed throughout the matrix thermoelectric material leads to the enhancement of the thermopower and the reduction of the electrical conductivity relative to their values in the bulk material with zero porosity.
(2) A theoretical model based on the gamma distribution of the pore sizes is proposed to calculate the changes in transport coefficients. The results show that high density of nano- and microscale pores could cause effective trapping of charge carriers, which leads to additional enhancement in the Seebeck coefficient and reduction in the electrical conductivity. Obviously, the influence of trapping on transport coefficients is especially sensible in nondegenerate semiconductors.
(3) Analytical expressions are found for the thermopower, electrical conductivity, and power factor for the porous material at the arbitrary level of the Fermi energy in the case when the main contribution in the carrier relaxation time at zero porosity is from the scattering on deformation potential of acoustic phonons.
(4) It is shown that the semiconductor with nondegenerate electronic gas and pores of different size scales in the same host material has an advantage with respect to a multilayer composite of different layers of which contain only pores of the same length-scale, since it provides stronger enhancement in the Seebeck coefficient.
(5) Simple expressions for relative growth of the Seebeck coefficient (γs) and change of the power factor (γp) are obtained for porous thermoelectric materials with nondegenerate and strongly degenerate electronic gas.
(6) Necessary conditions for γs are found at which thermoelectric power factor increases in spite of the reduction in electrical conductivity. It is shown that in nondegenerate porous semiconductors, the increase of the Seebeck coefficient does not compensate the decrease in electrical conductivity. Unlike this, in materials with strongly degenerate electronic gas, the enhancement in power factor occurs for all possible values of porosity ϕ, if nondimensional parameter Γ [given by Eq. (54b)] is less than 2/3.
(7) The relative growth of S increases monotonically with increasing of the volume fraction of the pores and decreasing of the average pore size. Except that, γs depends slightly on the shape parameters of the gamma distribution and increases with increasing of numerical values of these parameters.
ACKNOWLEDGMENT
The authors would like to acknowledge the financial support of the Project 2012 KRIPIS funded by the ESPA program 2007–2014.




