Elevated blood pressure (BP) is the leading risk factor for cardiovascular disease globally(Reference Vos, Lim and Abbafati1), and its prevalence is rising throughout the world, particularly in low- and middle-income countries (LMICs)(Reference Zhou, Perel and Mensah2). Gradual shifts in dietary patterns away from unprocessed foods, including fruits, vegetables, and whole grains, and towards ultra-processed foods (UPFs), which are ready-to-eat products containing little, or no, whole foods(Reference Monteiro, Cannon and Levy3), may explain much of the growing burden of elevated BP in LMICs(Reference Popkin and Ng4).
Recent studies, mostly from high-income settings, have reported a positive association between UPF intake and risk of hypertension(Reference Vitale, Costabile and Testa5), and two recent meta-analyses concluded that the evidence supporting a positive association between UPF intake and risk of hypertension was suggestive(Reference Lane, Gamage and Du6,Reference Dai, Wellens and Yang7) . UPFs tend to be higher in sodium and saturated fat and lower in dietary fibre than unprocessed foods(Reference Sneed, Ukwuani and Sommer8–Reference Martini, Godos and Bonaccio15). Persistently high intake of sodium, in particular, has been implicated in the development of elevated BP through reduction in kidney function via impairment of the renin–angiotensin–aldosterone system and an increase in extracellular fluid volume resulting from elevated plasma sodium concentrations(Reference He, Tan and Ma16). Additionally, UPFs are, on average, more energy dense and contain more added sugars than unprocessed foods(Reference Machado, Steele and Levy14,Reference Louzada, Martins and Canella17–Reference Martínez Steele, Baraldi and Louzada20) , and consumption of UPFs is positively associated with excess adiposity(Reference Juul, Martinez-Steele and Parekh21–Reference Liu, Steele and Li26), which may elevate BP through increased blood volume, compression of the kidneys and impaired renal function(Reference Hall, Do Carmo and Da Silva27).
Hypertension and other cardiometabolic diseases, which typically manifest in adulthood, may be linked to risk factors in adolescence(Reference Hong28,Reference Jacobs, Woo and Sinaiko29) , when UPF intake is often highest(Reference Marino, Puppo and Del Bo’30). However, the extent to which UPF intake influences BP as adolescents enter adulthood is underexamined. Studies among adolescents in Brazil and the USA have reported no association between the percentage of calories from UPFs and the prevalence of high BP(Reference Madalosso, Martins and Medeiros31,Reference Zhang, Jackson and Steele32) . However, these were cross-sectional and restricted to adolescents aged 12–17 years and 12–19 years, respectively. Considering the importance of adolescence and early adulthood for establishing long-term dietary patterns(Reference Neufeld, Andrade and Ballonoff Suleiman33) and its connection to cardiometabolic health across the life course(Reference Jacobs, Woo and Sinaiko29), there is a need for additional studies, particularly those with longitudinal designs, to understand whether UPF intake during this transitional period is implicated in the development of high BP and hypertension. This is especially urgent for young people in LMICs, where the availability of UPFs is increasing most rapidly(Reference Baker, Machado and Santos34).
The objective of this study was to estimate sex- and age-specific associations of UPF intake with BP during adolescence and early adulthood (15–25 years) in a metropolitan setting of the Philippines, a lower middle-income country in Southeast Asia. Considering how little is known about the UPF–BP relationship during this transitional period, including the existence of any lagged effects of UPF intake on BP, we examined the association of BP with concurrent UPF intake and with UPF intake estimated 3–4 years earlier, or lagged intake. We hypothesised that, among both males and females, systolic and diastolic BP (SBP and DBP, respectively) in adolescence and early adulthood was associated with concurrent and lagged UPF intake and that the strength of these associations increased with age.
Methods
Data and study setting
This study leveraged data from the Cebu Longitudinal Health and Nutrition Survey (CLHNS), a prospective cohort of 3080 singleton infants born in Metropolitan Cebu, Philippines between 1 May 1983 and 30 April 1984(Reference Adair, Popkin and Akin35). For this study, we used data from the 1998, 2002, 2005 and 2009 follow-up surveys, when participants were approximately 15, 18, 21 and 25 years old. A total of 2129 participants were enrolled across these four waves. The analytic sample included participants who had diet, BP and covariate information for one or more survey waves between 1998 and 2005 or who had BP measurements in 2002, 2005 or 2009 plus diet and covariate information for the preceding survey wave. Observations from participants who were taking BP-lowering medication or were pregnant at the time of the BP measurement were excluded. The final analytic sample included 2124 participants, with 2118 of these included in the analysis of concurrent UPF intake and 2010 included in the analysis of lagged UPF intake (online Supplementary Fig. S1). As this was a secondary analysis of a large, ongoing cohort study, the sample size and statistical power were subject to the initial size of the sample enrolled and retention over time.
Study protocols were approved by the Institutional Review Board of the University of North Carolina-Chapel Hill. Reporting of this paper followed STROBE guidelines.
Exposure: ultra-processed food intake
Dietary intake was assessed during the 1998, 2002 and 2005 survey waves via two 24-h recalls. Dietary intake was not assessed during the 2009 survey wave. During in-home interviews conducted by local field staff who were trained in the administration of the dietary recall instrument, participants reported their consumption of all foods and beverages during the previous 24 h, including the location of preparation (home, restaurant, school, street vendor and store). The two 24-h recalls were collected on consecutive days. Recalls were reviewed by a local expert in nutrition for implausible values, which were then verified with participants. Energy and macronutrient intakes were estimated using food composition tables developed by the Food and Nutrition Research Institute of the Philippines(36).
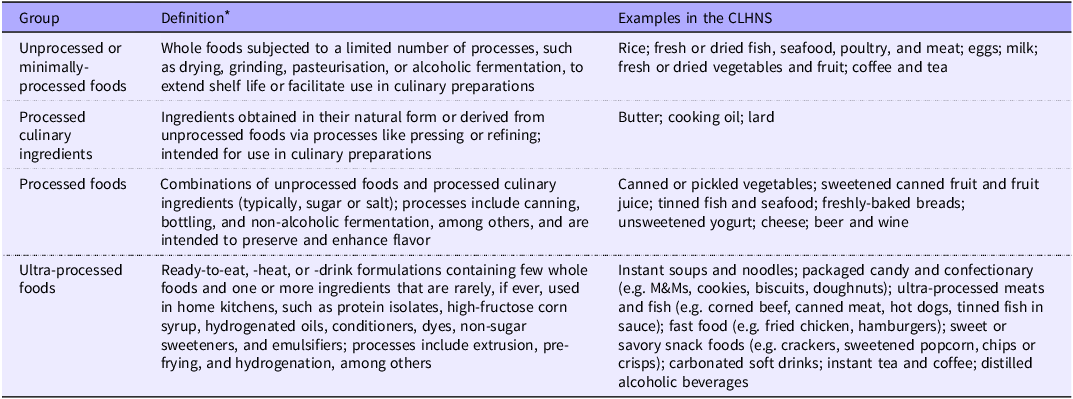
Foods and beverages from all available recalls were classified according to the purpose and extent of industrial processing using the NOVA framework, which divides foods and beverages into four discrete groups: (1) unprocessed or minimally-processed foods, (2) processed culinary ingredients, (3) processed foods and (4) UPFs(Reference Monteiro, Cannon and Levy3,Reference Monteiro, Cannon and Moubarac37) . Definitions and examples from the CLHNS are shown in Table 1. Mixed dishes, which accounted for < 5 % of all items, were classified according to their primary ingredient, based on weight. The location of an item’s preparation was used to classify foods that were likely UPFs if prepared in a restaurant but non-UPFs if prepared elsewhere, such as fast foods (e.g. fried chicken, hamburger).
NOVA groups, definitions, and examples from the CLHNS dietary recalls, 1998–2005

Abbreviations: CLHNS, Cebu Longitudinal Health and Nutrition Survey.
* Definitions based on Monteiro et al. (2019)(Reference Monteiro, Cannon and Levy3).
Energy intake, overall and by NOVA category, was estimated as the average number of kilocalories consumed across two days of recall or as the total kilocalories consumed when only a single recall was available (n 5).
UPFs were further classified as (1) cereals; (2) breads; (3) confectionary and desserts; (4) pizza and sandwiches; (5) salty snacks; (6) dairy products; (7) meat and fish; (8) fats and sauces; (9) sweetened fruit products; (10) instant soups and noodles; (11) sugary beverages; (12) coffee and tea; (13) alcohol and (14) other UPF. This categorisation scheme is similar to those used in other studies(Reference Martínez Steele, Baraldi and Louzada20,Reference Srour, Fezeu and Kesse-Guyot38–Reference Moubarac, Batal and Louzada41) .
Outcome: blood pressure
SBP and DBP were measured in triplicate with a mercury sphygmomanometer (2005 and earlier) or an OMRON digital BP device (after 2005), while participants were seated and after 10 min of rest. SBP and DBP were calculated as the average of the three measures.
Covariates
At each follow-up survey, socio-demographic and lifestyle information and anthropometrics were collected during in-home interviews. Covariates of interest included sex at birth, height, BMI, years of schooling, physical activity, smoking status (current v. non-smoker), household wealth and community urbanicity. These were identified as key determinants of BP in adolescence and early adulthood or as potential confounders of the association between UPF intake and BP through a review of previous studies of this relationship(Reference Jacobs, Woo and Sinaiko29,Reference Madalosso, Martins and Medeiros31,Reference Attard, Herring and Howard42–Reference Busse, Mayol and Ammerman48) .
BMI was calculated from weight and height, measured to the nearest 0·1 kg and 1 cm, respectively. The age-25 survey did not include measurements of height, as linear growth was assumed to have been completed by age 21. Therefore, measures of height at age 25 were carried forward from the age-21 survey. This imputation was for descriptive purposes only, as neither height nor BMI at age 25 was used in the analyses. Schooling was defined as the number of years of school completed. Vocational education was counted as one additional year of schooling, a masters degree as two additional years and a doctorate, medical degree or seminary as four additional years. To standardise across waves, schooling was represented as the difference between a participant’s years of schooling and the sample mean for the corresponding wave. Physical activity was assessed via a 24-h physical activity recall and summarised in minutes per day of moderate-to-vigorous physical activity from work or leisure activities(Reference Tudor-Locke, Ainsworth and Adair49). Household wealth was measured using a composite index based on asset ownership and housing characteristics and standardised across years(Reference Varghese, Adair and Patel50). Urbanicity was captured using an urbanicity index based on population density, communications and transportation infrastructure, educational and health services, and markets(Reference Dahly and Adair51). The index ranged from 0 to 70, with higher scores indicating greater urbanicity. Missing values for urbanicity (n 3) and household wealth (n 8) during the 1998 wave were imputed by carrying forward urbanicity and wealth values from 1994.
Statistical analyses
Descriptive statistics were used to summarise socio-demographic and lifestyle characteristics, anthropometry and dietary intake, according to survey year and sex. Trends over time were assessed using bivariate linear and logistic mixed-effects models for continuous and dichotomous variables, respectively, with survey wave as the predictor and random intercepts for participants (alpha = 0·05).
Linear mixed-effects models with random intercepts for participants and random slopes for survey year or age were used to estimate associations of BP with UPF intake. Separate models were built for SBP and DBP, and all analyses were stratified by sex in consideration of previously reported differences in UPF intake by sex in this cohort(Reference Busse, Mayol and Ammerman48), sex differences in early adulthood BP trajectories(Reference Ji, Kim and Ebinger44) and evidence of variation in the BP-UPF relationship by sex in early adulthood in other settings(Reference Smiljanec, Mbakwe and Ramos-Gonzalez52). The first part of the analysis considered BP in association with concurrent UPF intake; the second part considered lagged UPF intake, or intake during the preceding survey wave. These two different approaches allowed for assessment of whether BP at discrete time points in adolescence and early adulthood was more sensitive to recent UPF intake or intake 3–4 years earlier. Model covariates matched the UPF intake variable, with respect to survey year (i.e. concurrent v. lagged). UPF intake was modelled continuously and scaled such that a one-unit change in UPF intake represented an absolute change in the percentage of daily kilocalories from UPFs of 5 percentage points, which, for a 2000-kilocalorie-per-day diet, would equal an additional 100 kilocalories from UPFs, which is the amount contained in 1–2 packaged cookies, 1/3 of a McDonald’s cheeseburger or 8 fluid ounces of Coca-Cola. Normality of the BP distributions by sex was assessed visually using histograms by survey year (online Supplementary Figures S2-S5). Likelihood ratio tests (alpha = 0·05) were used to assess the fit of the random-slopes models relative to random-intercepts-only models and to identify optimal covariate forms (online Supplementary Tables S1–S4). The timescale was age in years, set equal to the sample mean during the four survey waves (i.e. 15, 18, 21 and 25 years) and modelled using indicator variables to allow for non-linearity in the relationship between age and BP. The crude model (model 1) was adjusted for height and total energy intake. The fully-adjusted model (model 2) additionally included covariates for BMI, schooling, physical activity, smoking status, household wealth, and urbanicity. All models included a UPF intake-by-age interaction. Sex- and age-specific beta estimates were interpreted as the expected difference in BP associated with a 5-percentage point difference in total daily kilocalories from UPFs. Associations were considered statistically significant if their 95 % CI did not include the null value of zero.
The analyses were repeated for the top two UPF subcategories, based on their contribution to total energy intake. Models were identical to those described above, except for the addition of a continuous variable representing the percentage of total daily kilocalories from the UPF subcategory. The total UPF intake variable remained in the model; however, the UPF intake-by–age interaction term was replaced by a UPF subcategory-by-age interaction. Sex- and age-specific beta estimates were interpreted as the expected difference in BP associated with a 5-percentage point difference in total daily kilocalories from the UPF subcategory, holding total UPF intake constant. Associations were considered statistically significant if their 95 % CI did not include zero.
Sensitivity analysis
In sensitivity analyses, BMI and total energy intake were omitted, one at a time, from the models because of their potential mediating roles in this relationship. Analyses were repeated using BP calculated from only the second and third BP measurements, in consideration of a potential ‘white coat’ effect. Analyses were also repeated after excluding participants with only one 24-h recall, in consideration of potentially greater error in estimates of UPF intake from one v. two recalls. Analyses were conducted in Stata 18 and 19 (StataCorp, College Station).
Results
Sample characteristics and dietary intake
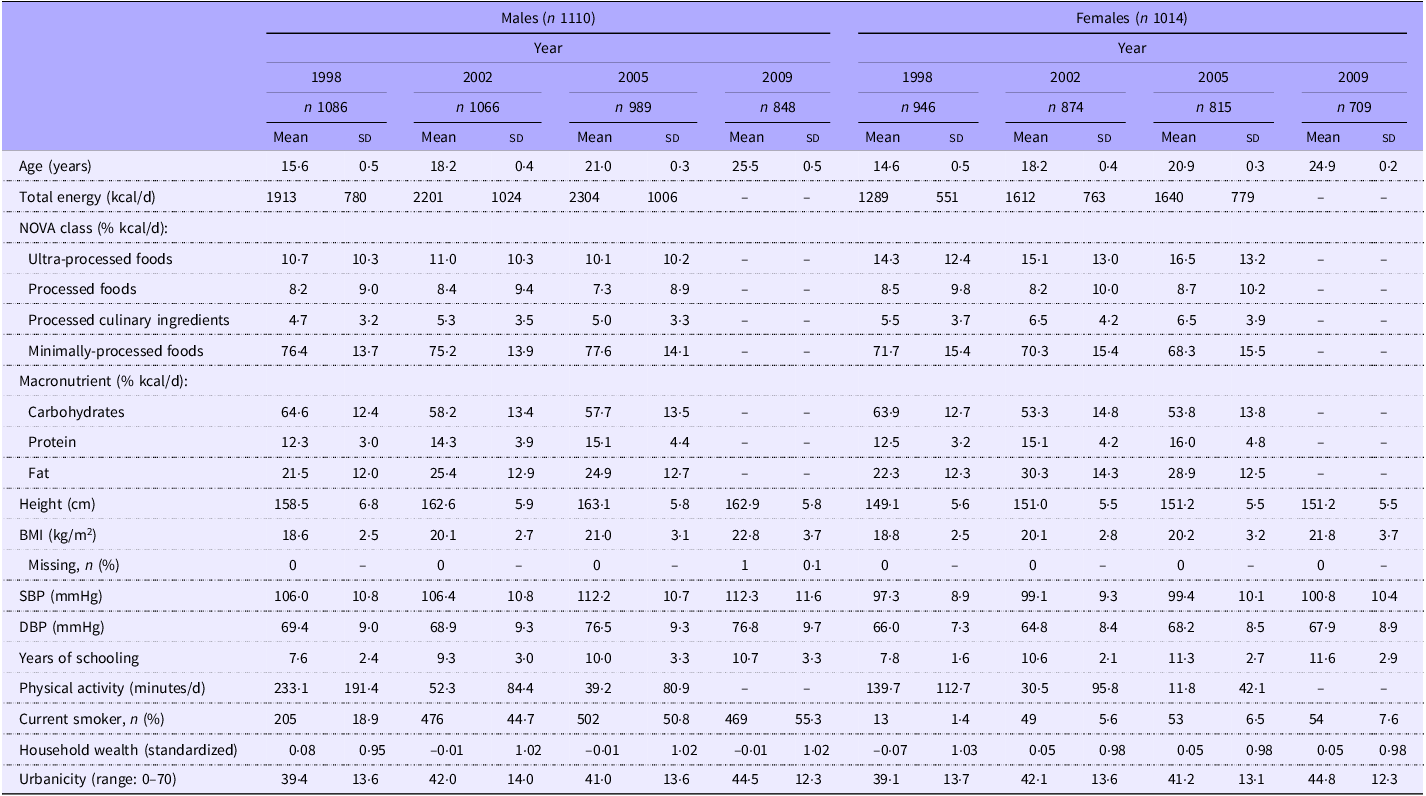
The analytic sample of 2124 participants was slightly more male (52 %). Over the four survey waves, on average, males in the analytic sample were present in 3·6 waves and females in 3·3. Characteristics of the sample, by sex and survey year, are shown in Table 2. While mean UPF intake remained stable at 10–11 % of daily kilocalories among males from age 15 to 21, the mean among females rose from 14 % to 17 % of daily kilocalories over the same period. The maximum UPF intake among males ranged from 60 % of daily kilocalories at age 18 to 69 % at age 15; among females, the maximum UPF intake ranged from 63 % of kilocalories at age 15 to 89 % at age 21. At all three time points, there were males and females that did not consume any UPFs.
Sample characteristics by sex and survey year, CLHNS 1998–2009 (n 2124). Values are means and standard deviations (sd), unless otherwise noted

Abbreviations: CLHNS, Cebu Longitudinal Health and Nutrition Survey; kcal, kilocalories; BMI, body mass index; SBP, systolic blood pressure; DBP, diastolic blood pressure.
Among both sexes, the UPF subcategories that contributed the largest percentage of total kilocalories were ultra-processed meats and fish and ultra-processed sugary beverages (online Supplementary Table S5). Between the ages of 15 and 21, the mean percentage of total kilocalories from ultra-processed meats and fish increased from 3·4 % to 4·5 % among males and from 3·6 % to 5·7 % among females. The maximum intake of ultra-processed meats and fish ranged from 38 % of kilocalories at age 15 to 46 % at age 21 among males and from 42 % at age 21 to 56 % at age 18 among females. From age 15 to 21, the mean percentage of total kilocalories from ultra-processed sugary beverages remained stable (2·5–2·9 %) among males but increased from 3·1 % to 4·4 % among females. The maximum intake of ultra-processed sugary beverages ranged from 20 % of kilocalories at age 15 to 35 % at age 21 among males and from 28 % at ages 15 and 21 to 33 % at age 18 among females.
Among males, from age 15 to 25, mean SBP and DBP increased from 106 to 112 mmHg and from 69 to 77 mmHg, respectively. Among females, over the same period, mean SBP and DBP rose from 97 to 101 mmHg and from 66 to 68 mmHg, respectively. Over the study period, total energy intake, BMI, physical activity, smoking and urbanicity increased among males and females, while household wealth decreased among males but increased among females.
Association between bood pressure and concurrent ultra-processed food intake
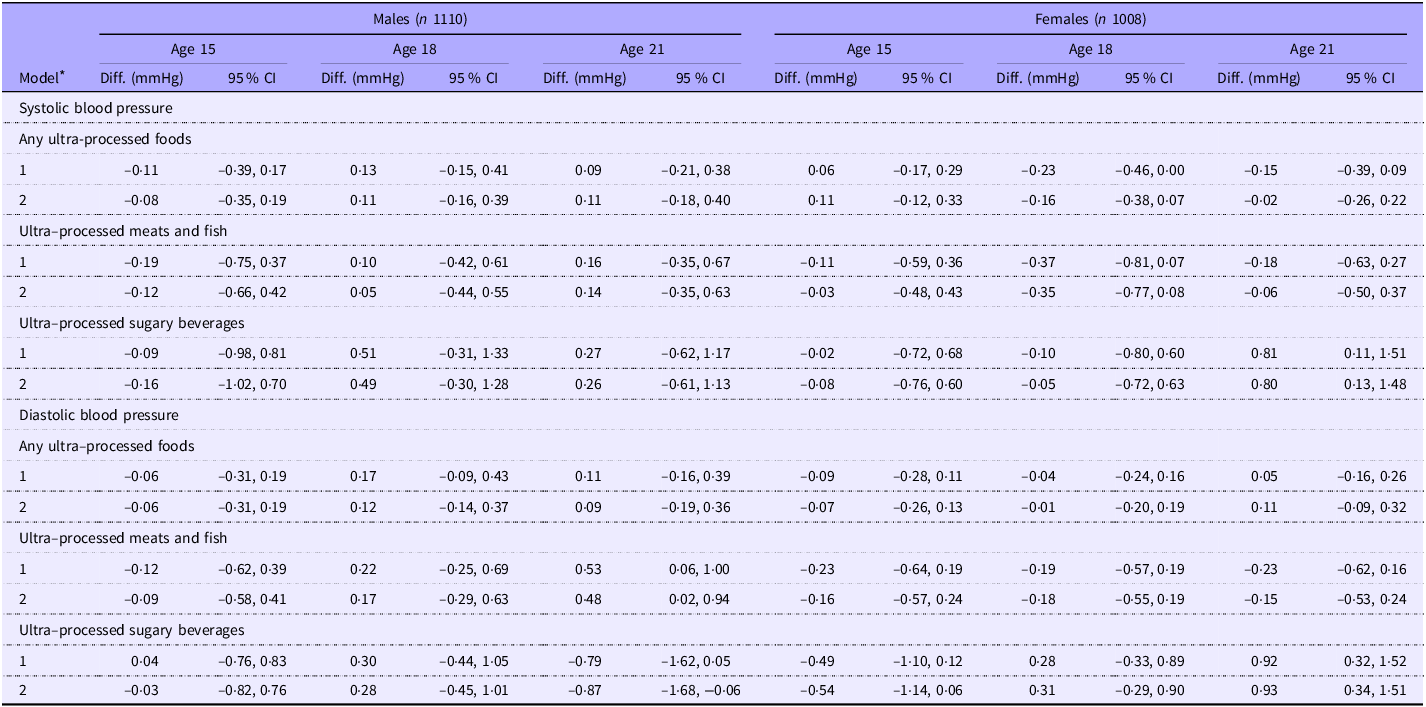
There was no significant association between BP and concurrent UPF intake among males or females at ages 15, 18 or 21 (Table 3). However, there was a positive association between DBP and concurrent intake of ultra-processed meats and fish among males at age 21. Adjusting for potential confounders and holding the overall percentage of total kilocalories from UPFs constant, a 5-percentage point increase in total kilocalories from ultra-processed meats and fish at age 21 was associated with 0·48-mmHg higher DBP (95 % CI: 0·02, 0·94) at age 21 among males. This association remained after removal of total energy intake and BMI from the model (online Supplementary Table S6). There was no significant association between SBP and concurrent intake of ultra-processed meat and fish among males or females.
Estimated difference in blood pressure (mmHg) associated with a 5-percentage point difference in total daily kilocalories from any ultra-processed foods, ultra-processed meats and fish, and ultra-processed sugary beverages during the same survey wave, CLHNS 1998–2005 (n 2118)

Abbreviations: CLHNS, Cebu Longitudinal Health and Nutrition Survey; Diff., difference; CI, confidence interval.
* Model 1: linear mixed-effects model adjusted for age at survey wave, height, and total energy intake. Model 2: model 1 + body mass index, years of schooling, physical activity, smoking status, household wealth, and urbanicity. Models for ultra-processed meats and fish and ultra-processed sugary beverages were additionally adjusted for the percentage of total energy from any ultra-processed foods. All models included an interaction between the ultra-processed food variable of interest (any, meats and fish, or sugary beverages) and age.
There was also a positive association between BP and concurrent intake of ultra-processed sugary beverages among females at age 21. Adjusting for potential confounders and holding the overall percentage of total daily kilocalories from UPFs constant, a 5-percentage point increase in total daily kilocalories from ultra-processed sugary beverages at age 21 was associated with 0·80-mmHg higher SBP (95 % CI: 0·13, 1·48) and 0·93-mmHg higher DBP (95 % CI: 0·34, 1·51) at age 21. Among males, there was an inverse association between concurrent intake of ultra-processed sugary beverages and DBP at age 21 in the adjusted model (β = –0·87; 95 % CI: −1·68, −0·06), but this disappeared after removal of BMI and total energy intake (online Supplementary Table S6).
Association between blood pressure and lagged ultra-processed food intake
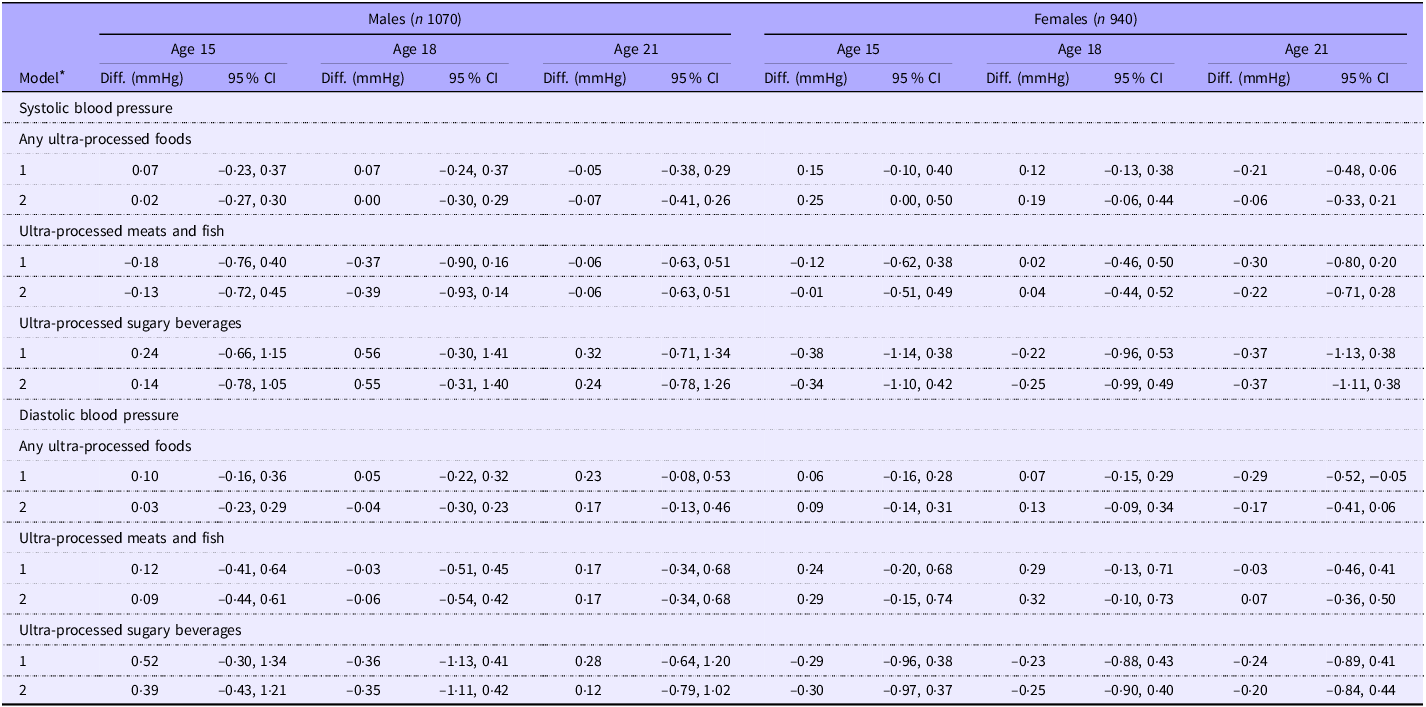
While there was no significant association between BP and lagged UPF intake among males at any age, there was a positive association between UPF intake at age 15 and SPB at age 18 among females (Table 4). Adjusting for potential confounders, a 5-percentage point increase in total daily kilocalories from UPFs at age 15 was associated with 0·25-mmHg higher SBP (95 % CI: > 0·00, 0·50) at age 18. This association remained after removal of BMI and total energy intake (online Supplementary Table S7). The crude association between UPF intake at age 21 and DBP at age 25 among females was inverse (β = –0·29; 95 % CI: −0·52, −0·05), but this association disappeared after adjustment for confounders (β = –0·17; 95 % CI: −0·41, 0·06).
Estimated difference in blood pressure (mmHg) associated with a 5-percentage point difference in total daily kilocalories from any ultra-processed foods, ultra-processed meats and fish, and ultra-processed sugary beverages during the previous survey wave, CLHNS 1998–2009 (n 2010)

Abbreviations: CLHNS, Cebu Longitudinal Health and Nutrition Survey; Diff., difference; CI, confidence interval.
* Model 1: linear mixed-effects model adjusted for age at survey wave, lagged height, and lagged total energy intake. Model 2: model 1 + lagged body mass index, lagged years of schooling, lagged physical activity, lagged smoking status, lagged household wealth, and lagged urbanicity. Models for ultra-processed meats and fish and ultra-processed sugary beverages were additionally adjusted for the lagged percentage of total energy from any ultra-processed foods. All models included an interaction between the ultra-processed food variable of interest (any, meats and fish, or sugary beverages) and age.
There was no association of BP with lagged intake of ultra-processed meats and fish or with lagged intake of ultra-processed sugary beverages at any age among males or females.
Sensitivity analysis
When BP was calculated from only the second and third BP measurements, mean SBP and DBP among males and females were nearly identical to the sample means estimated from all three measurements. Among males, from age 15 to 25, mean SBP and DBP rose from 106 mmHg (sd = 10·8) to 112 mmHg (11·6) and from 69 mmHg (8·9) to 77 mmHg (9·7), respectively. Among females over the same period, mean SBP and DBP rose from 97 mmHg (8·9) to 101 mmHg (10·4) and from 66 mmHg (7·3) to 68 mmHg (8·9), respectively. The sex- and age-specific associations of BP calculated from two measures with UPF intake were identical to those estimated using BP calculated from three measures (results not shown).
Five participants (two at age 15, three at age 21) in the analytic sample had only one 24-h recall during a given survey wave. Excluding these five participants did not result in meaningful changes to the estimates (results not shown).
Discussion
In this cohort from a metropolitan area of the Philippines, there were modest, sex- and age-specific positive associations of BP with concurrent and lagged UPF intake in adolescence and early adulthood (15–25 years). While neither SBP nor DBP at ages 15, 18 or 21 were associated with concurrent overall intake of UPFs, DBP at age 21 was positively associated with concurrent intake of ultra-processed meats and fish among males, and both SBP and DBP at age 21 were positively associated with concurrent intake of ultra-processed sugary beverages among females. Furthermore, there was a positive association between SBP at age 18 and lagged UPF intake at age 15 among females, but this association did not persist into adulthood. This study provides important insights about the cardiometabolic health implications of UPF intake during the transitional period between adolescence and adulthood in the context of a nutrition transition.
One key finding from this study was a positive association between SBP at age 18 and lagged UPF intake at age 15 among females but not males. Notably, BP at age 18 was not associated with concurrent UPF intake among females, suggesting that any potential effect of UPF intake on BP in adolescence may not manifest until several years later. However, this interpretation is complicated by the absence of any association as females entered early adulthood (ages 21 and 25). It may be the case that BP during puberty, which, for females, typically begins in early adolescence and ends in middle or late adolescence and is accompanied by significant increases in fat mass(Reference Loomba-Albrecht and Styne53,Reference Norris, Frongillo and Black54) , is more sensitive to UPF intake than is BP in early adulthood. If true, this would have important implications for the timing of interventions to reduce UPF intake to prevent elevated BP. Consequently, this association merits consideration in future studies of the UPF–BP relationship among contemporary populations of adolescents and young adults in LMICs. The absence of any association between BP and lagged UPF intake among males in the CLHNS cohort may be explained by the lower average UPF intake among males relative to females. It may also be explained by the much higher levels of physical activity among males compared with females in the CLHNS, given that physical activity in adolescence may protect against cardiometabolic disease(Reference Mintjens, Menting and Daams55).
We observed that, in this cohort, greater consumption of particular types of UPFs, specifically ultra-processed meats and fish and ultra-processed sugary beverages, was cross-sectionally associated with higher BP in early adulthood. These findings align closely with a growing number of studies reporting that consumption of processed meats(Reference Allen, Bhatia and Wood56,Reference Oude Griep, Seferidi and Stamler57) and sugar-sweetened beverages(Reference Malik, Akram and Shetty58), the major contributors to these two UPF subcategories, respectively, are positively associated with BP in adulthood. Further supporting our finding, a recent study using pooled data from adults in three large USA cohorts observed that the risk of cardiovascular disease increased with increasing intake of sugar-sweetened beverages and processed meats(Reference Mendoza, Smith-Warner and Rossato59). The high sodium content of processed meats is believed to be largely responsible for their association with high BP(Reference Micha, Michas and Lajous60). On the other hand, consumption of sugar-sweetened beverages promotes weight gain and increases risk of overweight and obesity(Reference Malik and Hu61), which may lead to increases in BP. Why consumption of these types of UPFs was associated with concurrent BP in early adulthood while consumption of UPFs, more generally, was not, may be explained by the heterogeneity in the types of UPFs consumed at a given level of UPF intake. The UPF category is broad, and different types of UPFs may influence cardiometabolic health differently(Reference Vitale, Costabile and Testa5). More difficult to explain is the juxtaposition between the positive association of BP in late adolescence with lagged UPF intake among females and the absence of similar association with lagged intake of ultra-processed meats and fish or ultra-processed sugary beverages. This should inspire further inquiry about the unique combinations of UPFs that may be linked to cardiometabolic health in adolescence.
This study has implications for future research and public health. Although the magnitudes of the observed positive associations between UPF intake and BP were small, at less than a 1-mmHg increase in BP per 5-percentage-point increase in daily calories from UPFs, they may portend more significant differences in BP later in life, as higher BP in adolescence and early adulthood tends to predict higher BP later in adulthood. For example, in the multi-country i3C Consortium study, individuals with self-reported hypertension in middle adulthood had significantly higher BP by the age of 16 years than those who were self-reported normotensive in middle adulthood(Reference Urbina, Khoury and Bazzano62). The positive associations observed in the CLHNS cohort contribute to the growing body of literature supporting a relationship between UPFs and elevated BP across multiple settings(Reference Wang, Du and Huang63) and highlight the need for additional research about the long-term cardiometabolic health implications of UPF intake in adolescence. Future studies should consider the relationship of UPF intake during adolescence with subclinical indicators of cardiometabolic health, as the absence of an association between UPF intake and BP in adolescence may not indicate the absence of any effect on overall cardiometabolic health. Indeed, two recent systematic reviews of the relationship between UPF intake and cardiometabolic health in children and adolescents reported a link between UPF intake and blood lipid levels(Reference Frias, Cadena and Villarreal64,Reference Beserra, Soares and Marreiros65) . Furthermore, UPF intake in this Filipino cohort in the late 1990s and 2000s was low, with UPFs accounting for less than 17 % of daily energy. For comparison, UPFs account for more than 40 % of total energy among adolescents and young adults in many high-income countries(Reference Marino, Puppo and Del Bo’30). Thus, additional research on this topic should consider adolescent populations with higher UPF intake, particularly adolescents in LMICs, where research about UPFs remains sparse. In the coming decades, UPF sales are projected to rise in the Philippines and in LMICs worldwide(Reference Baker, Machado and Santos34), making elucidation of the effects of increasingly ultra-processed diets on cardiometabolic health across the life course more urgent.
This study had several limitations. First, participants were recruited from a single metropolitan area and were adolescents and young adults in the late 1990s and 2000s. In the decades since, the food environment of the Philippines has changed, with significant increases in the availability of UPFs(Reference Baker and Friel66). Indeed, in a recent qualitative study of awareness of UPFs among young people in Cebu, we learned that UPFs are commonplace in both the home and school food environments in present-day Cebu(Reference Busse, Dino and Martin67). Consequently, the generalisability of these findings to present-day adolescents and young adults and to those in other LMICs may be limited. Nonetheless, this study makes a valuable contribution to scientific understanding about the relationship between UPF intake and BP in adolescence and early adulthood in the context of the nutrition transition, a phenomenon that is unfolding in LMICs around the world(Reference Popkin, Adair and Ng68). Second, there was attrition resulting from migration out of the study area and death. However, previous analyses using the CLHNS data have not found evidence of bias due to attrition(Reference Wright, Sotres-Alvarez and Mendez69,Reference Adair, Duazo and Borja70) , and there is no reason to suspect that the relationship between UPF intake and BP among those who remained in the cohort was different from the relationship among those who did not. Third, there was evidence of end-digit preference in the SBP and DBP measurements, potentially indicating measurement error in the BP readings. We do not believe that this error differed with respect to BP, UPF intake or confounders, and the shape of the BP distributions by age appeared to be approximately normal, despite the peaks at readings ending in zero. However, previous research has indicated that end-digit preference in BP readings may lead to underestimated BP, on average(Reference Kottke, Anderson and Zillhardt71), and our findings should be interpreted with this in mind. Fourth, because dietary intake was assessed approximately every 3 years from ages 15 to 21, it is possible that the estimates of UPF intake and its association with BP may not generalise to individuals at intervening ages. Nevertheless, considering the large sample size, we consider this frequency of follow-up to be, overall, a real strength of this data source. Fifth, like most diet data collected prior to the introduction of NOVA, the data used in this study did not include detailed information on the degree of industrial processing of reported foods and beverages. Although our classification was informed by local experts who have led the collection and analysis of CLHNS diet data for multiple decades and are familiar with the local food environment, there is likely some error in the classification of UPFs. However, we expect that this error was non-differential with respect to BP; consequently, any potential bias would be expected to be towards the null, leading to underestimation of the associations. Relatedly, the dietary recalls did not include a comprehensive assessment of dietary sodium intake. In the Philippines, sauces and condiments are common sources of dietary sodium and are frequently added at the table to traditional dishes, which typically do not contain UPFs. If such dishes were consumed in place of UPFs, then, as their contribution to daily energy increased, we would anticipate greater intake of sodium from sauces and condiments and, at the same time, lower intake of UPFs. As a result, participants with lower UPF intake may have had similar intake of dietary sodium compared with participants with higher UPF intake, potentially biasing the association between UPF intake and BP towards the null. Finally, to examine fully the relationship between UPF intake and BP during the transitional period between adolescence and early adulthood, we conducted several analyses and tested multiple hypotheses. Therefore, we cannot rule out that our findings were due to chance, and future studies should examine these associations among other populations of young people to confirm their validity.
Notwithstanding these limitations, this study had important strengths. First, the multiple survey years spanning adolescence and early adulthood allowed for examination of the time-varying nature of the relationship between UPF intake and BP during this period. Second, assessment of dietary intake via multiple 24-h recalls allowed for classification of each food and beverage according to NOVA. Other instruments commonly used to assess usual dietary intake in large samples, including FFQ, ask participants to report intake of foods within broader categories; if the category includes both UPFs and non-UPFs, this may result in misestimation of UPF intake(Reference Marino, Puppo and Del Bo’30,Reference Khandpur, Rossato and Drouin-Chartier72) .
Conclusions
In this cohort in a metropolitan setting in the Philippines, consumption of UPFs and of particular types of UPFs, including ultra-processed meats and fish and ultra-processed sugary beverages, in adolescence and early adulthood was positively associated with BP, though these associations were small in magnitude and varied by age and sex. This study provides insights about the relationship between UPF intake and cardiometabolic health in adolescence and early adulthood in the context of a nutrition transition, and its findings support ongoing efforts to better understand the role of UPFs in the growing burden of non-communicable diseases in LMICs.
Supplementary material
For supplementary material/s referred to in this article, please visit https://doi.org/10.1017/S0007114525105795
Acknowledgements
We thank Paulita Duazo for her technical assistance in classifying the CLHNS foods and beverages according to their degree of industrial processing.
This work was supported by an American Heart Association Predoctoral Fellowship (#23PRE1019862) and a NIH National Heart, Lung, and Blood Institute NRSA predoctoral traineeship (#5T32HL129969). Neither the American Heart Association nor the National Heart, Lung, and Blood Institute had any role in the design, analysis, or writing of this article.
K. R. B.: conceptualisation, formal analysis, funding acquisition, methodology, investigation, writing – original draft. N. L. M.: conceptualisation, data curation, methodology, writing – review and editing. A. S. A., S. L. M., C. L. A.: conceptualisation, methodology, writing – review & editing. L. S. A.: conceptualisation, funding acquisition, methodology, supervision, writing – review and editing.
There are no conflicts of interest.
The data used for this study are publicly available through the Carolina Population Center (https://data.cpc.unc.edu/projects/6/view#public_li), except for the estimates of nutrient and energy intake; these were calculated using proprietary food composition tables from the Food and Nutrition Research Institute of the Philippines. Nutrient and energy intake data may be made available by the Office of Population Studies Foundation of the University of San Carlos with the approval of a data use agreement.