1. Introduction
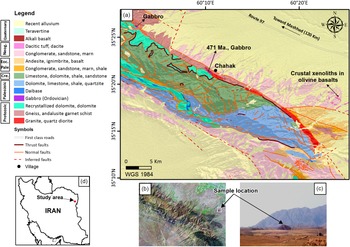
In northeastern Iran (Fig. 1), a small Neogene/Quaternary alkali olivine basalt cone and associate lava flows contain both ultramafic mantle and mafic crustal xenoliths. The chemical and isotopic composition of the basalt and mantle xenoliths were presented in Saadat & Stern (Reference Saadat and Stern2012) and Su et al. (Reference Su, Chung, Zarrinkoub, Pang, Chen, Ji, Brewer, Ying and Khatib2014), along with mention of, but only very limited petrochemical information for, the mafic crustal xenoliths.
(a) Simplified geological map of the study area in NE Iran showing the location of the outcrop of alkali olivine basalt containing both ultramafic mantle and mafic crustal xenoliths (Saadat & Stern, Reference Saadat and Stern2012), as well as the location of Ordovician gabbroic rocks near Chahak ∼20 km to the west (Partovifar, Reference Partovifar2012; Shojaee kaveh, Reference Shojaee kaveh2014; Homam, Reference Homam2015). The base map is taken from Geological Survey of Iran (1984). (b) Satellite image showing the location of the study area. (c) Photo of the outcrop of xenolites bearing alkali basalt. (d) Location of the study area in NE Iran.

Crustal xenoliths are considered to be fragments of the lower crust accidentally brought to the surface by their host alkali basalts (Rudnick, Reference Rudnick, Fountain, Arculus and Kay1992). Crustal and mantle xenoliths entrained in continental alkali basalts provide samples to study the chemical and physical evolution of the deep continental lithosphere (Selverstone & Stern, Reference Selverstone and Stern1983; Stern et al. Reference Stern, Kilian, Olker, Hauri and Kyser1999; Farmer, Reference Farmer2003; Gautheron et al. Reference Gautheron, Moreira and Allègre2005; Nasir et al. Reference Nasir, Al-Sayigh, Alharthy and Al-Lazki2006;) and are the most direct source of information about the composition, age and tectonic history of the lower crust and uppermost mantle lithosphere (Cohen et al. Reference Cohen, O’Nions and Dawson1984; Koornneef et al. Reference Koornneef, Davies, Döpp, Vukmanovic, Nikogosian and Mason2009). The crustal xenoliths found in the alkali basalts of NE Iran are therefore a potentially valuable source of information on the nature of the deeper parts of the crust in this area. This paper presents new major and trace element and isotopic data for these crustal xenoliths as a contribution toward characterizing the lower continental basement below this region.
2. Geological overview
The oldest rocks in NE Iran, which are mainly exposed in a narrow elongated NW–SE-trending belt, are Neoproterozoic to Early Palaeozoic (660–530 Ma) in age. These rocks are gneisses and schists, recrystallized limestones and dolomites, and granite and quartz diorite plutons similar to exposures of Neoproterozoic to Early Palaeozoic basement in other tectonic zones of Iran (Hassanzadeh et al. Reference Hassanzadeh, Stockli, Horton, Axen, Stockli, Grove, Schmitt and Walker2008). The granites and quartz diorites and rhyolites in NE Iran range in age from 570 to 530 Ma (Bagherzadeh et al. Reference Bagherzadeh, Karimpour, Farmer, Stern, Santos, Rahimi and Heidarian Shahri2015; Shafaii Moghadam et al. Reference Shafaii Moghadam, Li, Griffin, Stern, Thomsen, Meinhold, Aharipour and O’Reilly2017 a, b; Oinam et al. Reference Oinam, Singh, Joshi, Dutt, Singh, Singh and Singh2020; Kumar & Pundir, Reference Kumar and Pundir2021; Samadi et al. Reference Samadi, Torabi, Dantas, Morishita and Kawabata2022; Azizi & Whattam Reference Azizi and Whattam2022). Late Neoproterozoic – Early Palaeozoic mafic and felsic intrusive igneous rocks and associated clastic sediments are also reported from other areas in Iran (Horton et al. Reference Horton, Hassanzadeh, Stockli, Axen, Gillis, Guest, Amini, Fakhari, Zamanzadeh and Grove2008; Bagherzadeh et al. Reference Bagherzadeh, Karimpour, Farmer, Stern, Santos, Rahimi and Heidarian Shahri2015; Shafaii Moghadam et al. Reference Shafaii Moghadam, Li, Griffin, Stern, Thomsen, Meinhold, Aharipour and O’Reilly2017 a, b; Mazhari et al. Reference Mazhari, Klötzli and Safari2019; Sepidbar et al. Reference Sepidbar, Moghadam, Li, Stern, Jiantang and Vesali2020; Azizi & Whattam, Reference Azizi and Whattam2022), as well as other areas along the northern margin of the Gondwana supercontinent (Hassanzadeh et al. Reference Hassanzadeh, Stockli, Horton, Axen, Stockli, Grove, Schmitt and Walker2008; Oinam et al. Reference Oinam, Singh, Joshi, Dutt, Singh, Singh and Singh2020; Kumar & Pundir, Reference Kumar and Pundir2021; Samadi et al. Reference Samadi, Torabi, Dantas, Morishita and Kawabata2022).
Younger gabbros and zircons in the sediments of the Qeli Formation have been dated as 492 to 457 Ma (Fig. 1; Shafaii Moghadam et al. Reference Shafaii Moghadam, Li, Griffin, Stern, Thomsen, Meinhold, Aharipour and O’Reilly2017 a, b; Ranjbar Moghadam et al. Reference Ranjbar Moghadam, Masoudi, Homam, Kerfo and Mohajel2018). It has been suggested that the formation of these gabbroic rocks was a result of an extensional tectonic event related to the opening of the Palaeotethys ocean during the Ordovician and Silurian (Ranjbar Moghadam et al. Reference Ranjbar Moghadam, Masoudi, Homam, Kerfo and Mohajel2018; Samadi et al. Reference Samadi, Torabi, Dantas, Morishita and Kawabata2022).
After this, central and eastern Iran were separated until Late Palaeozoic time from the Eurasian plate by the Hercynian Palaeotethys ocean (Shahabpour, Reference Shahabpour2005). During the Permian–Triassic, a N-dipping subduction system along the northern Palaeotethys margin led to the closure of this ocean (Golonka, Reference Golonka2004), and the northward motion of the central and eastern Iran micro-continent resulted in their welding with the Eurasian plate (Shahabpour, Reference Shahabpour2005). The central and eastern Iran – Eurasia collision must have happened at roughly 222–210 Ma (Horton et al. Reference Horton, Hassanzadeh, Stockli, Axen, Gillis, Guest, Amini, Fakhari, Zamanzadeh and Grove2008). K/Ar analysis of hornblende gabbro remnants of the Palaeotethys oceanic crust, exposed in the Binalud range (Alavi, Reference Alavi1979), correspond to the late Pennsylvanian – early Permian (Ghazi et al. Reference Ghazi, Hassanipak, Tucker, Mobasher and Duncan2001). This range extends to the west into the Alborz range and eastward into the Hindu-Kush in northern Iran and Afghanistan.
Mesozoic rocks in this area mainly consist of bedded limestone, dolomite, shale, sandstone and conglomerate, whereas the Palaeogene is marked by volcano-sedimentary rocks. Volcanic rocks are mostly porphyritic basaltic andesites, dacites and rhyodacitic welded tuff (Fig. 1). The latter rocks were dated 38.5 ± 1.2 Ma, indicating a late Eocene – early Oligocene age for the upper part of the volcano-sedimentary sequence. Neogene sediments, mainly conglomerates and sandstones, form very thick sequences filling in tectonic basins on either side of the main Alborz Mountain range.
The Neogene/Quaternary alkali olivine basalts with ultramafic mantle and mafic crustal xenoliths, which are the focus of this study, consist of a monogenetic basaltic cone and associated lava flows which crop out in a subcircular area of ∼60 000 m2 (0.3 × 0.2 km), overlying unconsolidated Neogene sediments and Tertiary andesitic and dacitic tuffs in NE Iran (Fig. 1; Saadat & Stern, Reference Saadat and Stern2012; Su et al. Reference Su, Chung, Zarrinkoub, Pang, Chen, Ji, Brewer, Ying and Khatib2014). This is the only known occurrence of either mantle or granoblastic textured crustal xenoliths in this area of Iran. Mantle xenoliths are two to three times more abundant than the crustal xenoliths in this basalt flow. The crustal xenoliths are in general 1 to 6 cm in largest dimension, while the ultramafic mantle xenoliths are in some cases as large as 15 cm in largest diameter. These alkali olivine basalts have geochemical affinities with intra-plate oceanic island alkali basalts (OIB) as do other Neogene/Quaternary alkali olivine basalts erupted along the strike-slip faults bounding the Lut block in eastern Iran (Saadat et al. Reference Saadat, Karimpour and Stern2010). They show no evidence of enrichment of large-ion-lithophile (LIL) relative to high-field strength (HFS) elements as is characteristic of convergent plate boundary magmas that are erupted above subduction zones. In this respect they differ from the 41 to 2.3 Ma collisional and post-collisional basalt, andesite, adakite and dacite lavas and dikes outcropping >200 km to the NW in the Meshkan area around the large Sar’ahkor composite volcano (Shabanian et al. Reference Shabanian, Acocella, Gioncada, Ghasemi and Bellier2012). These have negative HFS element anomalies relative to LIL elements and it has been suggested that their genesis involves melting of a detached slab of oceanic crust foundering after the cessation of subduction, or of mantle previously metasomatized above subducted oceanic crust. In contrast, the genesis of the xenolith-bearing alkali olivine basalts from NE Iran, and other olivine alkali basalts erupted along the strike-slip faults surrounding the Lut block, appears to have been derived from mantle unaffected by subduction-related metasomatism. However, like the magmas erupted or emplaced as dikes in the Meshkan region to the NW, they may have risen through the crust along an area of local extension, such as a pull-apart structure, related to strike-slip faulting (Shabanian et al. Reference Shabanian, Acocella, Gioncada, Ghasemi and Bellier2012).
3. Methods
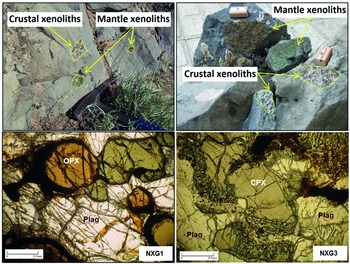
Twelve samples of crustal xenoliths were chiselled out of a single lava flow (Fig. 2) associated with the small outcrop of alkali olivine basalt in NE Iran. Polished thin-sections for electron probe micro-analysis were prepared from these samples. Minerals were analysed using the JEOL JXA-8230 super probe in the Laboratory for Environmental and Geological Science at University of Colorado–Boulder, with an electron-gun accelerating voltage of 15 kV and a 1 μm diameter focused beam. Matrix correction was done by Armstrong’s ZAF correction program using natural mineral standards.
Photos of both crustal and mantle xenoliths in the alkali basalts of NE Iran (Saadat & Stern, Reference Saadat and Stern2012) and photomicrographs of a CPX (NXG3) and CPX + OPX (NXG1) gabbroic crustal xenoliths.

Two samples of mafic crustal xenoliths, one two-pyroxene gabbro (SS22) and one clinopyroxene gabbro (SS21), were selected for whole-rock geochemical analysis. A jaw crusher was used to pulverize samples, which were then powdered to 200 mesh in a tungsten carbide shatter box. These powders were sent to Activation Laboratories (Canada), where they were analysed for both major and trace elements.
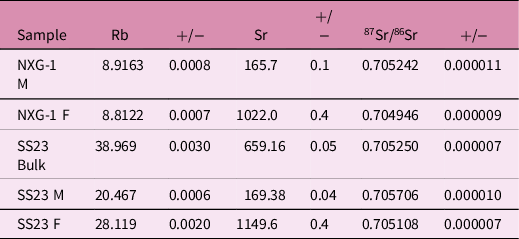
Pyroxene-rich mafic and plagioclase-rich felsic portions of two crushed two-pyroxene gabbro (SS23 and NXG1) xenoliths were hand-picked for determination of an Rb–Sr age by solid source mass-spectrometry techniques. The mineral separates from these two xenoliths, as well as the bulk whole-rock of xenolith SS23, were analysed for Sr isotopes. Isotopic analyses were done in the isotope lab in the Department of Geological Sciences, University of Colorado. Sample powders for isotopic analysis were generated in a ceramic-lined container. 87Sr/86Sr ratios were analysed using a Finnigan-Mat 261 four-collector static mass spectrometer. Replicate analyses of the SRM-987 standard in this mode yielded a mean 87Sr/86Sr of 0.71025 ± 2 (2σ). Measured 87Sr/86Sr were corrected to SRM-987 = 0.710299 ± 8. Errors are 2σ of the mean, which refer to the last two digits of the 87Sr/86Sr ratio. Analyses were dynamic mode, three-collector measurements. Details of analytical procedures are given in Farmer et al. (Reference Farmer, Broxton, Warren and Pickthorn1991, Reference Farmer, Glazner and Manley2002).
4. Results
4.a. Petrography
The rounded to angular crustal xenoliths are medium-grained granoblastic gabbros (Fig. 2) composed of around 50 % plagioclase as well as both clinopyroxene and orthopyroxene and small variable amounts of olivine (<5 %), spinel, iron oxides and apatite. Out of the 12 samples collected and thin-sectioned, eight are two-pyroxene gabbros and four are clinopyroxene gabbros without orthopyroxene. Clinopyroxenes have undergone reactions along their borders to produce fine-grained intergrowths of other minerals. Some plagioclases also show spongy texture that could be either original crystallization features or the result of dissolution and/or direct melting caused by heating within the hot mafic host basaltic magma which transported the xenoliths to the surface (Hibbard, Reference Hibbard1995). Green spinel, titanomagnetite and apatite are also present in minor amounts. The crustal xenoliths tend to be equigranular, with smooth curving grain boundaries that commonly meet in 120° triple junctions (Fig. 2). Neither garnet, amphibole nor alkali feldspar has been recognized in any of the xenolith samples.
4.b. Whole-rock geochemistry
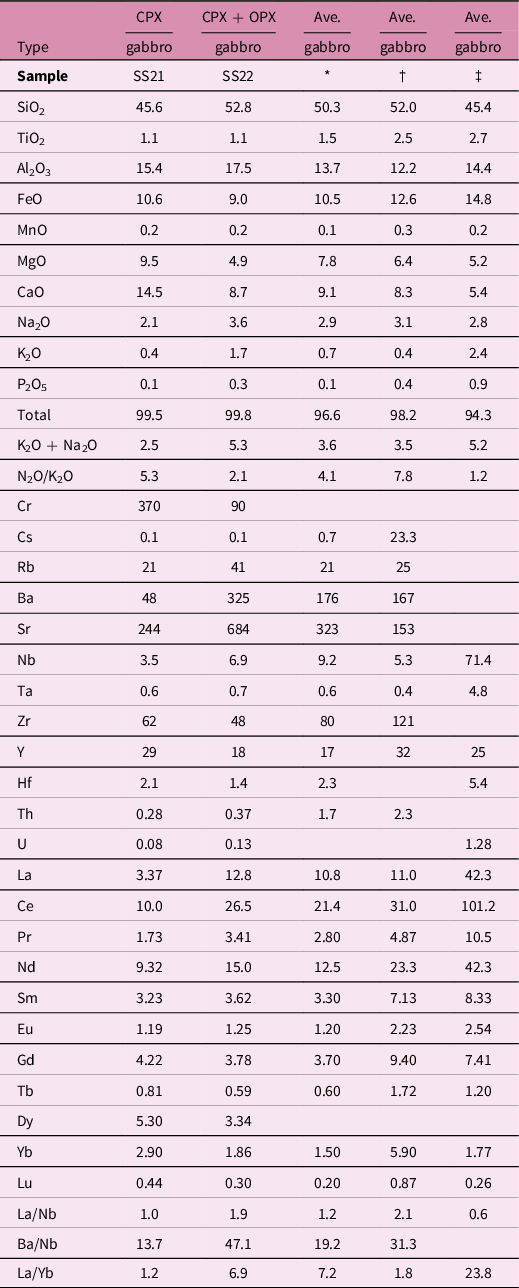
The major and trace element compositions for two gabbroic xenoliths, one representative of those containing both clinopyroxene and orthopyroxene (SS22) and another with only clinopyroxene (SS21), are presented in Table 1. For comparison, the average major and trace element concentration are shown for three Ordovician gabbroic rocks which outcrop near Chahak c. 20 km NW of the study area (Figs 1, 3 and 4; Partovifar, Reference Partovifar2012; Shojaee kaveh, Reference Shojaee kaveh2014; Homam, Reference Homam2015; Ranjbar Moghadam et al. Reference Ranjbar Moghadam, Masoudi, Homam, Kerfo and Mohajel2018).
Major oxides (wt %) and trace element (ppm) composition of two crustal xenoliths and Ordovician gabbros from the adjacent Chahak area

* Homam (Reference Homam2015).
† Partovifar (Reference Partovifar2012).
‡ Shojaee kaveh (Reference Shojaee kaveh2014)
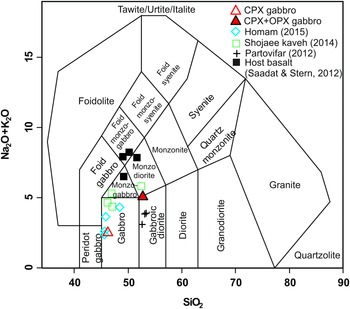
Petrologic classification, based on Na2O + K2O (wt %) against SiO2 (wt %; Middlemost, Reference Middlemost1994), for two xenolith samples (triangles) and their host alkali basalt (squares), as well as other mafic rocks from the adjacent Chahak area.

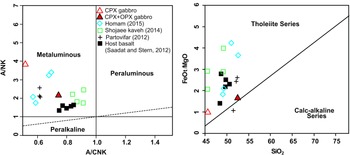
Plots of various element ratios for crustal xenoliths (triangles) and their host basalt (squares), and other gabbros from NE Iran. In the molecular Al2O3/Na2O + K2O vs molecular Al2O3/CaO + Na2O + K2O diagram (Maniar & Piccoli, Reference Maniar and Piccoli1989) the xenoliths and other samples classify as metaluminous. In the FeOt/MgO vs SiO2 diagram (Shand, Reference Shand1943) they show tholeiitic affinity.

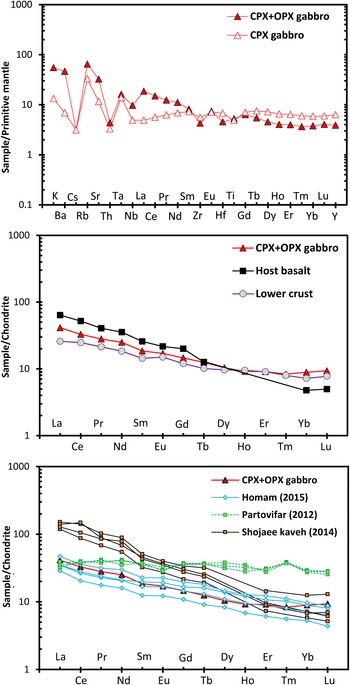
The two crustal xenoliths have SiO2 of 45.4 and 52.8 wt %, with moderate MgO contents of 9.5 and 4.9 wt %, and Al2O3 of 15.4 and 17.5 wt %, respectively. Their Cr concentrations range from 370 to 90 ppm (Table 1). These xenoliths plot in the gabbro and gabbro/diorite fields on a silica vs total alkalis classification diagram (Fig. 3). They show metaluminous affinity and plot in the tholeiitic field (Fig. 4; Shand, Reference Shand1943). Although the two-pyroxene gabbro (SS22) has a major element composition similar to a basalt, the Cpx gabbro (SS21) has lower SiO2, Al2O3, Na2O and K2O and higher CaO, MgO and Cr, which suggests that this may be a gabbro with enhanced proportions of cumulus clinopyroxene relative to the other mineral phases.
The chondrite-normalized trace-element pattern of the two-pyroxene gabbroic xenolith is characterized by slightly enriched light rare earth elements (LREEs) with La/Yb value of 6.9 (Table 1; Fig. 5). It has only weak negative anomalies of the HFS elements Ti, Hf, Zr, Nb and Th (Fig. 5). The Cpx gabbro has lower La, Sr and Ba, consistent with an increased proportion of clinopyroxene relative to plagioclase in this sample compared to the two-pyroxene gabbro sample, since these elements are either incompatible or less compatible in clinopyroxene relative to Ca-plagioclase (Schnetzler & Philpotts, Reference Schnetzler and Philpotts1970; Sun, Reference Sun and White2018).
Trace-element compositions of two xenolith samples normalized to (a) primitive mantle and (b, c) a chondritic meteorite and compared to the host basalt (Saadat & Stern, Reference Saadat and Stern2012), average lower continental crust (Taylor & McLennan, Reference Taylor and McLennan1985) and gabbros from adjacent areas in NE Iran (Partovifar, Reference Partovifar2012; Shojaee kaveh, Reference Shojaee kaveh2014; Homam, Reference Homam2015).

4.c. Mineral chemistry
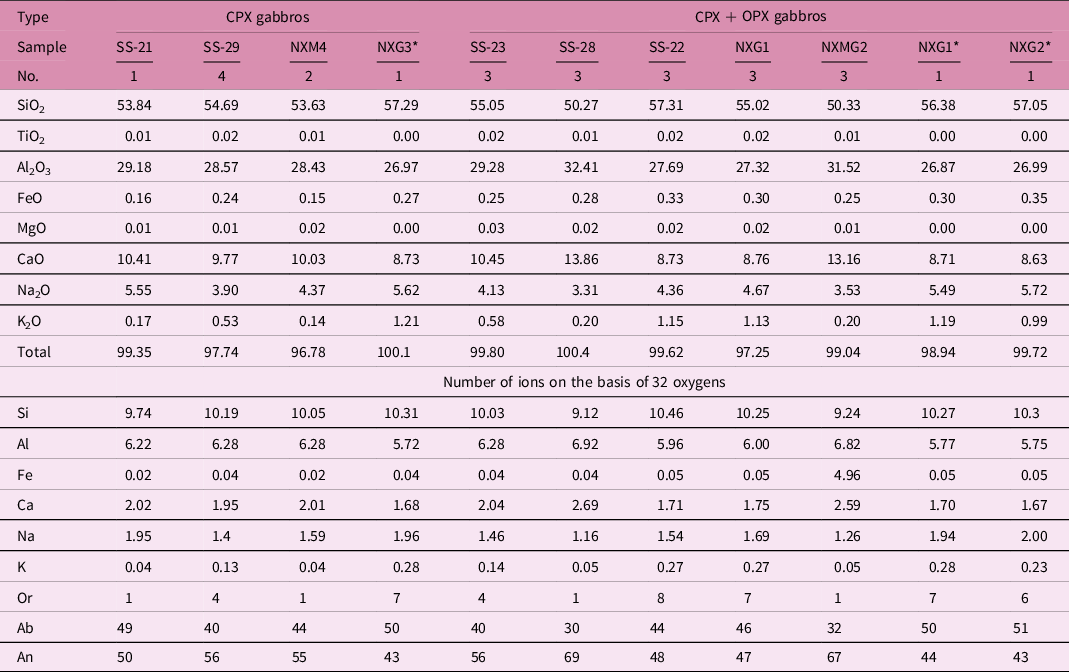
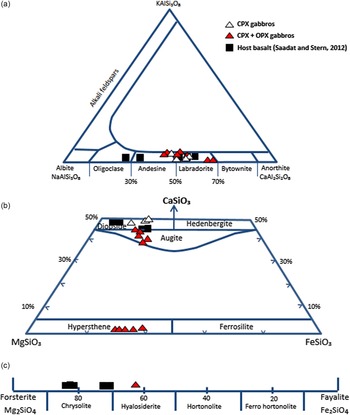
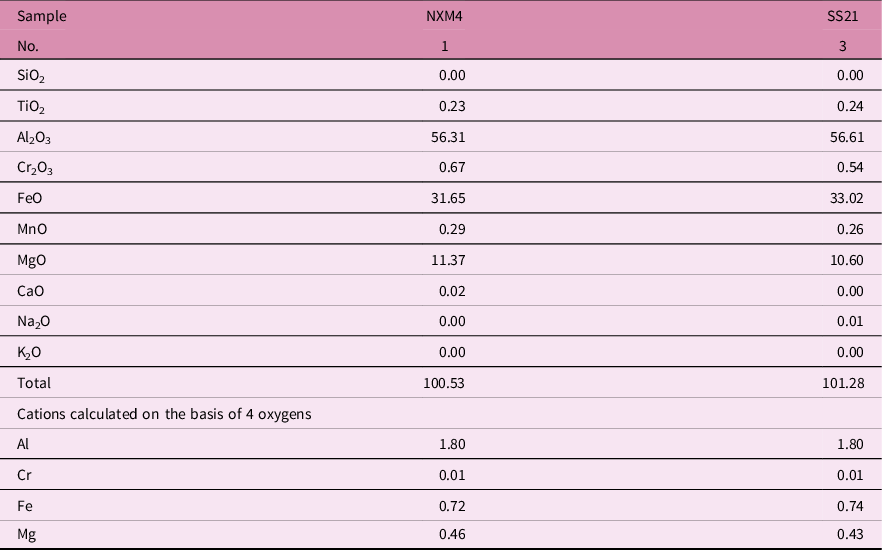
The composition of the plagioclases ranges from An44-69 and would be classified as labradorite and andesine (Table 2; Fig. 6), whereas the plagioclase phenocrysts in the host basalts include oligoclase as well as andesine and labradorite (Saadat & Stern, Reference Saadat and Stern2012).
Electron probe micro-analysis of plagioclase

* Saadat & Stern, Reference Saadat and Stern2012.
Compositions of olivines, orthopyroxenes, clinopyroxenes and plagioclases in different crustal xenolith samples compared to their host basalt.

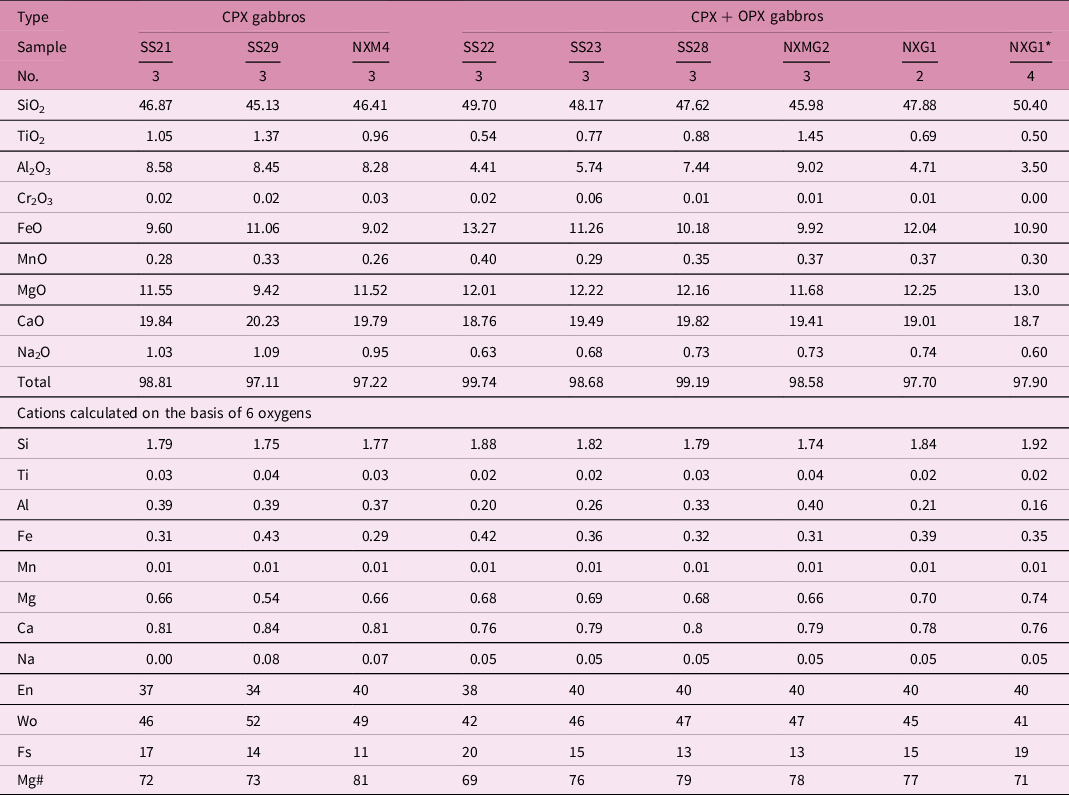
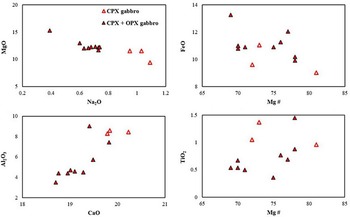
All clinopyroxenes plot in the augite and diopside fields in the quadrilateral diagram (Table 3; Fig. 6). They have variable Al2O3 and TiO2 contents (0.5–9.0 wt % and 0.36–1.45 wt %, respectively) and low Cr2O3 <0.86 wt % (Table 3). The Mg# [(Mg+2*100)/((Fe+2*0.85) + (Mg))] for these minerals ranges from 69 to 81. Although clinopyroxenes have a limited composition, they define two groups: first, clinopyroxene from orthopyroxene-free xenoliths, and second, clinopyroxene from two-pyroxene xenoliths. Clinopyroxenes from orthopyroxene-free xenoliths extend to higher Na2O and CaO compositions (0.95–1.09 wt % and 19.79–20.23 wt %, respectively) and their Mg# ranges from 72 to 81. Clinopyroxenes from two-pyroxene xenoliths show higher FeO and MgO content and their Mg# ranges from 69 to 78. Clinopyroxenes from this group show lower Na2O and CaO content (0.39–0.74 wt % and 17.29–19.82 wt %, respectively). In general, some other notable differences also exist between the compositions of clinopyroxene in these two groups. Al2O3 contents vary from 0.5 to 7.4 wt % in two-pyroxene gabbros, as compared with 8.3 to 8.6 wt % in those with clinopyroxene only (Fig. 7). TiO2 concentrations range from 0.96 to 1.37 wt % in clinopyroxene gabbros compared with 0.36 to 0.88 wt % in two-pyroxene gabbros.
Electron probe micro-analysis of clinopyroxenes

* Saadat & Stern, Reference Saadat and Stern2012.
MgO vs Na2O, FeO and TiO2 vs Mg#; and Al2O3 vs TiO2 in clinopyroxenes from CPX and CPX + OPX gabbroic xenoliths.

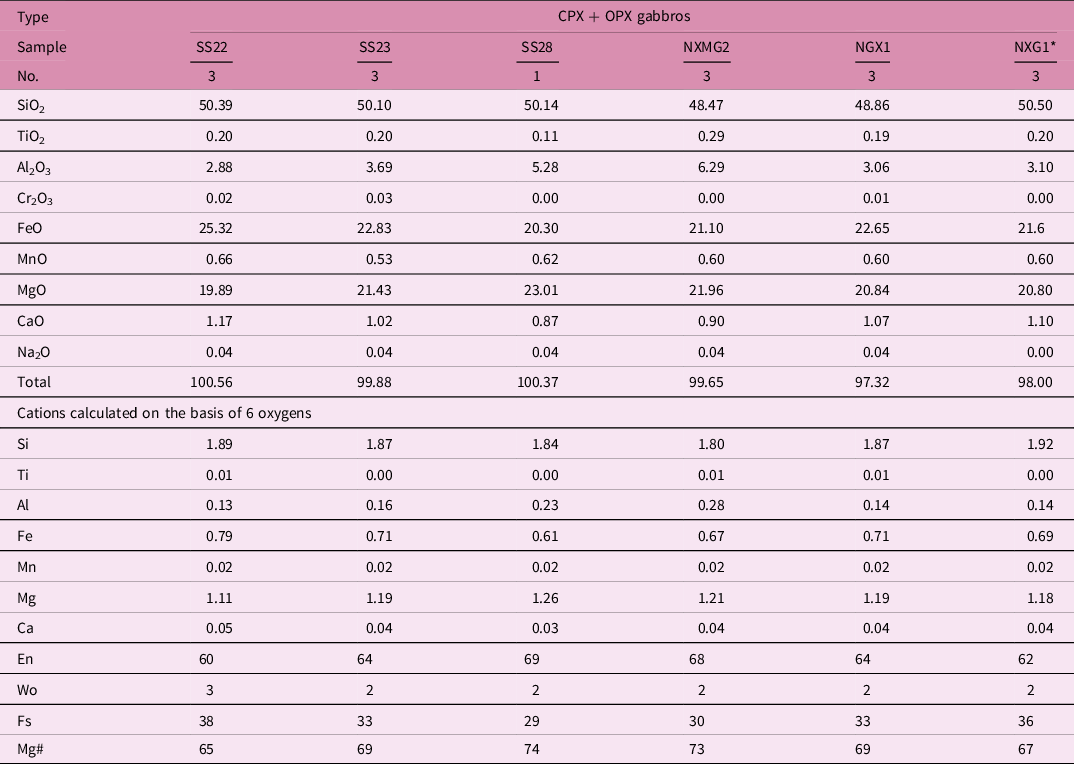
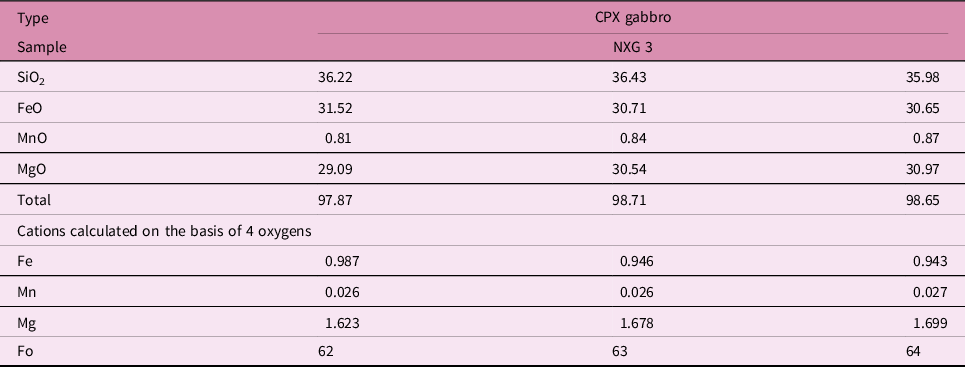
Orthopyroxenes have composition ranges of En62–69Fs29–38Wo2–3 and classify as hypersthene (Table 4; Fig. 6). Their Mg# ranges from 65 to 74. Na2O and CaO contents are very low (<0.04 wt % and 0.87 to 1.17 wt %, respectively). Olivine in one sample averages Fo63 (Table 5). Spinels have low Cr2O3 (0.51 to 0.67 wt %; Table 6) and belong to the pleonaste solid solution series (Mg,Fe)Al2O4 between MgAl2O4 (spinel sensu stricto) and FeAl2O4 (hercynite).
Electron probe micro-analysis of orthopyroxenes

Electron probe micro-analysis of olivine

Electron probe micro-analysis of spinels

4.d. Rb–Sr age determination
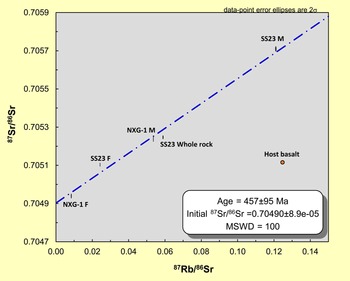
Rb and Sr concentrations and Sr isotopic ratios of one bulk sample of a two-pyroxene xenolith (SS23) and hand-picked mafic (M; cpx-rich) and felsic (F; feldspar-rich) crushed portions of this same xenolith and of another two-pyroxene xenolith (NXG1) are presented in Table 7. Felsic portions of these samples have significantly higher Sr contents (Table 7). The data plot broadly along a line, suggesting an approximate age of 457 ± 95 Ma (Fig. 8), but both accuracy and precision are low, and this cannot be considered as an isochron.
Rb and Sr concentrations and Sr isotopic ratios of bulk and hand-picked mafic (M; cpx-rich) and felsic (F; feldspar-rich) portions of two xenoliths

Rb–Sr concentrations and Sr-isotopic data for xenolith samples based on clinopyroxene-rich and plagioclase-rich mafic and felsic separates from two xenolith and one bulk xenolith samples. The 87Sr/86Sr and 87Rb/86Sr ratio of the host basalts (Saadat & Stern, Reference Saadat and Stern2012) is also plotted.

5. Discussion
5.a. Xenolith protoliths
The crustal xenoliths from NE Iran are composed of minerals (plagioclase feldspar, clinopyroxene, orthopyroxene, olivine) common in mafic igneous rock. They lack alumino-silicates (sillimanite, kyanite) common in metasedimentary rocks, and they contain low SiO2 <53 wt % and high MgO >4.9 wt %, suggesting an igneous origin. We interpret them as recrystallized gabbros formed originally by crystallization from a mafic magma. We suggest that the two-pyroxene gabbro sample SS22 represents a chilled liquid; a holocrystalline equivalent of an original mafic magma composition, as both its major and trace element chemistry are similar to many basalts. In contrast, Cpx gabbro SS21, with lower SiO2, Na2O and K2O, and higher CaO than most typical basalts, may contain higher proportions of cumulus clinopyroxene. Its unusual convex REE pattern, with middle rare earth elements (MREE) higher than LREE, is also indicative of a Cpx cumulate based on the empirically determined partition coefficients between clinopyroxene and basalt (Schnetzler & Philpotts, Reference Schnetzler and Philpotts1970; Sun, Reference Sun and White2018).
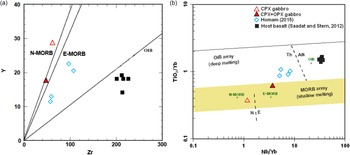
The gabbroic crustal xenoliths are unlikely to be co-genetic with their host alkali basalt. The host basalt plots in the alkali basalt and foidite fields on a total alkali–silica classification diagram (Fig. 3) and in the alkali basalt field of oceanic island basalts (OIB) on trace element discrimination diagrams (Fig. 9), while the gabbroic xenoliths have compositions similar to tholeiitic mid-ocean ridge basalts (MORB). The two-pyroxene xenolith, which we consider to be representative of the basaltic magma from which all the gabbroic xenoliths crystallized, displays trace element contents and REE patterns which are in general very distinct from the host alkali basalt (Fig. 5). For example, Nb and Zr contents in this xenolith are 6.9 and 48 ppm, respectively, significantly lower than the host basalt, with Nb of 46 ppm and Zr of 214 ppm (Saadat & Stern, Reference Saadat and Stern2012). The basaltic host rock also has higher La/Yb >16 compared to the two-pyroxene gabbroic xenolith with La/Yb <7 (Fig. 5). While the basaltic host rocks are Neogene/Quaternary in age, the Sr isotopic data (Fig. 8) suggest, despite the uncertainty in the data, that the xenoliths are significantly older.
(a) Plot of Y vs Zr (ppm) for crustal xenoliths, their host basalt and gabbros from NE Iran. The xenoliths and gabbros plot in the MORB field. N-MORB (normal), E-MORB (enriched) and OIB are from Sun & McDonough (Reference Sun and McDonough1989) and Haase et al. (Reference Haase, Stoffers and Garbe-Schönberg1997). (b) TiO2/Yb vs Nb/Yb (Pearce, Reference Pearce2008) showing the trends for MORB and OIB magmas. The crustal xenoliths are comparable to MORB.

The two-pyroxene gabbroic xenolith does not show distinctive negative Nb or Ta anomalies characteristic of subduction-related igneous rocks (Taylor & McLennan, Reference Taylor and McLennan1985; Kempton et al. Reference Kempton, Harmon, Hawkesworth and Moorbath1990; Rudnick & Fountain, Reference Rudnick and Fountain1995). This xenolith plots in the tholeiitic MORB field in the Y vs Zr diagram (Fig. 9) and other trace element ratio discrimination diagrams (not shown). The ratios of incompatible trace elements in this xenolith, such as Nb/Yb of 3.7 (Fig. 9), Nb/Th of 18.6 and Ta/U of 5.1, are all similar to MORB.
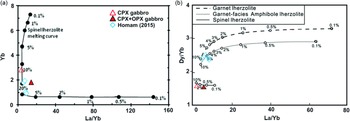
In summary, the major and trace elements characteristics of the xenoliths classify them as low-K and low-Ti gabbros with tholeiitic MORB affinities and support a MORB-type mantle source for the origin of the tholeiitic basaltic magma from which these gabbroic xenoliths crystallized. Based on its HREE concentrations and the low (La/Yb)N of 4.6 and Lu/Hf of 0.2, the primary magma from which the two-pyroxene xenolith crystallized can be attributed to melting in the garnet-free spinel facies of MORB-source type upper mantle peridotite (Fig. 10; Frey & Prinz, Reference Frey and Prinz1978; Langmuir et al. Reference Langmuir, Klein and Plank1992; Thirlwall et al. Reference Thirlwall, Upton and Jenkins1994; Beard & Johnson, Reference Beard and Johnson1997; Farmer, Reference Farmer2003). This is because, compared with their mantle source, there is only a very small change in La/Yb ratio during spinel-facies melting (Fig. 10), while in contrast, there are large changes in La/Yb associated with melting in the garnet facies (Baker et al. Reference Baker, Menzies, Thirlwall and MacPherson1997).
(a) Yb vs La/Yb, and (b) Dy/Yb vs La/Yb, for the xenolith and nearby gabbros, compared to fractional melting curves for spinel (0.578 Ol, 0.270 Opx, 0.119 Cpx and 0.033 Sp that melts in the proportions 0.10 Ol, 0.27 Opx, 0.50 Cpx and 0.13 Sp) and garnet (0.598 Ol, 0.211 Opx, 0.076 Cpx and 0.115 Gt that melts in the proportions 0.05 Ol, 0.20 Opx, 0.30 Cpx and 0.45 Gt) lherzolites.

5.b. Thermobarometry
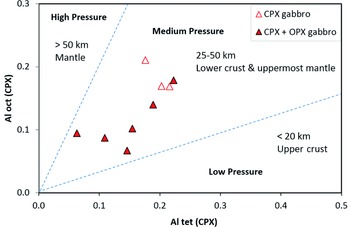
The AlIV/AlVI diagram is used to discriminate between pyroxenes from high- and low-pressure origins (Fig. 11; Aoki & Shiba, Reference Aoki and Shiba1973). Clinopyroxenes from xenoliths show AlIV/AlVI ratios ranging from 0.66 to 1.2. These ranges indicate that the studied samples were formed in mid- to lower crustal depths rather than in the mantle.
AlIV vs AlVI diagram for clinopyroxenes. Pressure domains are from Aoki & Shiba (Reference Aoki and Shiba1973).

The lack of garnet in the studied xenoliths suggests mid- rather than lower crustal depths of crystallization. A maximum pressure estimate of the studied xenolith samples, based on the mineral assemblages, in particular the absence of garnet, would be c. 11 kbar (e.g. Miller, Reference Miller1982). However, the lack of garnet essentially precludes all high-confidence thermobarometers, which typically involve garnet–pyroxene or garnet–hornblende equilibria. The pyroxene thermobarometer of Putirka et al. (Reference Putirka, Mikaelian, Ryerson and Shaw2003) and Putirka (Reference Putirka2008) gives a crystallizing pressure between 5 and 8 kbar, equivalent to depths of 15–25 km, and a temperature range between 950 and 960 °C using their two-pyroxene geothermometer and assuming a crystallizing pressure of 6–11 kbar (Fig. 12). In contrast, Su et al. (Reference Su, Chung, Zarrinkoub, Pang, Chen, Ji, Brewer, Ying and Khatib2014) presented equilibrium temperature and pressure estimates of crustal xenoliths from this locality to be c. 9 kbar and 850 °C based on an extrapolation of their calculated mantle geotherm into the lower crust (Fig. 12). Mantle xenoliths from the same locality equilibrated in the subcontinental lithosphere at depths of 30 to 60 km and temperatures of 965 °C to 1065 °C (Fig. 12; Saadat & Stern, Reference Saadat and Stern2012; Su et al. Reference Su, Chung, Zarrinkoub, Pang, Chen, Ji, Brewer, Ying and Khatib2014). These estimates are consistent with a crustal thickness of ≤42 km below the xenolith locality (Su et al. Reference Su, Chung, Zarrinkoub, Pang, Chen, Ji, Brewer, Ying and Khatib2014).
The crustal and upper mantle structure below NE Iran, modified from Su et al. (Reference Su, Chung, Zarrinkoub, Pang, Chen, Ji, Brewer, Ying and Khatib2014) based on the pressure and temperature conditions of equilibrium of the mafic crustal and ultramafic mantle xenoliths.

5.c. Regional tectonic implication
The timing of the intrusion into the crust of the mafic magmas that crystallized to form the gabbroic proto-lithologies of the meta-gabbroic crustal xenoliths from NE Iran is uncertain, but the Sr isotopic data suggest a possible Ordovician age (Fig. 8). Ordovician mafic magmatism in NE Iran is represented by some exposures of Ordovician gabbros in the Chahak area (Fig. 1; Partovifar, Reference Partovifar2012; Shojaee kavah, Reference Shojaee kaveh2014; Homam, Reference Homam2015) ∼20 km NW of the Neogene/Quaternary alkali basalts that contain the meta-gabbroic xenoliths described above. It has been suggested that the formation of these mafic Ordovician igneous rocks, covered by weakly or unmetamorphosed Ordovician sediments with zircon age peaks of 450–492 Ma (Stampfli et al. Reference Stampfli, Marcoux and Baud1991; Stampfli & Borel, Reference Stampfli and Borel2002; Shafaii Moghadam et al. Reference Shafaii Moghadam, Li, Griffin, Stern, Thomsen, Meinhold, Aharipour and O’Reilly2017 a, b), was the result of a short orogenic event related to the opening of the Palaeotethys ocean during the Ordovician and Silurian (Ranjbar Moghadam et al. Reference Ranjbar Moghadam, Masoudi, Homam, Kerfo and Mohajel2018).
The major and trace element concentration in the meta-gabbroic crustal xenoliths are similar to the Ordovician age tholeiitic hornblende gabbros from the Chahak area (Table 1; Figs 3, 4 and 5). The tholeiitic geochemistry of both the meta-gabbroic crustal xenoliths and these Ordovician gabbros is consistent with an origin by shallow spinel–lherzolite mantle melting of a MORB-source type mantle, possibly related to rifting associated with the formation of the Palaeotethys ocean basin. However, more work is needed to obtain a precise age for the intrusion of the mafic magmas that formed the proto-lithology of the meta-gabbroic crustal xenoliths.
6. Conclusions
-
1) The crustal xenoliths hosted within Neogene/Quaternary alkaline basalt in NE Iran rose to the surface rapidly in magmas erupted along pathways associated with local extension produced by NE–SW-trending strike-slip faults (Saadat & Stern, Reference Saadat and Stern2012).
-
2) The xenoliths are classified as meta-gabbros with tholeiitic affinities. Geothermobarometry indicates these xenoliths recrystallized at middle to lower crustal conditions.
-
3) The tholeiitic mafic magmas from which the gabbroic xenoliths crystallized were produced by moderate degrees of partial melting of a MORB-source type spinel–lherzolite mantle, possibly as a result of Ordovician magmatic activity related to the opening of the Palaeotethys ocean.
Acknowledgements
We would like to thank Lang Farmer and Emily Verplanck for granting us access to their thermal ionization mass-spectrometry (TIMS) laboratory and their assistance in obtaining the isotopic data for this study. We are grateful to Dr Ghoorchi for her support in preparing figures, and H Ebrahimzadeh and H Maadani for their assistance in the field. We also want to thank H Downes and two anonymous reviewers, as well as the editors KM Goodenough and S Sherlock, for constructive comments that improved the final manuscript.