Implications
In young calves, weaning off milk at an early age is an effective method to reduce the cost of rearing through decreased milk consumption and increased calf starter intake. On the basis of the results of this experiment, buffalo calves successfully adapted to early weaning that might help to mitigate issues like poor growth and low returns associated with traditional calf rearing practices. Furthermore, this study effectively reduced the weaning age from 1 year to 8 weeks of age. These results suggest that this approach would be useful in reducing the age of puberty in buffalo heifers, which at the moment is around 3 to 3.5 years.
Introduction
Weaning of calves from milk at an early age is practiced to reduce the cost of milk feeding (Owen and Larson, Reference Owen and Larson1982; Quigley et al., Reference Quigley, Caldwell, Sinks and Heitmann1991). From birth to weaning, calves undergo a transition from monogastric to ruminant that is greatly influenced by the type of feeding. The feeding of calf starter (CS) has been believed to enhance the ruminal volatile fatty acid (VFA) production necessary for early development of a functional rumen (Beharka et al., Reference Beharka, Nagaraja, Morrill, Kennedy and Klemm1998; Zitnan et al., Reference Zitnan, Kuhla, Sanftleben, Bilska, Schneider, Zupcanova and Voigt2005).
Conventionally, buffalo calves are kept with the dam and are allowed to suckle a little amount of milk along with seasonal green forage, and weaned around the age of 1 year (Khan et al., Reference Khan, Khan, Ahmad and Raziq2007b). Poor feeding and management practices result in a high mortality rate of up to 85.2% (Ahmad et al., Reference Ahmad, Yaqoob, Hashmi, Zaman and Amjad2009), and poor growth rates indicated by lower live BW of around 60 to 80 kg at the end of 1 year (Younas and Yaqoob, Reference Younas and Yaqoob2002). These circumstances can be improved by adopting early weaning (EW) strategies that limits the use of milk and increases the use of CS feed. Previously, it has been found that reducing the weaning age in cattle calves has no effect on growth performance (Klein et al., Reference Klein, Kincaid, Hodgson, Harrison, Hillers and Cronrath1987; Quigley et al., Reference Quigley, Caldwell, Sinks and Heitmann1991; Hopkins, Reference Hopkins1997) with concomitant reduction in cost of rearing (Quigley, Reference Quigley1996). In a recent investigation Kehoe et al. (Reference Kehoe, Dechow and Heinrichs2007) weaned calves at 3, 4, 5 and 6 weeks of age and reported no differences in growth performance and feed efficiency (FE).
To the best of our knowledge limited information is available about the performance of buffalo calves in response to weaning from milk. Therefore, the primary objective of this study was to reduce weaning age, and the secondary objective was to evaluate the growth performance, FE and changes in blood metabolites.
Material and methods
The experiment was conducted at the Buffalo Research Institute, Pattoki, Pakistan. The experiment was approved by the Animal Research Committee, Department of Animal Nutrition, University of Veterinary and Animal Sciences, Lahore, Pakistan.
Animals, management and treatments
Twenty-four newly born Nili-Ravi male buffalo (Bubalus bubalis) calves were procured from the Buffalo Research Institute during the month of August and September, 2008. Calves were ear tagged for identification and kept with their dam for 3 days to ensure the adequate consumption of colostrum. After colostrum feeding, calves were separated from the dam, weighed and moved to calf sheds bedded with rice straw. The calves were individually fed fresh whole milk twice daily at 0800 and 1700 h, until they were weaned off milk. Milk feeding was carried out using the stainless steel buckets fitted with rubber nipples (De Laval). Milk feeding buckets were placed in an iron stand, fixed against the wall 68 cm above the ground. After each feeding, the buckets and nipples were washed and dried.
Calves were vaccinated, against Hammeorhagic septicemia at week 3, using an s.c. injection of killed Pasteurella multocida vaccine (Veterinary Research Institute, Lahore, Pakistan). Calves that were found to be sick with scour were treated according to veterinary practices at the farm using an oral electrolyte solution and, if their body temperature was >39.5°C, they were given s.c. injection of ceftiofur sodium (Excenel, Pfizer,Exton, PA, USA) for at least 3 days.
Experimental design
At day 3 of age, a total of 24 calves (n = 8/treatment) were randomly assigned to one of the three treatments; continuous milk feeding (CMF), limited milk feeding (LMF) and EW and weaned off milk at the end of weeks 12, 10 and 8, respectively. Total duration of the study was 12 weeks. After colostrum feeding, calves were individually fed whole milk at 10% of their BW, adjusted weekly, until 6 weeks of age. After that, the allowance of milk for each calf in CMF treatment was gradually tapered to zero from week 7 through 12, using the week 6 intake as a base; whereas, the LMF calves were fed 7.5%, 5.0%, 3.5% and 1.5% of BW during week 7, 8, 9 and 10, respectively; and calves in the EW treatment were fed 5.0% and 2.5% of BW during weeks 7 and 8, respectively. CS was offered ad libitum from the 2nd week until the end of the experiment, with individual intakes recorded daily. Water was available ad libitum for each calf through the entire experiment.
Sampling and analysis
Milk samples were collected once per week in the morning and evening and transported to the laboratory in dry ice. Each weekly sample was composited and analyzed using a lacto-scan (Milk analyzer Lactoscan mcc, Milkotronic Ltd, Bulgaria). The average nutrient composition (%) of buffalo milk was as follows: total solids, 12.59 ± 0.59; fats, 4.37 ± 0.34; solid not fats, 8.21 ± 0.27; proteins, 3.45 ± 0.53; lactose, 4.34 ± 0.14 and ash, 0.77 ± 0.03.
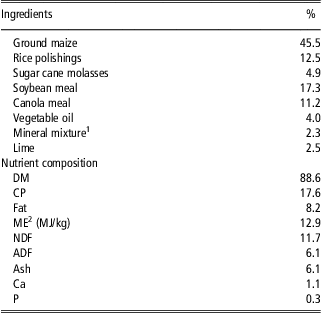
BWs, withers height (WH), heart girth (HG) and hip width (HW) were measured at the start of experiment and then on a weekly basis. WH was measured using a vertical standard with a crossbar and level. HG was determined using a measuring tape, and HW using calipers. Samples of CS were taken fortnightly, dried at 55°C in a forced air oven, ground to 1 mm using a Willy mill (Arthur H. Thomas, Philadelphia, USA) to determine dry matter (105°C for 3 h) and CP contents as N × 6.25 using a Kjeldahl apparatus (Gerhardt Kjeldatherm, Germany) (AOAC, 1990). Crude fat contents were determined using a Soxhlet Petroleum Ether Extractor (Dalton DS-115K, Japan) (AOAC, 1990). Ash determination was carried out in a muffle furnace at 550°C for 3 h. The NDF and ADF contents were determined using the methods described by Van Soest et al. (Reference Van Soest, Robertson and Lewis1991). The chemical composition of CS is presented in Table 1.
Composition and analysis of a calf starter diet on a DM basis
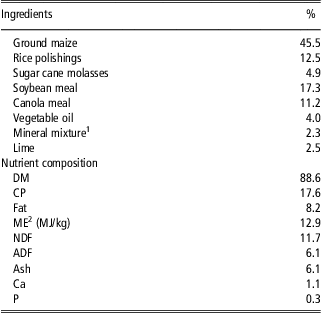
ME = metabolizable energy; DM = dry matter.
1Each kg contains di-calcium phosphate 70.81%, salt 18.91%, magnesium sulfate 8.64%, ferrous sulfate 8.64%, manganese sulfate 0.49%, zinc sulfate 0.22%, copper sulfate 0.03%, potassium iodide 0.009%, cobalt chloride 0.009%, sodium selenate 0.0015%.
2ME was calculated using the equation of NRC (2001).
Jugular blood samples were collected at the end of each week at 3 h post-morning feeding from week 6 to 12, using tubes coated with K3EDTA as an anticoagulant. Plasma was harvested by centrifugation (3000 × g for 20 min), divided into aliquots and stored in a refrigerator at −20°C until further analysis. Before the final analysis, samples were thawed completely to make sure that there was no ice and were analyzed for blood glucose and blood urea nitrogen (BUN) using colorimetric kits (Crescent Diagnostics, Saudi Arabia); whereas non-esterified fatty acids (NEFA) was determined using a Wako chemical kit (Wako chemicals, Japan).
Statistical analysis
Data were subjected to the Komologrov Smirnov's test to evaluate the presence of normal distribution. The variables: milk intake, CS intake, dry matter intake (DMI), BW and body measurements were analyzed using a repeated measure ANOVA. The model included treatments (CMF, LMF and EW) as fixed factors and analyzed the effect of each week among the treatment groups using a treatment × week interaction. Data for initial and final BW, FE were analyzed using ANOVA. Results are presented as means ± s.e. and declared statistically significant at P < 0.05. The statistical analysis was carried out using SPSS (Version 13.0 SPSS Inc., Chicago, IL, USA).
Results
Milk intake, starter intake and DMI
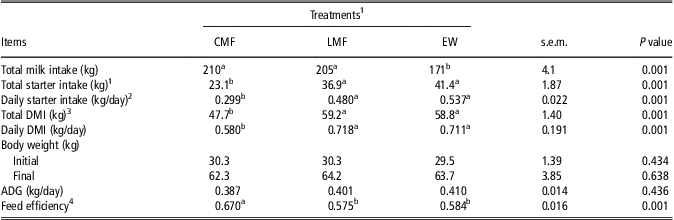
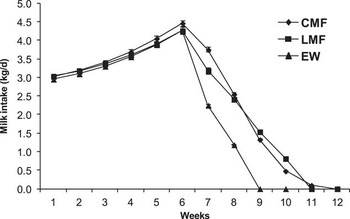
Total milk intake was lower (P < 0.05) in the EW calves compared with the CMF and the LMF calves (Table 2) by 22.6% and 19.6%, respectively. The interaction between treatment × week revealed that the mean daily milk intake was similar among all the treatment groups through week 6 (Figure 1). However, mean daily milk intake was lower (P < 0.01) in EW calves than it was in the other groups between weeks 7 and 8. The CMF calves consumed less (P < 0.01) milk during weeks 9 and 10 compared with the LMF calves (Figure 1). Calves remained generally healthy, and days with scour were not different between treatments (7.10, 7.25 and 6.95 for CMF, LMF and EW treatments, respectively).
Effect of different weaning regimen on intake, growth performance and feed efficiency of Nili-Ravi buffalo calves
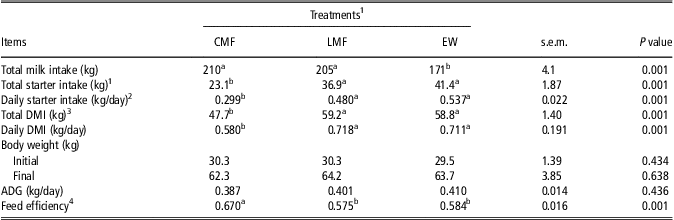
CMF = continuously milk fed; LMF = limited milk feeding; EW = early weaned; DMI = dry matter intake.
a-bValues in a row without a common superscript differ significantly (P < 0.05).
1Calves were fed milk at 10% of BW for the first 6 weeks. Thereafter, the milk allowance for CMF calves was gradually tapered to zero through week 12, using week 6 intake as a base. The LMF calves were fed milk at 7.5%, 5.0%, 3.5% and 1.5% of BW during weeks 7, 8, 9 and 10, respectively; whereas, EW calves were fed at 5.0% and 2.5% of BW during weeks 7 and 8, respectively.
2Calf starter intakes from weeks 2 to 12.
3DMI = dry matter intake expressed as DMI of calf starter plus milk.
4Feed efficiency expressed as the ratio of BW gain in kg: DMI kg.
Mean (±s.e.) of daily whole milk intake for buffalo male calves weaned using: continuous milk feeding (CMF; ⧫), limited milk feeding (LMF; ▪), and early weaning (EW; ▴). All calves were fed milk at 10% of BW for the first 6 weeks. After that, allowance for CMF calves was gradually tapered to zero through week 12, using week 6 intake as a base. Calves in the LMF treatment group were fed at 7.5%, 5.0%, 3.5% and 1.5% of BW during weeks 7, 8, 9 and 10, respectively. Whereas, the EW calves were fed 5.0% and 2.5% of BW during weeks 7 and 8, respectively. Calf starter was provided ad libitum from week 2 through 12.

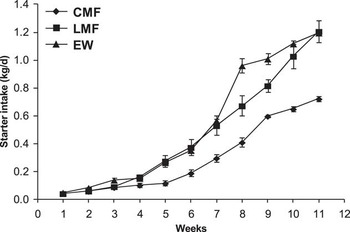
The total starter intake and average daily starter intake was greater (P < 0.05) in the EW and LMF calves than in the CMF calves (Table 2). Starter intake, during whole experiment, was greater in the EW (79.2%) and the LMF (59.5%) calves compared with the CMF calves. A significant treatment × week interaction was observed for CS intake (Figure 2). The EW calves showed a distinct increase (P < 0.01) in consumption of CS between weeks 9 and 10 of the study. Similarly, a greater (P < 0.01) intake was observed during weeks 11 and 12 in the EW and LMF calves compared with the CMF calves.
Mean (±s.e.) daily calf starter intake for buffalo male calves fed ad libitum from weeks 2 to 12 and calves weaned from milk using: continuous milk feeding (CMF; ⧫), limited milk feeding (LMF; ▪), and early weaning (EW; ▴). All calves were fed milk at 10% of BW for the first 6 weeks. After that, allowance for CMF calves was gradually tapered to zero through week 12, using week 6 intake as a base. Calves in the LMF treatment group were fed at 7.5%, 5.0%, 3.5% and 1.5% of BW during weeks 7, 8, 9 and 10, respectively; whereas, EW calves were fed 5.0% and 2.5% of BW during weeks 7 and 8, respectively.

Total DMI was greater (P < 0.05) in the LMF and the EW calves compared with the CMF calves by 24% and 23%, respectively (Table 2). The treatment × week interaction for DMI was significant (P < 0.01). Total DMI did not differ among the treatment groups during the first 5 weeks of the study but during weeks 9 to 12 a higher DMI (P < 0.01) was observed in the EW and LMF calves compared with the CMF calves.
Weight gain, FE and structural growth measurements
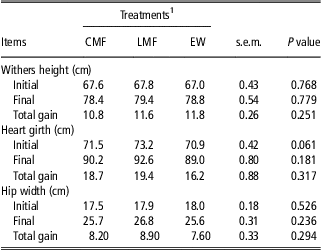
BW gain, average daily gain (ADG) and initial and final BW were not affected by the treatments (Table 2). However, the FE was greater (P < 0.05) in the CMF calves compared with the EW and LMF calves (Table 2). Measurements for WH, HG and HW were unaffected by treatments (Table 3). Further, the treatment × week interaction was also non-significant among all the treatment groups.
Effect of different weaning regimen on structural growth of Nili-Ravi buffalo calves
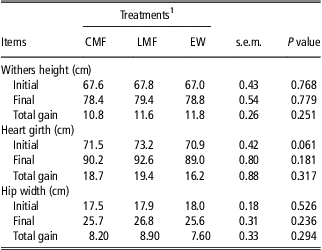
CMF = continuously milk fed; LMF = limited milk feeding; EW = early weaned.
1Calves in all treatment groups were fed milk at 10% of BW for the first 6 weeks. Thereafter, the allowance for CMF calves was gradually tapered to zero through week 12, using week 6 intake as a base. The LMF calves were fed milk at 7.5%, 5.0%, 3.5% and 1.5% of BW during weeks 7, 8, 9 and 10 respectively; whereas, EW calves were fed at 5.0% and 2.5% of BW during weeks 7 and 8, respectively. Calf starter was provided ad libitum from weeks 2 to 12.
Blood metabolites
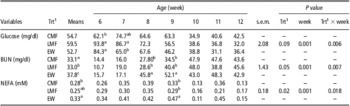
The concentration of blood glucose was not affected by treatments, whereas BUN was greater (P < 0.05) for the EW calves than that of the CMF and LMF treatment groups (Table 4). Plasma NEFA was higher (P < 0.05) in the EW compared with the CMF calves. However, for all the metabolites a significant treatment × week interaction (P < 0.01) was observed (Table 4). Week 6 blood glucose levels were higher (P < 0.01) within the LMF and EW groups than they were for the CMF group. In week 7, the LMF and CMF calves had higher blood glucose values than the EW calves. BUN was greater (P < 0.05) in the EW calves in weeks 8 and 9 than that of the calves on other treatments. Plasma NEFA concentration was greater (P < 0.01) for the EW calves in week 9 than it was for the CMF and LMF.
Effect of different weaning regimen on blood glucose, blood urea nitrogen and NEFA in Nili-Ravi buffalo calves

NEFA = non-esterified fatty acids; CMF = continuously milk fed; LMF = limited milk feeding; EW = early weaned.
a-bFor each variable values without a common superscript within a column differ significantly (P < 0.05).
1Treatments (Trt): CMF, LMF, and EW. Calves in all the treatment groups were fed milk at 10% of BW for the first 6 weeks. Thereafter, allowance for CMF calves was gradually tapered to zero through week 12, using week 6 intake as a base. The LMF calves were fed milk at 7.5%, 5.0%, 3.5% and 1.5% of BW during week 7, 8, 9 and 10, respectively; whereas, EW calves were fed at 5.0% and 2.5% of BW during weeks 7 and 8, respectively. Calf starter was provided ad libitum from week 2 through 12.
Discussion
Milk intake, starter intake and DMI
Results from this experiment revealed that the EW calves consumed 18.5% and 16.3% less milk than the CMF and LMF calves during the entire experiment, suggesting that a reduction in weaning age decreases the amount of milk consumed. Results of several investigations in cattle calves demonstrated there was no effect of weaning age on growth performance, and in addition there was a reduction in the costs associated with feeding (Anderson et al., Reference Anderson, Nagaraja, Morrill, Avery, Galitzer and Boyer1987; Quigley et al., Reference Quigley, Caldwell, Sinks and Heitmann1991; Kehoe et al., Reference Kehoe, Dechow and Heinrichs2007). Furthermore, despite a lower milk intake, EW calves showed similar growth performance to those weaned later (weeks 10 and 12). In one study, calves were fed 3.10, 4.84, 6.60, 8.34 kg/day of milk replacer with their weight gain being similar across all treatments (Kristensen et al., Reference Kristensen, Sehested, Jensen and Vestergaard2007). Milk consumption was higher during the first 6 weeks while consumption of CS was very low for the same period. Other researchers have also reported a decline in CS intake because of an increased amount of milk consumption (Appleby et al., Reference Appleby, Weary and Chua2001; Hammon et al., Reference Hammon, Schiessler, Nussbaum and Blum2002; Jasper and Weary, Reference Jasper and Weary2002). Improved nutrient balance because of milk intake might have prevented the calves from consuming solid feed. After 6 weeks, a distinct change in CS intake was observed in the EW calves. Their consumption increased from 0.57 kg/day in week 8 to 1.12 kg/day in week 10. The observed increase in CS intake might be attributed to the sudden and early restriction of milk feeding. Quigley (Reference Quigley1996) also reported that milk restriction is positively substituted through increased consumption of CS after weaning. However, the CMF calves showed a slow increase in CS intake that might be because of continuous milk provision. Similar observations have been documented by many researchers (Hodgson, Reference Hodgson1971; Huber et al., Reference Huber, Silva, Campos and Mathieu1984; Quigley, Reference Quigley1996).
In this study, a higher DMI and CS intake was observed in the LMF and EW calves compared with the CMF calves. Higher DMI may be attributed to increased CS intake, which is consistent with the observations of Quigley et al. (Reference Quigley, Caldwell, Sinks and Heitmann1991) and Hopkins (Reference Hopkins1997). Both of these studies reported that calves weaned earlier (at 28 days) showed an increased DMI and starter intake compared with those weaned later (at 56 days). In another study, a higher average daily feed intake was observed in the calves weaned early at 4 weeks of age compared with those weaned conventionally at 6 weeks of age (Anderson et al., Reference Anderson, Nagaraja, Morrill, Avery, Galitzer and Boyer1987). The distinct increase in CS consumption immediately after weaning in the EW and LMF calves may be a compensatory mechanism to overcome the sudden reduction of nutrient supply from milk (Quigley, Reference Quigley1996). In another study, it was suggested that a post-weaning reduction in milk supply might induce a hyperphagic response leading to increased solid feed intake (Khan et al., Reference Khan, Lee, Lee, Kim, Kim, Ki, Ha, Lee and Choi2007a).
Weight gain, FE and structural growth measurements
BW gain and ADG revealed that growth performance is not influenced by weaning age (Klein et al., Reference Klein, Kincaid, Hodgson, Harrison, Hillers and Cronrath1987; Quigley et al., Reference Quigley, Caldwell, Sinks and Heitmann1991; Hopkins, Reference Hopkins1997; Kehoe et al., Reference Kehoe, Dechow and Heinrichs2007) or by milk feeding methods (Quigley, Reference Quigley1996). The higher FE in the CMF calves may be attributed to the higher milk intake. Several other researchers have also reported higher FE because of higher milk consumption (Diaz et al., Reference Diaz, Van Amburgh, Smith, Kelsey and Hutten2001; Blome et al., Reference Blome, Drackley, McKeith, Hutjens and McCoy2003; Terré et al., Reference Terré, Devant and Bach2007). The results of body measurements are in agreement with previous studies on calves weaned at different ages (Galton and Brakel, Reference Galton and Brakel1976; Owen and Larson, Reference Owen and Larson1982; Kehoe et al., Reference Kehoe, Dechow and Heinrichs2007). During the first 6 months of age, changes in BW and structural growth are of great importance (Le Cozler et al., Reference Le Cozler, Lollivier, Lacasse and Disenhaus2008). In the current experiment, the similar body measurements (WH, HW and HG) obtained might be useful for buffalo heifer production and its subsequent lactation performance.
Blood metabolites
Plasma metabolites (blood glucose and BUN) are indicators of fermentative changes occurring in the developing rumen. In the current study, the mean values of glucose were not affected by treatment, which are in agreement with Kehoe et al. (Reference Kehoe, Dechow and Heinrichs2007) who reported no difference in blood glucose or BUN for calves weaned at 3, 4, 5 and 6 weeks of age. Furthermore, blood glucose decreased with age, and this decrease was more evident in the calves weaned earlier. In growing calves, transition from a functionally immature to mature rumen is associated with digestive adaptability as indicated by the metabolic shift from intestinally absorbed milk glucose to VFA production during ruminal fermentation of CS (Baldwin Vi et al., Reference Baldwin, McLeod, Klotz and Heitmann2004; Khan et al., Reference Khan, Lee, Lee, Kim, Kim, Ki, Ha, Lee and Choi2007a). In the current experiment, EW calves had the lowest glucose concentration. This may be because of a consistent increase in CS consumption during the post-weaning period (Quigley et al., Reference Quigley, Caldwell, Sinks and Heitmann1991). However, work from Quigley et al. (Reference Quigley, Caldwell, Sinks and Heitmann1991) suggested that a reduction in glucose concentration with age was more likely in response to reduced milk provision, which is absorbed and metabolized faster than fermentation end products of the rumen resulting in lower blood glucose levels.
Higher levels of BUN in the EW calves might be related to higher CP intake (Khan et al., Reference Khan, Lee, Lee, Kim, Kim, Ki, Ha, Lee and Choi2007a) and a resultant higher degradation of dietary protein or deamination of amino acids (Funaba et al., Reference Funaba, Kagiyama, Iriki and Abe1994; Hadorn et al., Reference Hadorn, Hammon, Bruckmaier and Blum1997). In this experiment, we reported a relatively higher BUN concentration compared with values documented in cattle calves. This could be a species difference as Sultan et al. (Reference Sultan, Javaid, Nadeem, Akhtar and Mustafa2009) also reported higher values (up to 37 mg/dl of blood) in the growing Nili-Ravi buffalo calves that were fed a TMR with varying RUP to RDP levels. High levels of BUN can result in renal dysfunction, but we did not observe any renal problems during this experiment. This also indicates that buffalo calves have the capability to tolerate higher levels of BUN without any harmful effects. An increase in BUN concentration with age has been reported in cattle calves by other investigators (Quigley, Reference Quigley1996; Quigley et al., Reference Quigley, Wolfe and Elsasser2006).
The higher NEFA values for EW calves might be because of increased mobilization of fat reserves, ultimately increasing gluconeogenic activity in the liver to fulfill higher energy demands for growth (Baldwin Vi et al., Reference Baldwin, McLeod, Klotz and Heitmann2004). Another possible explanation could be the higher fat contents of CS resulting in increased NEFA concentrations because of higher intake in the EW calves (Thomas, Reference Thomas2006). Contrary to our observation, Quigley et al. (Reference Quigley, Caldwell, Sinks and Heitmann1991) reported lower plasma NEFA concentration during the post-weaning period in calves weaned earlier at day 28 to those weaned later at day 56. Higher values of NEFA in buffalo calves weaned earlier may be because of species differences.
EW of buffalo calves at the age of 8 weeks reduced the rearing cost and increased profitability because of the higher intake of low-cost CS rations (Quigley, Reference Quigley1996; Kehoe et al., Reference Kehoe, Dechow and Heinrichs2007). Furthermore, during this study, it was also observed that the feeding management of the EW calves was less labor intensive than conventional milk feeding (for longer periods of time). The area of calf nutrition in relation to EW has been studied extensively in cattle, and has helped calf growers establish standard feeding and management practices. Likewise, the results of this study will help in improving the overall feeding management of young male buffalo calves.
Conclusion
In young buffalo calves, the regimen of weaning at 8 weeks of age was more effective compared with those weaned at 10 and 12 weeks of age. The early weaned calves showed similar growth rate to those in the CMF and LMF by consuming more CS and saving a substantial amount of milk for human consumption. Hence, reducing weaning age did not affect the growth performance of Nili-Ravi buffalo calves by 12 weeks of age.
Acknowledgements
This study was funded by Higher Education Commission (HEC) of Pakistan. The authors acknowledge the Director, Farm Manager and staff of the Buffalo Research Institute Pattoki, Pakistan for assistance in the project. We are also thankful to Kenneth F. Kalscheur, Meredith Brent (South Dakota State University) and Russell Bush (The University of Sydney) for helping in the manuscript writing and editing.