Introduction
In recent works, analysis of instrumented indentation load–displacement, P–h, behavior was extended beyond consideration of materials exhibiting elastic–plastic deformation [Reference Oliver and Pharr1], primarily metals and ceramics, to viscoelastic–plastic materials [Reference Gayle and Cook2, Reference Cook3], primarily polymers, and densifying materials, primarily open-cell foams [Reference Cook4]. A feature of these works was analysis of the commonly encountered P–h response generated by instrumented indentation instruments during pyramidal indentation of materials. The underlying mechanisms of viscous deformation and cell crushing were modeled to predict P–h responses that could then be compared directly with experimental observations. In both cases, suppression of the modeled viscous or densification processes led to limiting elastic–plastic behavior. Here, instrumented indentation measurement techniques and analyses are further extended to consider brittle materials exhibiting fracture—specifically, crack initiation—during pyramidal indentation. Similarities and differences between the previous and current works include the following: (i) The indentation process will still be regarded as load-controlled, but the loads will be much greater than hundreds of millinewtons (≈0.1 N) considered previously and of order tens of newtons (≈10 N) commonly encountered for indentation fracture. (ii) The output will still be a P–h response for a material, but the focus will be on the sequence of crack initiation events placed on an invariant elastic–plastic P–h curve rather than perturbation of the P–h response by variations in elastic, plastic, viscous, or densification processes. In particular, (iii) fracture during indentation will be considered as in brittle foam crushing [Reference Cook4], but cracking will not be considered to alter the compliance, and thus P–h behavior of the indentation system. Finally, (iv) as before, the analysis will be adapted by detailed quantitative comparison with experimental observations, in this case with crack initiation observations on a range of brittle glasses, single crystals, and polycrystals [Reference Cook and Pharr5, Reference Cook, Liniger and Pascucci6, Reference Tandon, Green and Cook7, Reference Tandon and Cook8, Reference Tandon and Cook9, Reference Chaudhri and Enomoto10, Reference Thurn, Morris and Cook11, Reference Thurn and Cook12, Reference Yoshida, Kato, Yokota, Sasaki, Yamada, Matsuoka, Soga and Kurkjian13].
The output of the analysis in terms of crack initiation sequences derives from two linkages of two independent indentation analyses: The first analysis is that for indentation displacement h as a function of load P, based on expressing the indentation process as two nonlinear displacement elements in series. The analysis was initially developed to describe viscoelastic–plastic indentation [Reference Oyen and Cook14, Reference Cook and Oyen15], forming the basis for recent work [Reference Gayle and Cook2, Reference Cook3], and devolves to elastic–plastic indentation by the removal of a viscous element [Reference Cook3, Reference Oyen and Cook14, Reference Cook and Oyen15]. The second analysis is that for indentation stress-field components σ as a function of P, based on expressing the stress field as two superposed contact fields. The analysis was first developed by Yoffe [Reference Yoffe16] to describe elastic–plastic indentation of brittle materials and was the basis for rationalization of material dependence in an extensive set of indentation cracking sequence observations [Reference Cook and Pharr5]. The first linkage between these two analyses follows the rationalization of the cracking sequence observations by connecting the indentation-induced stress field to the measured time-varying contact load. The second, additional, linkage connects the stress required for crack initiation, via the indentation-induced time-varying crack nucleus size [Reference Lathabai, Rödel, Dabbs and Lawn17], to the contact displacement. In this way, a fracture mechanics-based description of indentation crack initiation sequences is developed, greatly extending the “strength of materials” rationalization used earlier. Such sequences are critical to the designers, manufacturers, and users of brittle materials such as ceramics, glasses, and semiconductors, as contact-induced cracks determine component appearance, erosion, and strength.
The work here begins by outlining the major indentation crack types and cracking sequences. This is followed by the development of analyses for indentation deformation and fracture. The results are presented as variations and interpretations of cracking sequences as functions of indentation load and material properties. Emphasis is placed on locating fracture events on the commonly used P–h curves. The discussion compares the current analysis with previous related work and examines the implications for materials testing and strength.
Background: indentation cracking observations
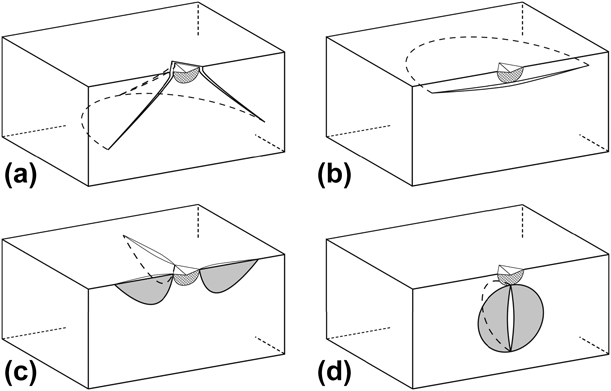
Cracks of many different morphologies are generated at contacts on brittle material surfaces: the most familiar perhaps is the cone crack, formed at surface contacts that generate elastic strain in the material (prior to cracking). The cracks are shaped like truncated circular cones and are associated with predominantly “blunt” contacts such as stones on automobile windshields. Cone cracks can also form at “sharp” surface contacts [Reference Cook and Pharr5, Reference Tandon, Green and Cook7, Reference Tandon and Cook8] that generate a localized zone of plastic deformation in the material beneath the contact as well as an extended surrounding elastic zone. A cone crack at a plastic deformation zone (hatched) formed by a sharp Vickers indentation contact is shown in Fig. 1(a). The next most familiar surface crack is the lateral crack, also formed at sharp elastic–plastic contacts. These cracks are shaped like discs, propagating parallel to the material surface and laterally away from the contact axis, Fig. 1(b), which is perpendicular to the surface. At large contacts, the lateral cracks turn and propagate toward the surface, frequently removing a visible “chip” from the material. These cracks are largely responsible for surface erosion of brittle materials. Elastic–plastic contacts also generate two other crack morphologies that are usually not visible, but which are largely responsible for controlling the strength of brittle materials. The first of these, formed at small contact loads, are radial cracks: small, surface-localized, cracks generated in the surface of a material that radiate away from the edges of small localized contacts, Fig. 1(c). These cracks cause fracture under subsequent applied loading of a component and thus control strength. The second of these, formed at large loads, is the median crack: a circular-shaped crack generated on a median plane beneath the plastic deformation zone, typically as one of two perpendicular cracks, Fig. 1(d). Under subsequent applied loading of a cracked component, these cracks also cause failure by fracture.
Schematic cross-sections of major crack types at elastic–plastic indentations. (a) Cones. (b) Laterals. (c) Radials. (d) Medians. Plastic zone shown hatched; crack planes normal to surface shown shaded.

The crack types illustrated in Fig. 1 typify the four major indentation fracture geometries and are thus the focus here in terms of cracking sequences. The four types have some similarities and differences. Figures 1(a) and 1(b) are predominantly parallel to the surface, (c) and (d) are both perpendicular to the surface, and thus (a) and (b) influence surface appearance, material removal, and erosion, and (c) and (d) influence component strength. (a) and (c) initiate at the periphery of the plastic deformation zone at the surface, and (b) and (d) initiate at the periphery of the plastic deformation zone below the surface. (d) is also known as a “penny” crack. At large loads, (c) and (d) may coalesce to form “half-penny” cracks [Reference Tandon, Green and Cook7] that severely limit strength. There are other important variations: median cracks are generated beneath sharp linear contacts, such as those by glass-cutting rollers or scribes that generate linear plastic deformation zones. These cracks are ribbon shaped, extending perpendicular to the surface beneath the plastic deformation zone along the median contact line (e.g., during “cutting” of glass). Lateral cracks are also generated at linear contacts, forming parallel to the surface before propagating toward the surface and removing material. These cracks are largely responsible for visible scratches and surface wear of brittle materials. Detailed descriptions of crack morphologies at point contacts and line contacts are given elsewhere [Reference Cook and Pharr5, Reference Cook18].
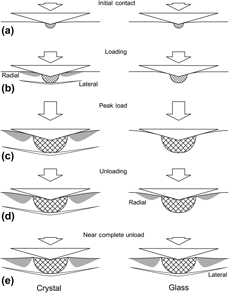
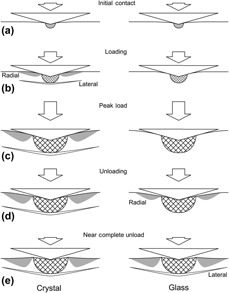
The idealizations of Fig. 1 do not indicate how the various crack types may interfere with each other or how the propagation of one crack type may reduce the crack driving force, associated with either the plastic deformation zone or an applied stress, on another crack system. Hence, there is a great need to predict the sequence of crack types—cone, lateral, radial, and median—at contacts on brittle materials. This sequence determines the appearance of components by formation of chips or scratches, removal of component surfaces by erosion or wear, and strength of components by crack propagation. The difficulty of predicting this sequence is that it is not universal but dependent on the values and interactions of the elastic, plastic, and fracture properties of a material. An example of the extreme difference in indentation cracking sequence is shown in Fig. 2, which compares the behavior of single crystal magnesium oxide (scMgO) (left) with soda-lime silicate glass (SLG) (right) for a moderate (<40 N) peak contact load. On initial contact, the scMgO exhibits elastic and plastic deformation. At a very small load, radial and lateral cracks initiate nearly simultaneously in the scMgO. On continued loading, the surface elastically and plastically deforms, and the radial and lateral cracks grow and extend until peak load. On unloading, the surface recovers elastically and the plastic zone and cracks remain at their maximum sizes attained at peak load. At complete unload, the surface exhibits elastic uplift associated with the plastic zone and associated residual stress field. This sequence is in accord with the intuition that cracks form on contact. In SLG, the sequence is completely different. There is elastic and plastic surface deformation during loading but no cracks initiate, even for sustained peak loads. During unloading, the surface recovers elastically and the plastic zone remains invariant at the size set by the peak load, until, typically at about half the peak load, radial cracks initiate, and extend during continued unloading. Near complete unload, lateral cracks initiate, typically to a very large size. This sequence is not in accord with intuition. In many cases, the final configurations are similar, as shown in Fig. 2. There are two important variations or additions to Fig. 2. In single crystals or polycrystals, a hybrid of Fig. 2 is common, in which radial cracks initiate on loading and lateral cracks initiate on unloading. The final configuration is as in Fig. 2. In the anomalous or densifying glasses, cone cracks initiate at small loads during the loading cycle, and in the normal or shearing glasses, median cracks initiate at large loads during the loading cycle. In these cases, the final configuration is the superposition of the appropriate cracks from Figs. 1 and 2.
Schematic diagrams of observed extremes of fracture sequences during indentation loading and unloading, typified by crystalline MgO (left) and soda-lime silicate glass (SLG) (right). In the crystal, after initial crack-free contact (a), radial (R) and lateral (L) cracks form simultaneously during loading (b) and extend until peak load is reached (c). During unloading (d), (e) the cracks remain static. In the glass, no cracks form during loading, (a), (b), and (c). During unloading (d), radial cracks form and extend during continued unloading and subsequently lateral cracks form near the end of the contact cycle (e). Plastic zones shown hatched.

The sequences summarized above derive primarily from a previous work [Reference Cook and Pharr5] that reviewed, determined, and analyzed cracking morphologies and sequences at sharp indentations in an extensive range of transparent brittle materials. A goal of that work was to assess the effects of elastic and plastic properties variation on cracking sequences in a range of materials, extending the earlier work restricted to glass. A key part of that work was the use of an instrumented indentation apparatus that allowed cracking sequences to be observed in situ during the simultaneous measurement of the P–h response. The instrument had its origins in similar, earlier, in situ instruments that had been used to study cracking sequences as a function of indentation load in glass [Reference Howes19, Reference Arora, Marshall, Lawn and Swain20, Reference Marshall and Lawn21, Reference Lawn, Dabbs and Fairbanks22] and in the developing concept of “nanoindentation” that focused on the simultaneous measurement of the load and displacement during very small indentations [Reference Oliver and Pharr1]. The latter obviated the need for indentation observations for elastic and plastic properties measurements. The in situ instrument and similar instruments were used to study indentation cracking sequences in surface-stressed ion-exchanged and tempered glasses [Reference Tandon, Green and Cook7, Reference Tandon and Cook8, Reference Tandon and Cook9], and other transparent polycrystalline, glass, and single crystal materials [Reference Cook, Liniger and Pascucci6, Reference Thurn, Morris and Cook11] and load and displacement behavior of large indentations in opaque materials [Reference Cook, Liniger and Pascucci6, Reference Tandon, Green and Cook7, Reference Alcalá23, Reference Thurn and Cook24, Reference Sakai, Hakiri and Miyajima25]. Analyses resulting from use of such an instrument are considered next.
Analysis
Indentation deformation
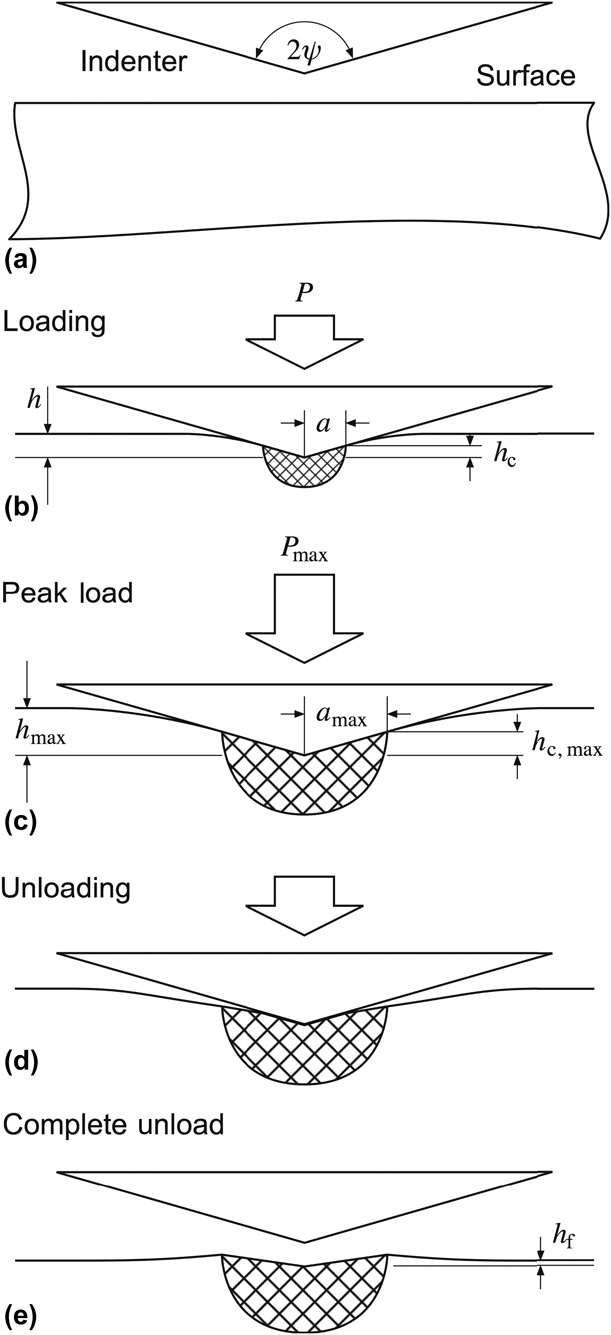
A schematic cross-section of an elastic–plastic indentation process is shown in Fig. 3. The indenter is considered a rigid cone of included angle 2ψ and the surface is considered flaw free, Fig. 3(a). For the Vickers diamond pyramid used here, the effective cone angle is ψ = 70.2°. During indentation loading, the surface deforms elastically and plastically, Fig. 3(b). Plastic deformation is localized in an approximately hemispherical zone, shown hatched, beneath the indentation contact and elastic deformation occurs both interior and exterior to the zone. In the interior, the indenter contacts the surface over axial contact depth h c such that the transverse contact radius a = h c tan ψ. For rigid-ideally plastic materials, h = h c reflects entirely plastic deformation. For the materials here, both h and h c contain components of elastic deformation and h > h c. At peak load, P max, the contact radius and displacement reach maximum values, a max = h c,max tan ψ, as does the total displacement h max beneath the indenter, Fig. 3(c). On unloading, the plastic deformation zone retains its transverse radius, but the contact radius decreases as the indenter “peels off” the surface, Fig. 3(d). Axial elastic recovery occurs interior and exterior to the zone. At complete unload, a contact impression remains with transverse radius reflecting the peak load value and partially recovered axial depth. The impression is imbedded in a residual plastic deformation zone that is in turn imbedded in a surrounding elastic matrix. A consequence of the elastic–plastic strain mismatch is that there is a stress field associated with the plastic deformation zone that acts during and after the contact cycle and leads to residual surface uplift and stress field. The final indentation displacement h f reflects the recovered impression depth and the surface uplift. The final transverse impression radius ≈ a max, such that the mean supported contact pressure, the hardness H, related to the yield stress of the material, is given by  $H = {{{P_{\max }}} / {\pi a_{\max }^2}}$ and this is the approximation used here.
Schematic diagram of indentation deformation development: (a) a pyramidal or conical indenter of the effective included angle 2ψ approaches a pristine surface; (b) during loading, a localized plastic deformation zone (hatched) is generated beneath the contact and the surface deforms elastically external and internal to the contact; (c) at peak load, the contact dimensions reach their maximum values; (d) during unloading, the plastic deformation zone retains its peak load dimensions and the elastic deformation recovers as the indenter reduces contact with the surface; (e) at complete unload, residual strain mismatch between the plastic deformation zone and the elastic matrix leads to recovery external and internal to the contact, residual uplift, and associated residual stress field.

Indentation deformation analysis that models Fig. 3 is summarized here and closely follows earlier work [Reference Cook and Oyen15]. The indentation is modeled in extensive P–h space as two quadratic deformation elements in series. The first, plastic, element has a load–displacement relation of
 $${P_{\rm{P}}} = {\alpha _1}Hh_{\rm{P}}^2\quad ,$$
where P P is the load, h P is the plastic displacement, H is the hardness, and α1 is an indenter geometry constant given by α1 = π tan2 ψ, such that α1 = 24.5 here. The second, elastic, element has a load–displacement relation of
 $${P_{\rm{E}}} = {\alpha _2}Mh_{\rm{E}}^2\quad ,$$
where P E is the load, h E is the elastic displacement, M is the indentation modulus, and α2 is an indenter geometry constant given by α2 = (π/2)tan ψ, such that α2 = 4.36. For a rigid indenter and elastically isotropic material, M is the material plane-strain modulus. The elastic and plastic elements are added in series, such that the total displacement h is the sum of the individual displacement elements:
 $$h = {h_{\rm{E}}} + {h_{\rm{P}}}\quad .$$
The indentation protocol considered here is load control using a triangle-wave load spectrum, Fig. 4(a). P and h are parameterized as functions of time, t, although time will not appear explicitly in this analysis. The total spectrum time is 2000 s; peak load, here 40 N, is indicated by a vertical line throughout Fig. 4. The load P is common to both elements, but the elastic and plastic elements are distinguished by
 $${P_{\rm{E}}} = P\quad ,$$
 $${P_{\rm{P}}} = \max \left( P \right)\quad ,$$
such that the elastic displacement reflects the instantaneous load at t and the plastic displacement reflects the maximum load reached prior to t. The model does not distinguish interior and exterior deformation, but it is clear that h P ≈ h c and thus h E ≈ (h – h c). The total indentation displacement h is given by combining Eqs. (1)–(4) and that for the triangle load spectrum is shown as the solid line in Fig. 4(b). The plastic contribution to the displacement is shown as the dashed line in Fig. 4(b) and reflects an increase during loading to reach a maximum value at peak load that remains invariant during unloading. Full details are given elsewhere [Reference Cook and Oyen15].
Contact load, displacement, stress, and flaw variation in development of indentation crack initiation sequence model. (a) Load, P, versus time, t, for a common triangular load cycle. (b) Displacement, h, consisting of elastic, h e, and plastic, h p, components. (c) Stress at radial location, σR; coupled to P. Note, invariance during loading and linear increase during unloading. (d) Radial crack initiation stress,  $\sigma _{\rm{R}}^{\rm{i}}$; coupled to h p via generated flaws. Note nonlinear decrease during loading and invariance during unloading. (e) Ratio
 ${{{\sigma _{\rm{R}}}} / {\sigma _{\rm{R}}^{{\rm{i}}}$; radial crack initiation occurs for
 ${{{\sigma _{\rm{R}}}} / {\sigma _{\rm{R}}^{\rm{i}}}} = 1$.

Indentation fracture
The indentation fracture analysis begins with a statement of the stresses driving the various crack types shown in Fig. 1, following earlier work [Reference Cook and Pharr5] and derived from the Yoffe analysis [Reference Yoffe16]. On loading:
 $${{{\sigma ^{\rm{C}}}} / H} = \left( 1 \right)0.159 + \left( {{{ - 7} / 2}} \right)0.146{{fM} / H}\quad ,$$
 $${{{\sigma ^{\rm{L}}}} / H} = \left( { - 6} \right)0.159 + \left( 6 \right)0.146{{fM} / H}\quad ,$$
 $${{{\sigma ^{\rm{R}}}} / H} = \left( { - 1} \right)0.159 + \left( 1 \right)0.146{{fM} / H}\quad ,$$
 $${{{\sigma ^{\rm{M}}}} / H} = \left( {{1 / 2}} \right)0.159 + \left( {{{ - 1} / 2}} \right)0.146{{fM} / H}\quad ,$$
and on unloading:
 $${{{\sigma ^{\rm{C}}}} / H} = \left( 1 \right)0.159\left( {{P / {{P_{\max }}}}} \right) + \left( {{{ - 7} / 2}} \right)0.146{{fM} / H}\quad ,$$
 $${{{\sigma ^{\rm{L}}}} / H} = \left( { - 6} \right)0.159\left( {{P / {{P_{\max }}}}} \right) + \left( 6 \right)0.146{{fM} / H}\quad ,$$
 $${{{\sigma ^{\rm{R}}}} / H} = \left( { - 1} \right)0.159\left( {{P / {{P_{\max }}}}} \right) + \left( 1 \right)0.146{{fM} / {H\quad ,}}$$
 $${{{\sigma ^{\rm{M}}}} / H} = \left( {{1 / 2}} \right)0.159\left( {{P / {{P_{\max }}}}} \right) + \left( {{{ - 1} / 2}} \right)0.146{{fM} / H}\quad .$$
The first term in each equation represents the elastic contact field and the second term represents the elastic–plastic mismatch field. Note the normalizations by H. The totals give the stresses at each crack initiation location on the periphery of the plastic deformation zone at the surface or at depth, Fig. 1. C: cone; L: lateral; R: Radial; M: median. These locations are at fixed relative positions in the indentation field on loading, and hence geometrical similarity of the conical indenter requires the stresses to be invariant. On unloading, these locations are at fixed absolute positions, and hence the stresses vary linearly with load. The equations are written to express the similarities noted above in Fig. 1. The cone and median stresses increase with load and are opposite in sign to the lateral and radial stresses, which decrease with load. The elastic and elastic–plastic stresses are all opposed. The elastic–plastic stresses vary linearly with the modulus/hardness ratio, M/H. The term f is a dimensionless parameter that was originally incorporated to account for densification in the plastic deformation zone by anomalous glasses but is here generalized to account for nonzero zone size effects in applying the Yoffe elastic solution [Reference Yoffe16] to an elastic–plastic problem. It is intended here that f is material specific. Full details of the stress field are given elsewhere [Reference Cook and Pharr5].
As an example of the application of Eqs. (5) and (6), Fig. 4(c) shows the variation throughout the indentation cycle of the stress for radial crack initiation, σR/H, for SLG. The stress is initially negative during loading but increases linearly after peak load to eventually become positive during unloading. It was this behavior that was used in the earlier work [Reference Cook and Pharr5] to rationalize radial crack initiation during unloading. To go beyond this “stress is positive” criterion and frame crack initiation in fracture mechanics terms, the precursor crack nucleus must be considered and a criterion for fracture instability to initiate a crack from a nucleus must be imposed. The crack nuclei are most likely mode-II crack-like shear faults generating permanent strain within the plastic deformation zone. The approach taken here is to scale these nuclei with the plastic deformation size [Reference Lathabai, Rödel, Dabbs and Lawn17] and impose instability for the stresses above using a scalar relation in the equilibrium material mode-I toughness, T. The resulting condition is
 $$\Omega \sigma h_{\rm{P}}^{{1 / 2}} = T\quad ,$$
where σ is the appropriate stress from Eq. (5) or (6), h P is given by Eq. (1), and Ω is a dimensionless geometry constant that accounts for the mixed-mode coupling of the crack nuclei and the indentation stress-field components and the proportionality of the nuclei and zone sizes. It is useful to consider  $\Omega = {\Omega _1}\Omega _2^{1/2}$, where (Ω2h P) is the nucleus size and Ω1 is the constant coupling the nucleus size to the indentation stress. It is intended here that Ω is material and crack system specific. Equation (7) is easily inverted to specify the stress required to initiate a crack, or, the “strength” of the nucleus. For example, the initiation stress or strength for radial cracking is given by
 $${{{\sigma ^{{\rm{i,R}}}}} / H} = {T / H}{\Omega ^{\rm{R}}}h_{\rm{P}}^{1/2}\quad ,$$
where the superscript R indicates radial cracks and the superscript i indicates the required initiation stress. σi,R/H from Eq. (8) is plotted in Fig. 4(d) for radial cracks in SLG. Note the inverse relation with the dashed line indicating the zone size in Fig. 4(b) and that the strength decreases during loading and remains invariant during unloading. The toughness above characterizes material fracture equilibrium in the indentation environment. For slow, direct observation experiments in reactive moist air, T in Eq. (7) is reduced from its inert value and thus σi,R/H in Eq. (8) is a lower bound to the initiation strength. Kinetic effects associated with transport of moisture through the plastic deformation zone to the fracture nuclei during indentation are not considered here but would lead to additional strength variations and time dependence.
The ratio of the quantities in Figs. 4(c) and 4(d), the stress, and strength, respectively, provide an initiation criterion. When this ratio, (σR/H)/(σi,R/H), exceeds 1, cracks initiate. Figure 4(e) shows this ratio as a solid line for radial crack initiation in SLG using the information in Figs. 4(c) and 4(d); the value 1 is shown by the dashed horizontal line. On loading, the ratio is negative reflecting the negative stress. On unloading, the ratio increases, and eventually exceeds 1 at t ≈ 1500 s, shown by the dashed vertical line, indicating that the crack initiation criterion is fulfilled during unloading. The initiation point indicated by the dashed vertical line is extended into Figs. 4(d) and 4(c). Note that prior to initiation, the nucleus size was static and that the stress had increased to a value significantly greater than 0 at initiation. A similar static nucleus size during unloading was implicit in the earlier semiquantitative interpretation [Reference Cook and Pharr5], although not quantified. However, a nonzero (tensile) stress at initiation differs from this earlier approach and represents a change in philosophy toward a quantitative, fracture mechanics-based framework. The analysis and procedure illustrated in Fig. 4 can be extended to other crack types in other materials by best-fitting f and Ω to describe and predict experimental observations. Application of the analysis is the subject of the next section.
Results
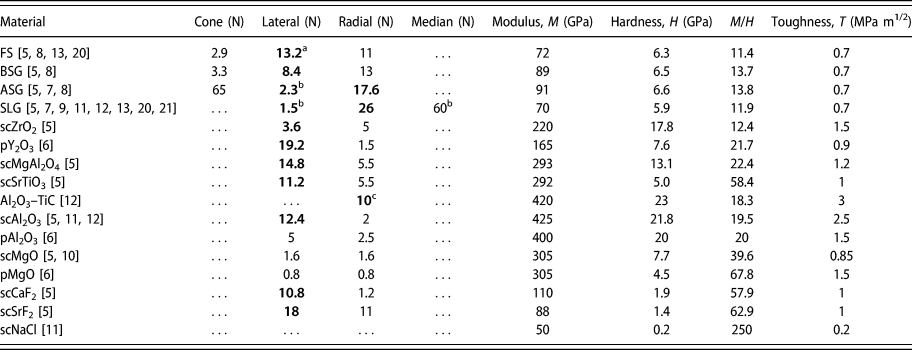
Table I lists the Vickers indentation crack initiation loads observed for glasses, single crystals, and polycrystals taken primarily from the earlier extensive study [Reference Cook and Pharr5] and supplemented by other available information [Reference Cook, Liniger and Pascucci6, Reference Tandon, Green and Cook7, Reference Tandon and Cook8, Reference Tandon and Cook9, Reference Chaudhri and Enomoto10, Reference Thurn, Morris and Cook11, Reference Thurn and Cook12, Reference Yoshida, Kato, Yokota, Sasaki, Yamada, Matsuoka, Soga and Kurkjian13, Reference Arora, Marshall, Lawn and Swain20, Reference Marshall and Lawn21]. Unless noted, the peak contact load P max = 40 N. Values in bold type indicate crack initiation during unloading, e.g., lateral cracking in most materials. An absent value indicates a crack was not observed, e.g., median cracking in most materials, no cracking in NaCl. Where observed, primary and secondary radial crack values were averaged. As noted earlier, most observations are on glasses. As perhaps expected for initiation events, the relative dispersion about the numerical values listed was large, 50% was typical. However, there was almost no dispersion in the initiation location in the indentation cycle, loading versus unloading. There are several additional qualitative points to note, reinforcing earlier observations: First, the glasses are distinct from the crystalline ceramics. Only the densifying glasses, not SLG, exhibit cone cracking under sharp indentation. Only SLG exhibits median cracking. Both cones and medians form at about 60 N on loading. With one exception, only the normal or near-normal glasses SLG and aluminosilicate glass (ASG) exhibit radial cracking on unloading. Second, no real trend distinguishes single crystal from polycrystal ceramics. The crystalline ceramics tend to exhibit radial cracking on loading at about 5 N and lateral cracking on unloading at about 10 N. Third, there appears to be a weak trend from crystal-like behavior (Fig. 2, left) to glass-like behavior (Fig. 2, right) as the M/H ratio decreases.
Crack initiation loads and elastic, plastic, and fracture properties of brittle materials.

a Bold type indicates unloading.
b P max = 80 N.
c P max = 30 N.
FS: fused silica; BSG: borosilicate glass; ASG: aluminosilicate glass; SLG: soda-lime silicate glass; sc: single crystal; p: polycrystal.
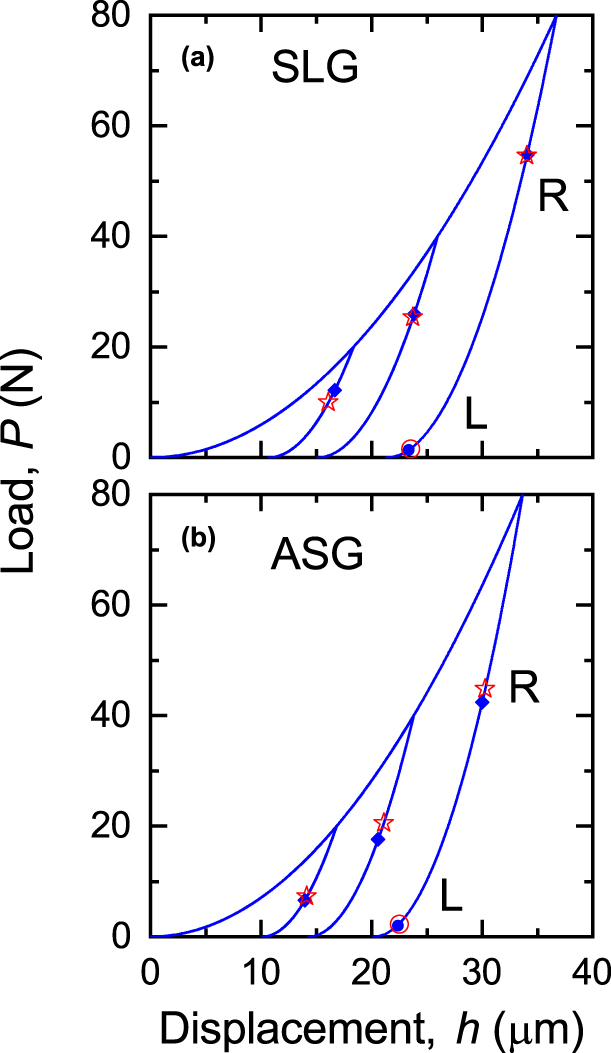
The analysis developed above and the data in Table I were first applied to investigate the effects of peak indentation load on cracking sequences in single materials: Specifically, the distinctive unloading crack initiation phenomena demonstrated by SLG and ASG. Figure 5 shows as solid lines the P–h responses predicted for SLG and ASG using the M and H values in Table I and Eqs. (1)–(4) for peak loads of P max = 20 N, 40 N, and 80 N. The responses exhibit hysteresis with elastic + plastic deformation on loading and elastic recovery on unloading and are in quantitative agreement with observation [Reference Cook and Pharr5]. Also, shown in Fig. 5 as solid symbols are the predicted radial and lateral crack initiation points placed on the P–h responses using the M, H, and T values in Table I, Eqs. (5)–(8), and treating f and ΩR as fitting parameters at P max = 40 N and ΩL at 80 N. For example, f = 0.080, ΩL = 0.0315, and ΩR = 0.870 for SLG, noting that f is a material parameter and crack-type independent. These parameters were used in the creation of Fig. 4. Similarly, f = 0.080, ΩL = 0.0251, and ΩR = 0.308 for ASG.
Indentation cracking sequence model results for (a) SLG and (b) ASG, showing indentation load–displacement responses with superposed radial (R) and lateral (L) crack initiation locations. Solid symbols indicate predictions, open symbols indicate observations.

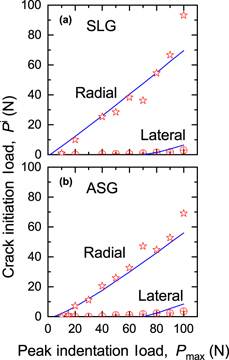
The solid lines and symbols in Fig. 5 are the main output of the work here and indicate crack initiation events in a clear manner on conventional instrumented indentation responses for direct comparison with experimental observations. The open symbols in Fig. 5 represent observations of radial and lateral crack initiation [Reference Tandon, Green and Cook7]. The P max = 40 N radial crack and P max = 80 N lateral crack observations and predictions agree as they were used to calibrate the model. The P max = 20 N and P max = 80 N radial crack observations agree with the predictions and both demonstrate a clear trend of increasing initiation load with increasing peak load. Lateral cracks were not predicted to form at P max = 20 N and P max = 40 N, i.e., these indentation loads were predicted to be “sub-threshold” [Reference Lathabai, Rödel, Dabbs and Lawn17]. A more detailed comparison of the predicted and observed crack initiation loads for both glasses is shown in Fig. 6. The solid lines show the predicted crack initiation loads as functions of peak indentation load using the best-fit material and crack parameters. The open symbols show the observed behavior [Reference Tandon, Green and Cook7]. The radial crack data are well predicted by the model, including the increasing trend with peak load and the threshold of about 5 N [Reference Lathabai, Rödel, Dabbs and Lawn17, Reference Lawn, Dabbs and Fairbanks22]. The model predicts the significant decrease in initiation load for lateral cracks but over-predicts the threshold and the increase in initiation load with peak load. Although not directly testable, the model could also be fit using the established SLG parameter f = 0.080 and an additional crack parameter ΩM = 2.70 to describe median crack initiation at 60 N (Table I).
Radial and lateral crack initiation loads as functions of peak indentation load observed during unloading for (a) SLG and (b) ASG (symbols) compared with predictions from the indentation cracking sequence model (lines).

Cone cracking observations for the anomalous glasses were fit to the model using the values in Table I and Eqs. (5)–(8) to give f = 0.01, ΩC = 0.565, and f = 0.01, ΩC = 0.565 for fused silica (FS) and borosilicate glass (BSG), respectively. The elastic–plastic mismatch parameter f is much reduced in these glasses relative to the normal glasses, reflecting their tendency to densification under indentation and consequent reduced residual fields [Reference Arora, Marshall, Lawn and Swain20]. Using this value of f, radial and lateral cracks were not predicted in these glasses, in contradiction to observation, Table I. Conversely, using the value f = 0.80, cone cracks were not predicted in SLG, in agreement with observation, but also not predicted in ASG, in contradiction to observation, Table I. Median cracks were also not predicted in ASG.
Lateral and radial cracking observations for all crystalline ceramics were fit to the model using Table I and Eqs. (5)–(8). As with the glasses, f was fixed for a single material and Ω adjusted for each crack type. The fitted ranges were 0.21 ≤ f ≤ 0.14, 0.020 ≤ ΩL ≤ 0.60, and 0.52 ≤ ΩR ≤ 4.7. The empirical observations were that the individual material best-fit f values decreased with M/H and individual material best-fit Ω values increased with M/H. Accordingly, for all materials in Table I, simple average linear relations were developed to describe ensemble material and crack parameters  $\bar{f}$,
 ${\bar{\Omega }_{\rm{L}}}$, and
 ${\bar{\Omega }_{\rm{R}}}$:
 $$\bar{f} = 1.37{\left( {{M / H}} \right)^{ - 1}}\quad ,$$
 $${\bar{\Omega }_{\rm{L}}} = 0.00357\left( {{M / H}} \right)\quad ,$$
 $${\bar{\Omega }_{\rm{R}}} = 0.0586\left( {{M / H}} \right)\quad .$$
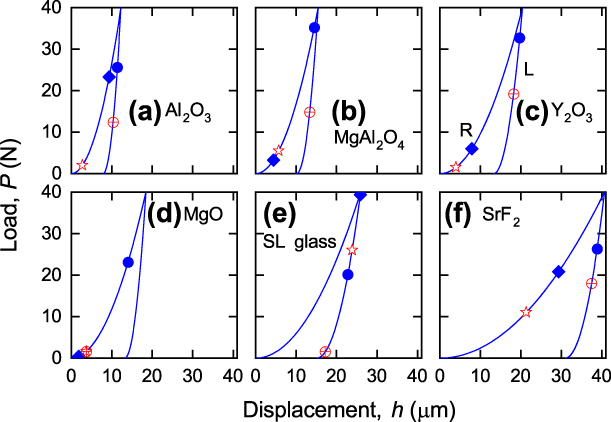
The relative ranges about the ensemble average coefficients in Eq. (9) were about ±25%. Figure 7 shows as solid lines P–h responses predicted for an example group of materials from the ensemble, ranging from stiff, hard scAl2O3, Fig. 7(a), to compliant, soft scSrF2, Fig. 7(f), using the M and H values in Table I and Eqs. (1)–(4) for a peak load of P max = 40 N. The responses increase approximately in displacement in the order Figs. 7(a)–7(f) and are similar to those in Fig. 5, exhibiting hysteresis and quantitative agreement with observation [Reference Cook and Pharr5]. Also, shown in Fig. 7 as solid symbols are the predicted radial (R) and lateral (L) crack initiation points placed on the P–h responses using the M, H, and T values in Table I and Eqs. (5)–(9), using  $\bar{f}$ and
 $\bar{\Omega }$ in Eqs. (5) and (6). In nearly all cases, radial cracking on loading and lateral cracking on unloading was predicted. The open symbols in Fig. 7 represent observations of radial and lateral crack initiation [Reference Cook and Pharr5, Reference Cook, Liniger and Pascucci6]. In nearly all cases, there was very good qualitative agreement (loading versus unloading, radial then lateral sequence) and quantitative (load value) agreement: the predicted mean load values agree with the observed values with about 25% error, within the 50% dispersion typically observed. Once again, the format of Fig. 7 provides for direct comparison with experiment. The extremes of behavior shown in schematic form in Fig. 2 as crack initiation during loading and unloading for MgO and SLG, respectively, are predicted here quantitatively as Figs. 7(d) and 7(e).
Indentation cracking sequence model results for a range of materials, (a) Al2O3, (b) MgAl2O4, (c) Y2O3, (d) MgO, (e) SLG, and (f) SrF2, showing indentation load–displacement responses and radial (R) and lateral (L) crack initiation locations. Observations (open symbols) and predictions using best-fit model parameters (solid symbols).

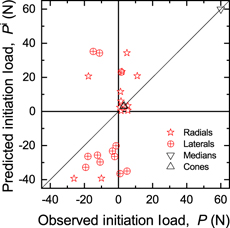
Figure 8 provides a more detailed quantitative comparison of the predicted and observed crack initiation loads. The symbols in Fig. 8 represent single crack systems for all materials in Table I. Cracks predicted or observed to occur during unloading are indicated by negative values. The qualitative success of the model can be judged by the predominance of symbols in the first and third quadrants: crack initiation predicted during loading or unloading was observed during loading or unloading, respectively. The quantitative predictions of the initiation load values of the model are only in moderate agreement with observations, however. There is very good agreement between prediction and observation for cracks that initiate almost immediately on loading, (P ≈ 0). For cracks that initiate later in the contact cycle, the model tends to overestimate the initiation load for both loading and unloading, leading to predictions closer to the peak load (P ≈ P max) than observed, and thus occasionally erring in the predicted initiation quadrant. However, as noted above, the predicted values of the average initiation loads are within the dispersion typically observed experimentally.
Plot of predicted versus observed indentation crack initiation loads. Crack initiation events on unloading shown as negative values.

Discussion and conclusions
The model and experiments presented here greatly extend the techniques of instrumented indentation from the well-established analysis of materials that exhibit elastic–plastic deformation during sharp indentation [Reference Oliver and Pharr1], through the more recent analyses of materials that also exhibit viscous deformation [Reference Cook3] or densification [Reference Cook4], to brittle materials that exhibit indentation fracture. Following the philosophy of the recent works, the results of the analysis are presented in the now-conventional form of indentation P–h responses, originally established to analyze elastic–plastic deformation [Reference Oliver and Pharr1] but now here extended to include superposed crack initiation points. The analysis extends the indentation stress-field formulation developed by Yoffe [Reference Yoffe16] and applied earlier in a qualitative manner [Reference Cook and Pharr5] to a fracture-mechanics–based model of crack initiation that takes account of the increasing size of crack nuclei with indentation load and the toughness of the material. Overall, the model well describes experimental observations of radial, lateral, cone, and median cracking in normal and anomalous glasses (Figs. 5 and 6) and radial and lateral cracking in single crystal and polycrystalline ceramics (Figs. 7 and 8).
The model, adapted by experimental observations, now explains in a quantitative manner why the normal glasses, SLG in particular, are so distinctive in crack initiation sequence by exhibiting radial cracking during unloading, Table I and Figs. 5(a) and 7(d). Glasses are marked by small M/H ratios relative to crystalline ceramics. The empirical observation is that the amplitude coefficient f in the elastic–plastic mismatch term in the stress expressions [Eqs. (5) and (6)] is approximately inverse in M/H, Eq. (9a), rendering the stress expressions material invariant. Radial crack stresses are thus typically small and positive during loading and increase during unloading. However, the radial crack nucleus effectiveness coefficient ΩR is approximately linear in M/H, Eq. (9b), or the strength is inverse in M/H. Hence, for most materials except glasses, the nuclei become large enough or the strength becomes small enough during loading such that radial cracks initiate. For glasses, initiation is usually delayed to unloading as the smaller or less effective nuclei must be of sufficient size to initiate a radial crack in the unloading increasing stress field. The clear dependence of radial crack initiation load with peak indentation load (Fig. 6) is consistent with this view as crack nuclei increase in size with peak load and can thus initiate cracks sooner after unload begins. Similarly, lateral crack stresses are typically negative during loading, increasing and becoming positive during unloading. Hence, most materials exhibit lateral cracking during unloading. For glasses, such cracking is delayed until later in the unloading cycle as the nuclei are smaller or less effective, Table I, and there is again significant peak load effect, Fig. 6. Hence, although cracking observations in glass are prevalent due to relevance in application, ease of experimentation, and clear demonstration of residual stress effects [Reference Marshall and Lawn21], observations on glass relative to crystalline ceramics most probably demonstrate extremes of nucleation rather than stress-field amplitude.
Stress-field amplitudes were considered in some detail in previous extensive analyses of radial [Reference Chiang, Marshall and Evans26, Reference Chiang, Marshall and Evans27] and lateral [Reference Chen, Hutchinson and Evans28] crack initiation. In these earlier analyses, the spatial variations of stress fields relative to the contact radius were determined explicitly throughout the contact cycle, increasing from compression within the plastic deformation zone to peak tension at about the zone edge before decaying to zero remote from the contact. Nuclei within the zone were considered as cracks in equilibrium, with the crack driving forces calculated from integration of the stress fields. Initiation was determined at incipient instability of the extending nuclei. Advantages of these previous analyses include explicit consideration of the stress field (compared with the zone-edge single stress values considered here) and consistency of the stress field and nucleus size at initiation (compared with the imposed zone-related size considered here). The disadvantage of these more accurate fracture analyses is that the significant numerical calculations required impede implementation in conventional indentation P–h presentation. In these analyses [Reference Chiang, Marshall and Evans26, Reference Chiang, Marshall and Evans27, Reference Chen, Hutchinson and Evans28], contact plasticity is considered as an integral part of the crack initiation process through formation of the nuclei and contribution to the stress field. At the other extreme, at blunt, spherical contacts, plasticity acts to restrain crack initiation, such that small radius contacts generate localized plastic deformation and large radius contacts generate cone cracks. Such changes can be demarcated as quasiplasticity to brittle fracture transitions for blunt contacts [Reference Rhee, Kim, Deng and Lawn29] that here would be regarded as subthreshold to postthreshold transitions for sharp contacts.
Successful as the early work [Reference Cook and Pharr5] was in providing an historical, experimental, and analytical framework for indentation cracking sequences, the experimental technique and Yoffe-based analytical methods have not been much implemented (although the latter has been compared with finite element analyses [Reference Feng, Qu, Huang and Nix30]). There are several likely reasons for this: (i) the required experimental instruments are custom-built, not commercially available; (ii) the technique is not easily automated, requiring near-continuous operator observation; (iii) the technique is restricted to transparent or translucent materials; and (iv) the increased application of commercial, automated, nanoindentation techniques to practically all materials shifted attention away from indentation fracture to indentation deformation. The last point is probably the most important, and the instrumented indentation P–h response is now the standard method of presenting indentation data. The early work presented the experimentally observed indentation cracking sequences superposed on measured P–h responses but did not analyze the P–h data. Although the Yoffe model is framed analytically in terms of P, it is a stress-field model not a fracture model and connections between the model and cracking observations were made semiquantitatively by considering tensile components in the indentation stress field. Here, the earlier work was extended by applying deformation analysis to P–h data appropriate to indentation cracking and by developing a fracture-based crack initiation sequence analysis that connects the P-based Yoffe elastic stress field to h-based crack nuclei.
Perhaps the most obvious implication of this analysis relative to the applications outlined in the introduction is to fracture strengths limited by elastic–plastic contact flaws. Such strengths are controlled by the final length of the radial or median crack and the final intensity of the residual stress field [Reference Marshall and Lawn21], at conclusion of the contact cycle. As lateral cracks reduce residual stress fields by decoupling the plastic deformation zone from the surrounding elastic matrix, lateral crack initiation and growth can both impede radial and median crack initiation and development and reduce the final residual field intensity. Broad generalizations include the following: the delayed initiation of lateral cracks in glasses will lead to unaffected radial and median crack development and subsequent residual stress-field reduction. The strength-controlling cracks are thus likely to exist in metastable nonequilibrium states. Conversely, the earlier initiation of lateral cracks in crystalline ceramics will lead to radial crack development in reduced residual fields. The strength-controlling cracks are thus likely to be in equilibrium states, albeit at decreased lengths. A second implication for nondestructive evaluation (NDE) of manufactured components is that observation of lateral crack-related chips or scratches on surfaces will nearly always be associated with weakened components through the prior initiation of radial or median cracks in a contact cycle. Combining these two implications suggests that NDE applied to manufactured glass products will be more effective than NDE applied to crystalline ceramic products in identifying weakened components.
Finally, it is clear that improvements to the model so as to provide a closer fit to experimental observations require a relaxation of the simplicity of materials–invariant parameters of Eq. (9). Such relaxation would implicitly be accounting for the different relative locations of initiation within the plastic deformation zone of the various crack geometries. For example, radial cracks probably initiate closer to the zone periphery than do lateral cracks, with attendant nucleus and stress-field variations. Hence, “better” estimates of material modulus, hardness, and toughness (including the environmental effects noted above) would not really help as now material-dependent model parameters would just be adjusted accordingly. An approach that would probably provide more physical insight into the initiation process is to include variation in the model parameters for a single material to account for experimental dispersion, i.e., explicitly include scatter in Eq. (9). Other steps might be to extend the observations to opaque materials, to extend the analysis to include contacts of various shape, and to include toughness variation effects.